UNIVERSIDADE DE LISBOA
FACULDADE DE CIÊNCIAS
DEPARTAMENTO DE BIOLOGIA ANIMAL
Role of Monocarboxylate transporter 1 (MCT1) and
Lactate dehydrogenase A chain (LDHA) in Acute
Myeloid Leukaemia (AML)
Filipa Mafalda dos Santos Aires Brito
Mestrado em Biologia Humana e Ambiente
5
UNIVERSIDADE DE LISBOA
FACULDADE DE CIÊNCIAS
DEPARTAMENTO DE BIOLOGIA ANIMAL
Role of Monocarboxylate transporter 1 (MCT1) and
Lactate dehydrogenase A chain (LDHA) in Acute
Myeloid Leukaemia (AML)
Filipa Mafalda dos Santos Aires Brito
Mestrado em Biologia Humana e Ambiente
Dissertação para o grau de Mestre orientada por:
Profª. Doutora Jacinta Serpa (orientação externa)
CIPM-IPOFG Lisboa, EPE; Faculdade de Ciências Médicas da
Universidade Nova de Lisboa.
Profª. Doutora Deodália Dias (orientação interna)
CESAM; Faculdade de Ciências da Universidade de Lisboa.
9
Agradecimentos
Esta dissertação não teria sido possível sem a ajuda e apoio de várias pessoas que me apoiaram e ajudaram directa ou indirectamente e a quem gostaria de deixar o meu agradecimento.
Gostaria de começar por agradecer à Doutora Jacinta Serpa pela orientação científica durante este projecto, pelas críticas construtivas, pela disponibilidade para tirar qualquer dúvida, pela paciência e pela revisão da tese.
À Doutora Deodália Dias por ter acedido a ser minha orientadora interna e pela disponibilidade, atenção e motivação ao longo desta etapa académica.
Ao Doutor Sérgio Dias por me ter dado a oportunidade de trabalhar neste projecto, pelo enriquecimento científico e pela afabilidade com que sempre me tratou.
Um obrigado muito especial à Sofia Fernandes, por ter sido uma ajuda imprescíndivel durante o desenvolvimento deste trabalho, pelos ensinamentos teóricos e práticos, por estar sempre disponível a ajudar e principalmente pela simpatia e companhia.
Ao grupo da Angiogénese por me ter apoiado durante o desenvolvimento do trabalho e desta tese, pela alegria e boa disposição, e pela disponibilidade para ajudar, obrigado também à Germana pelos dados das amostras de doentes. A todos os meus colegas de laboratório pela ajuda prestada, pela companhia e simpatia, assim como aos restantes membros do CIPM. Obrigado à Lídia e à Fernanda pela companhia durante este percurso e um especial agradecimento à Sofia Fragoso principalmente por todos os conselhos e amizade e à Inês Figueiredo.
Um muito obrigado aos meus amigos pela paciência, carinho, apoio e constantes mensagens de motivação e amizade. Aos que duram à mais de uma decada (Teresa, Ana Sofia, Diana, Carolina, André e Jorge), aos que partilharam tudo comigo durante 3 anos e continuam a ser uma presença constante (Mariazinha, Marta, a amiga Guiomar, Vera, Blue, Maria Luísa, Joana, Tiago, Fábio, Ânia, Eva, Eduardo e Barcelos), e ainda ao Francisco Vidal e ao Francisco Mouro. E ainda um agradecimento muito especial à Vânia Silva pelos conselhos, ajuda, motivação, pelo conhecimento partilhado e discussões científicas, e por ser um excelente exemplo do que há de melhor em investigação.
Por último, um muito obrigado à minha família. À Daisy por ser a melhor companhia; à minha irmã Margarida por ser a pessoa especial que é e por todos os momentos inesquecíveis; aos meus pais pelo amor e apoio incondicionais e por acreditarem em mim; à minha avó Florinda que tem sido uma presença constante e imprescindível, e à minha avó Milú pela inspiração e motivação.
11
Resumo
Desde a descoberta do “Efeito de Warburg”, a primeira alteração bioquímica qualitativa descoberta em células cancerígenas que tem por base a alteração do mecanismo preferencial de produção de ATP, que o metabolismo tumoral tem vindo progressivamente a ser considerado como uma das mais importantes características dos tumores. Esta característica foi efectivamente considerada como uma das principais características tumorais emergentes (Hanahan e Weinberg, 2011). Células não tumorais fazem a produção de ATP através da fosforilação oxidativa, enquanto algumas células tumorais parecem optar por um mecanismo alternativo de produção de ATP, a glicólise anaeróbia (Berg et al., 2006). Ao optar por esta via alternativa as células cancerígenas estão efectivamente a escolher uma via que produz menos moléculas de ATP por mole de glucose. Assim, vários trabalhos têm-se debruçado sobre os motivos pelos quais as células tumorais optam por esta via e hoje em dia pensa-se que a produção de lactato leva a uma acidificação do meio circundante que pode ser benéfico para as células tumorais uma vez que está ligado em alguns cancros a um comportamento mais invasivo e metastático (Postovit et al., 2002; He et al., 2004). Foi também proposto que o efeito de Warburg nas células tumorais pode permitir às células a produção de maior quantidade de amino ácidos, lípidos, ácidos gordos e nucleótidos ao permitir que a glucose seja utilizada por percursores da síntese destas molélulas (Vander Heiden et al., 2009).
O lactato é produto da glicólise, sendo que em mamíferos o lactato proveniente de tecidos glicolíticos sofre gluconeogénese no fígado através do ciclo de Cori (Berg et al., 2006). O lactato foi proposto como sendo uma molécula sinalizadora (Hashimoto et al. 2007). O alastramento do lactato em tecidos está geralmente associado a hipóxia (baixos níveis de oxigénio) e áreas de necrose (Shcroeder et al., 2005 ).
Os transportadores de monocarboxilados (MCTs) medeiam o transporte de moléculas com um grupo carboxílico (monocarboxilados) através das membranas celulares. Em células não cancerígenas eles são responsáveis pela manutenção do pH intracelular através do efluxo de lactato (Dimmer et al., 2000). Vários monocarboxilados usam estes transportadores tais como piruvato e lactato, demonstrando a sua importância na comunicação intercelular (Poole and Halestrap, 1993). Os diferentes MCTs parecem ser definidos pela sua ligação ao substrato e especificidade, provavelmente através do seu C-terminal que é menos conservado que o N-terminal (Halestrap and Meredith, 2004). Até à data foram identificados 14 MCTs em mamíferos sendo que o MCT1, MCT2, MCT3 e MCT4 já foram avaliados como melhorando o transporte de monocarboxilados ligado a H+ entre os locais de secreção e remoção (Halestrap and Price, 1999). Pensa-se que os MCTs 1 e 4 estão
12
associados a um aumento da agressividade tumoral, sendo que necessitam de uma molécula auxiliar, CD147 (também conhecido por basigin), para a sua expressão funcional correcta e para o transporte de lactato (Kirk et al., 2000).
As lactato desidrogenases (LDHs) catalizam a conversão que se dá de piruvato a lactato (LDHA) e vice versa (LDHB). A LDH tem cinco isozimas diferentes, que ao associar dois péptidos (M e H) codificados por dois genes (A e B, respectivamente) dão origem a tetrâmeros (Koen and Goodman, 1969). Existe também uma outra forma tetramérica, LDH-C4, codificada por um outro gene (LDHC) presente apenas nos testículos maduros e esperma (Markert et al., 1975). Pensa-se que a expressão programada de LDH ocorre durante o desenvolvimento, no estadio de diferenciação das células germinativas (Thomas et al., 1990).
Leucemias são cancros do sangue e são classificadas de acordo com a sua linhagem na hematopoiese, pelo que podem ser divididos de acordo com as duas principais linhagens sanguíneas: mielóides e linfóides. A leucemia mielóide aguda é um neoplasmo maligno clonal das células hematopoiéticas progenitoras da medula óssea em que estes blastos perdem a capacidade de se diferenciarem normalmente e de responder a reguladores normais da proliferação (Passegué et al., 2003). O que acontece na leucemia mielóide aguda é que as células sanguíneas anormais sobrepopulam a medula óssea, substituindo as células sanguíneas normais e interrompendo a hematopoiese normal (Goldsby et al., 2002). As leucemias são classificadas pela Federação Francesa-Americana-Britânica (FAB) de acordo com vários critérios como a morfologia, citoquímica e fenótipo imunológico, definindo assim 8 principais subtipos de leucemia baseados no tipo de linhagem e no grau de diferenciação dos blastos (Head et al., 1985).
A acidose láctica é definida por níveis elevados de lactato e está geralmente associada a exercício físico e respiração de baixas taxas de oxigénio mas também tem sido descrita em doenças e cancros, especialmente malignâncias hematológicas como leucemias e linfomas (Friedenberg et al. 2007). Em tumores os elevados níveis de lactato derivados da glicólise e que rapidamente aumentam o nível intracelular de lactato e que são exportados para a corrente sanguínea são a causa da acidose láctica. A acidose láctica em malignâncias hematológicas está associada a um prognóstico da doença extremamente mau, tendo sido recentemente descrito um caso de morte fulminante por acidose láctica (Sillos et al., 2001; Terpe et al., 2012)
O factor de crescimento VEGF é descrito como tendo um papel na função celular de tumores (proliferação, sobrevivência, migração e invasão) e no homing de progenitores da medula óssea (Ellis and Hicklin, 2008). Em células HL60 foi demonstrado que o loop autócrino interno e externo do VEGF
13
com um dos seus receptores (VEGFR2) está associado à regulação da sobrevivência em leucemia (Santos et al., 2004).
Este trabalho visa elucidar o papel do metabolismo do lactato em leucemia mielóide aguda pelo que foram propostos alguns objectivos específicos, como a avaliação da modelação da expressão de MCT1, MCT4, LDHA e LDHB pelo lactato, a avaliação da incorporação de carbonos do lactato em outros compostos e a avaliação do papel do VEGF na expressão de MCT1, MCT4, LDHA e LDHB.
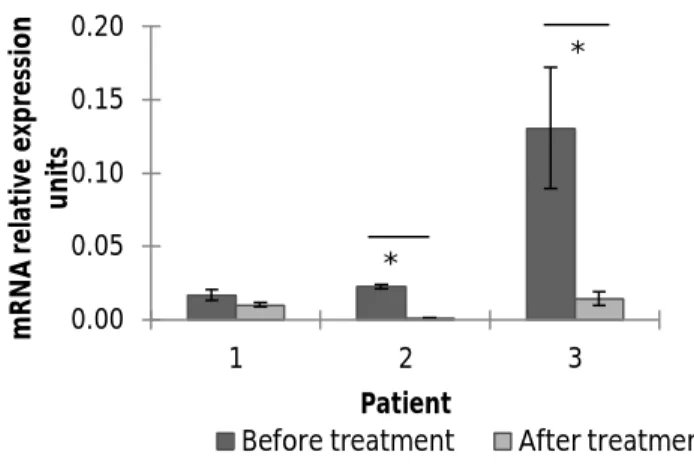
Concluímos que os níveis elevados de MCT1 detectados à altura do diagnóstico de pacientes podem estar relacionados com os níveis de blastos leucémicos. Os ensaios com a linha celular de leucemia mielóide aguda HL60 revelaram que os níveis de expressão de proteína de MCT1 e LDHA parecem ser modulados pelo lactato, enquanto os níveis de expressão proteica de MCT4 parecem a estar a ser também modulados pelo VEGF. Os nossos resultados sugerem a existência de um loop funcional de influxo/efluxo de NaLac mediado pelo MCT1 e MCT4, sendo mantido devido à acção catalítica da LDHA e LDHB. A exposição crónica das células HL60 a lactato parece conferir às células capacidade de adaptação ao ambiente mais ácido, através do aumento da expressão de MCT1 e LDHA. A análise do ensaio de NMR revelou que os carbonos do lactato-C13 marcado estão a ser incorporados em diversos constituintes como amino ácidos e acetato.
Assim, como conclusão final do trabalho propomos o MCT1 e/ou MCT4 como possíveis alvos terapêuticos uma vez que os resultados obtidos sugerem fazerem parte de um loop funcional de influxo/efluxo de lactato que pode estar envolvido na manutenção da acidose láctica intracelular.
Palavras chave: Switch metabólico, lactato, acidose láctica, transportadores monocarboxilados
15
Abstract
Tumour cells opt for alternative pathways for ATP production, a pathway generally used in hypoxia but that tumour cells use even in the presence of oxygen. This metabolic switch is known as the Warburg effect. The Warburg effect has been described as having a protective role for tumour cells by increasing acidosis which is associated with higher levels of invasion and metastasis.
Lactate (NaLac) has been described as a signalling molecule and its role in tumour metabolism has recently been the object of several studies.
Monocarboxylate transporters are membrane transporters of monocarboxylates, such as lactate and pyruvate, both of which are implicated in the Warburg effect. They have a major role in NaLac transport, namely of MCT1 and MCT4, which transport NaLac into and from the cells,, also regulating the pH in the cells and serving as intercellular communicators.
Lactate dehydrogenases are enzymes responsible for the reactions occurring between pyruvate and lactate, where LDHA catalyses the reaction of pyruvate to NaLac and LDHB the opposite reaction. LDHs are thereby essential in sustaining glycolysis.
Lactic acidosis has been linked to haematological malignancies such as leukaemias, where it is caused by the intracellular increase in NaLac due to glycolysis.
This work aims to elucidate the role of NaLac metabolism in acute myeloid leukaemia. As such we evaluated the modulation of MCT1, MCT4, LDHA and LDHB expression by NaLac, but also the incorporation of carbons from lactate in other compounds and evaluated the role of VEGF in MCT1, MCT4, LDHA and LDHB expression.
Overall, NaLac and VEGF modulate MCT1, MCT4, LDHA and LDHB expression at least at the protein synthesis level. A functional loop of NaLac influx/efflux mediated by MCT1 and MCT4 that is also maintained due to the catalytic action of LDHA and LDHB is suggested by our results. In our model, the role of NaLac as a carbon source was shown. Nevertheless, the role of NaLac as a signalling molecule should be addressed in future studies.
We conclude that MCT1 and/or MCT4 may be a suitable therapeutic approach as our results suggest they are part of NaLac functional influx/efflux loop that could be involved in maintaining intracellular lactic acidosis.
Key words: metabolic switch, lactate, lactic acidosis, monocarboxylate transporters (MCTs), lactate
17
Index
Agradecimentos ... 9 Resumo ... 11 Abstract ... 15 Index ... 17 Index of figures ... 19 Index of tables ... 20 List of abbreviations ... 21 1. Introduction ... 23 1.1 Tumour metabolism ... 23 1.2 Monocarboxylate Transporters ... 25 1.3 Lactate Dehydrogenases ... 28 1.4 Bone Marrow ... 291.5 Acute Myeloid Leukaemia ... 31
1.6 Lactic acidosis and malignancies ... 33
1.7 Autocrine loop in AML ... 34
2. Aims ... 35
3. Material and methods ... 37
3.1 Biological material ... 37
3.2 Sample processing... 37
3.2.1 Cell culture ... 37
3.3 Relative quantifying PCR for MCT1, MCT4, LDHA, LDHB, PEPCK, G6PD ... 38
3.4 Western Blot ... 39
3.5 Immunofluorescence ... 40
3.6 Construction of promoter deletion constructs ... 40
3.6.1 Acquisition of insert coding sequence ... 40
3.6.1.1 PCR reaction ... 40
3.6.1.2 Sequencing reaction ... 41
3.6.2 Plasmid construction and cloning ... 42
3.6.3 Plasmid isolation ... 43
3.7 Transfection of HL60 and HL60 long-term NaLac cell lines ... 43
3.7.1 Transfection ... 43
18
3.8.1 Bisulfite reaction and DNA conversion ... 44
3.8.2 PCR and sequencing ... 45
3.9 Cell extracts and NMR spectroscopy ... 45
4.1. Role of NaLac and VEGF in MCT1, LDHA and LDHB expression ... 47
4.1.1. Protein expression- immunofluorescence and western blotting ... 47
4.1.2. mRNA expression- RQ-PCR ... 49
4.2. Role of chronic exposure to NaLac in MCT1, LDHA and LDHB expression ... 50
4.3. MCT1, LDHA and LDHB promoters’ activity- Luciferase reporter gene assay... 52
4.3.1 HL60 ... 52
4.3.2 HL60 Long-term NaLac ... 54
4.4. Methylation profile of MCT1 and LDHA promoters ... 57
4.5 Cell extracts and NMR spectroscopy ... 58
5. Discussion ... 59
5.1 Future perspectives ... 61
6. Conclusions ... 62
7. References ... 64
19
Index of figures
Figure 1 - Topology of a monocarboxylate transporter……… Figure 2 - LDH polypeptides and composition of LDH isozymes……….….. Figure 3 - Normal and leukaemic bone marrow niche………..….. Figure 4 - FAB classification of various AML subtypes……….. Figure 5 - RQ- PCR for MCT1 expression in bone marrow samples of AML patients……….. Figure 6 - Immunofluorescence for MCT1, LDHA and LDHB protein detection in HL60 control cells
and HL60 cells exposed to NaLac, VEGF and VEGF+NaLac……….………
Figure 7 - Western blotting for LDHA detection in extracts of HL60 cells cultured with NaLac and/or
VEGF……….
Figure 8 - Western blotting for LDHB detection in extracts of HL60 cells cultured with NaLac and/or
VEGF………..
Figure 9 - RQ- PCR for MCT1, MCT4, LDHA and LDHB expression in HL60 cells cultured with NaLac
and /or VEGF………
Figure 10 - Immunofluorescence for MCT1, LDHA and LDHB protein detection in HL60 control and
NaLac subjected cells and HL60 LT NaLac cells………
Figure 11 - RQ-PCR for MCT1 expression.……….. Figure 12 - RQ-PCR for LDHA expression……… Figure 13 - RQ-PCR for LDHB expression………. Figure 14 - Luciferase reporter gene assay for MCT1 gene promoter in HL60 cells………. Figure 15 - Luciferase reporter gene assay for LDHA gene promoter in HL60 cells………. Figure 16 - Luciferase reporter gene assay for LDHB gene promoter in HL60 cells………. Figure 17 - Luciferase reporter gene assay for MCT1 gene promoter in HL60 LT NaLac cells……….. Figure 18 - Luciferase reporter gene assay for LDHA gene promoter in HL60 LT NaLac cells……….. Figure 19 - Luciferase reporter gene assay for LDHB gene promoter in HL60 LT NaLac cells……… Figure 20 - Methylation patterns of an MCT1 promoter CpG island……….. Figure 21 - Methylation patterns of two LDHA promoter CpG island………. Figure 22. 13C-NMR spectra of the intracellular metabolites of HL60………
Figure 23 – Integrative schematic representation of our conclusions……….
26 28 30 32 47 48 48 49 49 50 51 51 52 53 53 54 55 56 56 57 58 59 63
20
Index of tables
Table 1 - Conditions for cDNA synthesis……… Table 2 - Program used for PCR……… Table 3 - Program used for sequencing reaction………. Table 4 - Program used for bisulfite conversion PCR……… Table 5 - Primers used during the experimental work………
38 41 42 45 46
21
List of abbreviations
AML – Acute myeloid leukaemia ATP – Adenosine triphosphate BM – Bone marrow
BSA – Bovine serum albumin
CD147 – Cluster of differentiation 147 (also known as basigin or EMMPRIN – Extracellular matrix metalloproteinase inducer)
cDNA – Complementary DNA DAPI - 4’-6-diamidino-2-phenylindole DNA – Deoxyribonucleic acid dNTPs – Deoxynucleotides FBS – Fetal bovine serum HRP – Horseradish peroxidase HSC – Hematopoietic stem cell
LDHA – Lactate dehydrogenase A chain LDHB - Lactate dehydrogenase B chain MCT1 – Monocarboxylate transporter 1 MCT4 - Monocarboxylate transporter 4 miR – microRNA
mRNA – Messenger RNA NaLac – Lactate
NMR – Nuclear magnetic resonance OXPHOS – Oxidative phosphorylation PBS – Phosphate buffered saline PCR – Polymerase chain reaction RNA – Ribonucleic acid
RT – Reverse transcription
RQ-PCR – Relative quantifying polymerase chain reaction
22
UV – Ultraviolet
VEGF – Vascular endothelial growth factor
23
1. Introduction
1.1 Tumour metabolism
Tumour metabolism has been added as an emerging hallmark to ‘Hallmarks of Cancer’ by Hanahan and Weinberg (2011) in a recent review of their initial compilation, due to its ability to effectively support neoplastic proliferation through the modification or reprograming of cellular metabolism.
Human cells require energy, adenosine triphosphate (ATP), to run metabolic pathways and undergo chemical reactions. Although most ATP production is due to oxidative phosphorylation (OXPHOS) there are other pathways that have the same end point. Cells preferably use OXPHOS, thus needing available oxygen molecules, due to its high energy output: thirty-six molecules of ATP per initial molecule of glucose (Berg et al., 2006). In cellular respiration a molecule of glucose undergoes glycolysis reaction in the cytoplasm of the cell, resulting in its breakdown to two molecules of pyruvate and the net gain of two molecules of ATP and two NADH. Pyruvate can then undergo either aerobic or anaerobic respiration in order to yield more energy (Berg et al., 2006). In aerobic respiration pyruvate is oxidized to acetyl-CoA and will enter the citric acid cycle in the mitochondrion. Oxidation of the NADH produced in the citric acid cycle through the electron transport chain and phosphorylation of ADP result the production of ATP and H2O (Berg et al., 2006). Anaerobic respiration, which generally occurs in the absence of oxygen (hypoxia), converts the pyruvate into lactate, allowing NAD+ to be replenished and redox state is maintained for further glycolysis (Berg et al., 2006).
In the 1920s, a time when cancer cells were only distinguished from normal cells by their morphology, Otto Warburg was the first to discover a biochemical qualitative change between normal and cancer cells. Warburg observed that proliferating ascites tumour cells consume glucose at higher rates than normal cells and that in those cells pyruvate is instead converted into lactate versus being completely oxidized, in what became known as the “Warburg effect”, referring to the preference proliferating cells give to increased anaerobic glycolysis even in the presence of high levels of oxygen (Warburg, 1956). The Warburg effect has since been described in a multitude of solid tumours, lymphomas and leukaemias (Walenta et al., 1997; Brizel et al., 2001). It allows a tumour’s proliferating cells to meet the high demand for amino acids, lipids, fatty acids and nucleotides and at the same time produce enough ATP, by allowing glucose that would be
24
completely converted into CO2 during OXPHOS, to be used by precursors such as ribose for nucleotide synthesis among others (Vander Heiden et al., 2009).
Cancer cells present an accelerated metabolism as well as increased requirements for ATP production, and proliferating cells that undergo the Warburg effect, despite yielding lower energy comparing to cells that undergo complete glucose oxidation, are thought to have a decrease in oxidative stress during DNA replication due to this metabolic adaptation which could translate into DNA and protein protection from oxygen radicals during OXPHOS (Brand and Hermfisse, 1997).
The use of glycolysis even in the presence of oxygen –aerobic glycolysis- may seem counterproductive since it only produces 2 mole of ATP per mole of glucose vs. 36 mol of ATP per mole of glucose derived from oxidative respiration while at the same time giving rise to a possible negative effect: an acidic environment, which could potentially be toxic. Thus there must be some sort of benefit for cancer cells to use this mechanism instead of the one that the majority of normal cells undergo. In fact, the adjacent tissue is under worse conditions compared to cancer cells due to a higher susceptibility to toxicity while the acidic environment in some cancers is linked to more invasive and metastatic behaviour of cancer cells (Postovit et al., 2002; He et al., 2004).
Acidosis associated with tumour microenvironment is related to hypoxia, which in turn is responsible for oncogene activation and transformation. Hypoxia-induced activity of transcription factors, namely, HIF-1, has been described as helping cancers deal with acidosis by enhancing expression of several pH-regulating systems (Chiche et al., 2010). It has been proposed that hypoxia may act as a signal leading to increased cancer cell growth (Brown, 2000; Knowles and Harris, 2001).
HIF-1α transcriptionally regulates hypoxia-induced gene expression, this has been highly characterized in mammals (Semenza, 2000). HIF-1α protein, in normoxic conditions, is ubiquitously expressed and degraded (Semenza, 2000). During hypoxia it forms a dimer by binding to the anyl hydrocarbon receptor nuclear translocator (ARNT). It then translocates to the nucleus where it initiates transcription of genes such as LDHA, vascular endothelial growth factor (VEGF) and others which help to survive under hypoxic conditions (Ikeda et al., 1995; Semenza et al, 1996). HIF-1α has been demonstrated to act as a transcription factor in hypoxia which has lead it to be proposed as a target for cancer therapy (Semenza, 2003; Yeo et al., 2004).
Both a decrease in oxygen levels and an increase in metabolic rate over the capacity of aerobic metabolism can lead to increased glycolysis and lactate production. Lactate is also produced in normoxia and is considered to be important in cell signalling but can also be considered as
25
oxidative fuel in carbohydrate tissue redistribution, being oxidized to pyruvate which then enters the citric acid cycle in the mitochondrion (Brooks, 2002; Gladden, 2004).
Lactate has a dual role in the cell. Regarding its involvement in the delivery of oxidative and gluconeogenic substrates it can be designated an intracellular lactate shuttle; while due to its role in cell signalling it can take the name of cell-cell shuttle (Brooks et al, 2002). Lactate has been proposed as a signalling molecule as it increases transcriptional expression of cytochrome c oxidase and proliferator activated-receptor γ coactivator-1α (PGC-1α). PGC-1α was shown to be involved in mitochondrial biogenesis and to increase MCT1 expression (Hashimoto et al., 2007).
Proliferating tumour cells can use both glucose and lactate or opt to use only lactate, allowing the remaining glucose to fuel hypoxic cells away from tumour blood vessels by diffusing further into the tumour (Sonveaux et al., 2008). The glycolytic pathway may also be positively linked to the expression of oncogenes (i.e. Myc and Ras) and/or the loss of tumour suppressor genes (i.e. p53) which act on HIF-regulated metabolic factors (Levine and Puzio-Kuter, 2010). The spread of lactate in tissues has been associated with hypoxia and with necrosis (Schroeder et al., 2005). In mammals, lactate derived from glycolytic tissues undergoes gluconeogenesis in the liver, through the Cori cycle. It is hypothesized that this could be one of the various mechanisms of cancer progression, considering the fact that tumour lesions which can effectively invade export glucose-derived H+ (producing acid due to the high consumption of glucose), therefore leading to degradation of the extracellular matrix and allowing cancer to invade host organs more efficiently (Gillies et al., 2008).
1.2 Monocarboxylate Transporters
Transport of lactate across membranes is essential for redistribution of carbohydrates during and following hypoxia and it requires transport proteins. Monocarboxylate transporters mediate the transport of monocarboxylates, molecules that have one carboxylic group, across cell membranes. Metabolically important monocarboxylates use these transporters, such as pyruvate, lactate, ketone bodies and branched chain oxo acids thus highlighting MCTs involvement in metabolic communication between cells (Poole and Halestrap, 1993).
In normal cells they are responsible for the maintenance of intracellular pH through the efflux of lactate from the cell (Dimmer et al., 2000).
26
Monocarboxylate transporters are constituted by 12 transmembrane domains with a large intracellular loop between domains 6 and 7 and intracellular N- and C-termini (Poole and Halestrap, 1993) (Figure 1).
Figure 1. Topology of a monocarboxylate transporter. Of note are the various hydrophilic regions – N and C-teminal residues and the large
intracellular loop region between transmembrane-spanning segments 6 and 7 [from Juel and Halestrap, 1999]
The N- terminus was found to be more conserved between the different MCTs and it is thought to be responsible for localization within the cell membrane whereas the C- terminus is less conserved among different MCTs and is thought to be related to substrate binding and specificity (Halestrap and Meredith, 2004).
Transmembrane-spanning segments are a more common feature between the various isoforms, as shown by greater sequence conservation between the different family members, opposed to divergent hydrophilic regions (Saier, 1994).
There are 14 MCTs identified in mammals, of which only MCT1, MCT2, MCT3 and MCT4 have been proven to enhance H+-linked transport of monocarboxylates, such as lactate between sites of secretion and removal (Halestrap and Price, 1999).
From the 14 MCTs only 3 (MCT1, MCT2 and MCT4) have lactate, pyruvate and ketone bodies as predominant substrates; MCT3 also has lactate as predominant substrate but not pyruvate or
27
ketone bodies. In Xenopus oocytes MCT2 demonstrates a higher affinity in catalysing the transport of its substrates compared to MCT1, while MCT4 presents a lower affinity than MCT1 (Halestrap and Meredith, 2004).
MCTs have been shown to be involved in cancer by facilitating glycolytic tumour survival (Pinheiro et al., 2008).
MCT1 can be found in all tissues and sometimes only in certain locations on the tissue (Halestrap and Price, 1999). It can be found along with MCT2 in different tissues such as liver, brain, and kidney although with distinct locations (Jackson et al., 1997). MCT2 is nearly absent in skeletal muscle and it appears to have different tissue distribution and sequence between species (Halestrap and Meredith, 2004). The MCT3 is expressed in the pigmented epithelium of the retina in chicken and rats (Yoon et al., 1997). MCT4 although present in most tissues is strongly associated with typically glycolytic tissues such as skeletal muscles, which may be due to its importance in lactic acid efflux from muscles relying more on the glycolytic metabolism for their production of ATP ( Juel and Halestrap, 1999; Pilegaard et al. 1999).
Expression of MCT1 and MCT4 on cancer cell’s surface is thought to be associated with increased tumour aggressiveness and they require the presence of a chaperone molecule, CD147 (also known as basigin) a scaffolding glycoprotein essential for cell surface functional expression and lactate transport. CD147 regulates the plasma membrane levels of both MCT1 and MCT4 (Kirk et al. 2000).
Human and mouse MCT1 is a target of at least three miRNAs, miR-29a, miR-29b and miR-124 which could possibly regulate lactate secretion in an indirect way (Pullen et al., 2011).
Sonveaux et al. (2008) have proposed that within a solid tumour MCT1 has a paramount importance in metabolic symbiosis due to its role in the exchange of lactate between glycolytic and oxidative tumour cells.
MCTs have been proposed as possible means to deliver carboxylated drugs across the blood-brain barrier (Tsuji and Tamai, 1999).
Monocarboxylate transporters work to prevent acidification of the cytosol and in environments with low oxygen tension tumour cells develop extra intracellular pH-regulating systems, such is the case of MCT4 which has been found to be upregulated by HIF-1α in hypoxic conditions (Ullah, Davies and Halestrap, 2006).
28
1.3 Lactate Dehydrogenases
Lactate dehydrogenases (LDH) catalyse the transfer of hydrogen atoms and electrons between pyruvate, NADH and H+ and lactate (LDH-M) and NAD+ and the reverse reaction (LDH-H).
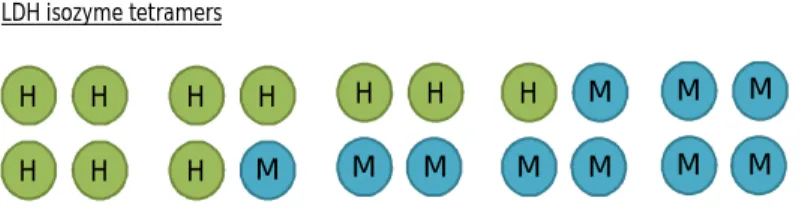
Lactate dehydrogenase has 5 different isozymes, derived from random associations of two polypeptides (M and H) encoded by two different genes – LDHA and LDHB - respectively, forming tetramers: LDH1 (H4), LDH2 (H3M1), LDH3 (H2M2), LDH4 (H1M3) and LDH5 (M4) (Markert, 1963) (Figure 2). In vertebrates H4 is usually present in higher quantities in the heart whereas M4 has been found largely in skeletal muscle. These isozymes differ in several characteristics, such as its amino acid composition, immunological characteristics, inhibition by coenzyme analogues, thermal stability and by excess pyruvate (Koen and Goodman, 1969).
Figure 2. LDH polypeptides and composition of LDH isozymes
Additionally to the five tetrameric LDH isozymes, LDH also has a homotetrameric form - LDH-C4 - encoded by a third gene (LDHC) which is only found in mature testes and sperm (Markert et al., 1975).
Programmed LDH expression occurs during development, at the germ cell differentiation stage (Thomas et al., 1990).
Studies have concluded that evolutionary changes are related to gene regulation of LDH isozymes expression (Markert et al., 1975). LDHA gene from mouse, rat and human were compared phylogenetically, and mammalian LDHA is thought to be highly conserved in evolution (Fukasawa et al., 1986). H H H H H H H M H H M M H M M M M M M M LDH isozyme tetramers H M Polypeptides
29
Due to redox imbalance in low oxygen tension or hypoxia glucose metabolism is reduced. LDH-M has an essential role in sustaining glycolysis in these cases through reduction of pyruvate into lactate, accompanied by conversion of NADH into NAD+.
Knockdown of LDHA with short hairpin RNAs diminished hypoxia-related proliferation and tumorigenicity of LDHA-deficient cells (Fantin et al., 2006).
LDHA converts pyruvate to lactate which can lead to the accumulation of lactate in malignant cells resultant of aerobic glycolysis. In a hypoxic environment it may be important for cell growth as well, allowing enhanced anaerobic glycolysis (Holbrook et al., 1975; Shim et al, 1997).
LDHA and LDHB promoters have several conserved cis-regulatory elements which regulate the expression level profiles of these genes. CpG methylation is among the expression regulatory mechanisms known for these genes. Namely, LDHB transcription is inhibited by promoter hypermethylation (Maekawa et al., 2003; Leiblich et al., 2006).
HIF-1α and 2α have been shown to directly control the transcription of genes involved in glycolysis such as LDHA (Semenza, 2002). HIF-1α interacts with the conserved E-box sequence present in LDHA promoter (Jungmann et al., 1998).
A study of LDHA and LDHB in rats living in high altitude (chronic hypoxia) has shown that LDHA is not always upregulated in tissues and LDHB gene transcription or mRNA stability in the soleus and extensor digitorium longus muscles of these subjects is restricted (Rossignol et al., 2003).
c-Myc has been shown to regulate transcriptional levels of LDHA (Shim et al., 1997).
LDH was found to have a molecular heterogeneity due to its substrate. LDHA is predominantly expressed in tumours as a result of its superior ability to convert pyruvate into lactate in pyruvate-rich cells allowing the maintenance of glycolytic activity while LDHB can be found in cardiac muscle (Goldman et al., 1964; Dawson et al., 1964; Syner and Goodman, 1966). The human brain primarily expresses LDHB (Lowenthal et al., 1961).
1.4 Bone Marrow
The bone marrow together with the thymus is a primary lymphoid organ, where maturation of immature lymphocytes generated in haematopoiesis takes place. Secondary lymphatic organs include the lymph nodes, lymph follicles of the mucous membranes and the white pulp of the spleen
30
(Goldsby et al., 2002). B-cells are originated and develop in the bone marrow in humans and mice. It is also where these lymphocytes become committed to a certain antigenic specificity, therefore being able to develop an immune response – immunocompetency. Bone marrow can be found within the proximal regions of the long bones, vertebrae, ribs, ileum, sternum and calvarium (Goldsby et al., 2002).
The human blood is composed of many different cell types, all necessary for the proper function of the human body. It is from the haematopoietic stem cells (HSCs), present in niches in the bone marrow that all blood cell types are derived from.
The microenvironment in bone marrow niches includes the surrounding supporting cells which provide HSCs with the necessary cytokines for differentiation capacity and self-renewal, but also physical support (Yin and Li, 2006). Progenitor cells derive from HSCs and they have a predetermined fate: they either produce common myeloid (CMP) or common lymphoid (CLP) progenitors which will eventually differentiate into all the different subtypes. Myeloid lineage produces neutrophils, eosinophils, basophils, erythrocytes and platelets while the lymphoid cell line produces T cells, B cells and Natural Killer cells (NK) (Reya et al., 2001)
Problems in the haematopoiesis of HSCs may cause leukaemia, due to a disrupted form of haematopoiesis, which may be due to mutations in HSCs (Marley and Gordon, 2005; Michor et al., 2006) (Figure 3).
31
1.5 Acute Myeloid Leukaemia
Leukaemias are blood or bone marrow cancers and are classified according to their lineage in haematopoiesis, deriving from one of the two major blood cell lines: myeloid and lymphoid. Acute Myeloid Leukaemia (AML), also known as Acute Myelogenous Leukaemia, Acute Myeloblastic Leukaemia or Acute Nonlymphocytic Leukaemia, is a clonal malignant neoplasm of hematopoietic bone marrow progenitor cells in which these blasts lose the ability to differentiate normally and to respond to normal regulators of proliferation (Passegué et al., 2003). In AML the abnormal blood cells overpopulate the bone marrow replacing normal blood cells and preventing normal haematopoiesis (Goldsby et al., 2002). Described for the first time in the 1800’s, it is the most common malignant myeloid disorder in adults with a prevalence of 3.6 cases per 100 000 persons per year with 53,6% of cases diagnosed in persons over 75 years old, in the United States between 2005-2009 (seer.cancer.gov) In the absence of treatment in the space of one year it can lead to fatal infection, bleeding or organ infiltration (Lowenberg et al., 1999; Shipley and Butera, 2009)
Primary leukaemia refers to de novo leukaemia. Secondary leukaemias refer to the development of leukaemia following a previous related disease (myelodysplastic syndrome or a chronic myeloproliferative disorder) but also irradiation, exposure to chemicals (such as benzene) and it can also be a negative result of chemotherapeutic agents (especially alkylating agents and topoisomerase II inhibitors) (Infante and White, 1983; Estey and Dohner, 2006). The prognosis for those with secondary leukaemia is worse compared to those diagnosed with primary leukaemia. (Larson, 2007).
Gene expression profiling permits an accurate prediction, either positive or negative, of AML subtypes characterized by expression of chimeric transcription factors (AML with t(8;21), t(15;17) or inv(16)) which are the favourable cytogenetic AML subtypes, however structural mutations affecting signalling molecules or aneuploidies (such as in NPM1 and CEBPA, FLT3, RAS, abnormalities involving 11q23, -5/5q-, -7/7q-, abnormalities involving 3q (abn3q) and t(9;22)) can either have a lower degree of prediction or could not be used as predictors of subtypes, requiring alternative molecular methods (Verhaak et al., 2009).
Cytogenetic alterations and patient age are two major prognostic factors when diagnosing AML, certain translocations such as t(8;21), inv(16) or t(15;17) are more associated with a favourable prognosis and are more common in younger patients whereas monosomy 5 or 7 and a more
32
complex karyotype are seen more frequently in older adults and are linked with a poor prognosis (Bloomfield et al. 1998).
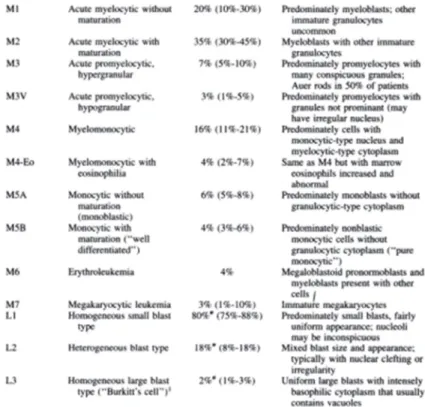
The French-American-British classification organizes acute leukaemias according to several criteria (morphology, cytochemical and immunophenotype) thus defining 8 major AML subgroups based on lineage commitment and degree of blast cell differentiation (Figure 4). This standardization of the classification of leukaemias has improved the reproducibility of AML diagnosis (Head et al., 1985).
Figure 4. FAB classification of various AML subtypes
Many factors are associated with AML disease pathogenesis. The most common are related to a blockade in differentiation: chromosomal translocations which result in the loss of function of transcription factors (TFs) essential for differential and hematopoietic development, such as core binding factor (CFB) and members of Homeodomain (Hox) TFs family (Kelly and Gilliland, 2002; Tenen, 2003).
Activated unfolded protein response, a feature of cancer stem cells triggered by the accumulation of misfolded proteins in the endoplasmic reticulum leading to its stress, is reported as happening in a considerable subset of AML patients associated with specific clinical characteristics, which present a more favourable course of the disease (Schardt et al., 2009).
33
Signalling molecules have an essential role in proliferation and as such their alteration may cause inappropriate proliferation (Weinberg, 2006). Expression of FLT3 tyrosine kinase in almost all AML patients has led to clinical trials of FLT3 inhibitors. Other tyrosine kinases involved include c-KIT, which is predictive of an overall shorter complete response duration and overall survival (Renneville et al., 2008). JAK2 V617F mutations are common in AML patients with a previous myeloproliferative disease but a few patients with no previous hematologic disease have been found to have the mutation (Frohling et al., 2006; Lee et al., 2006). The RAS family of small G-proteins is also implicated through mutation of NRAS and though it has been linked to a poor prognosis in literature, in others is has been described as unrelated to the disease outcome (De Melo et al., 1997; Kiyoi et al., 1999; Shih et al., 2004). The clinical outcome of patients with AML may also be related to altered levels of pro-apoptotic and pro-survival molecules (p53, RUNX1-MTG8 fusion protein, nucleophosmin protein) (Licht and Sternberg, 2005).
1.6 Lactic acidosis and malignancies
Elevated lactate levels (lactic acidosis) are generally related to exercise or low oxygen intake and it can be due to either the high levels of lactate generated or the decreased ability of cells to metabolize it (Robergs et al., 2004).
Lactic acidosis was first described in leukaemia, in 1858 by Folwarczny (Kompanje et al., 2007). Haematological malignancies such as leukaemia and lymphomas, have been consistently reported as being associated with lactic acidosis as presented in a literature review by Friedenberg et al. (2007). But other types of cancer have been shown to have a link with lactic acidosis, from breast cancer, to carcinoma and melanoma (Varanasi et al., 1980; Cheng et al., 2004; Colombo et al., 2006). Lactic acidosis in tumour cells derives from the elevated levels of lactate produced due to glycolysis that rapidly increases intracellular lactate concentration and is then exported into the bloodstream. Analysis of serum lactate levels in patients suspected of having an infection revealed increased mortality likelihood related to high lactate levels (>4mmol/L) (Shapiro et al., 2005). Lactic acidosis in haematological malignancies has been repeatedly associated with an extremely poor prognosis (Sillos et al., 2001). A case of fulminant death due to lactic acidosis in acute lymphoblastic leukaemia has been reported (Terpe et al., 2012).
34
It is thereby important to determine the role of monocarboxylate transporters (MCTs) and lactate dehydrogenases (LDHs) in lactic acidosis as main intervenients in transport into and from cells and in NaLac metabolism, conversion from and to pyruvate, respectively.
1.7 Autocrine loop in AML
VEGF is a growth factor that has long been known for its role in angiogenesis and recently as having a role in tumour cell function (proliferation, survival, migration and invasion) and in BM-progenitors’ homing but its ability to signal via its receptors has been increasing awareness to its other possible roles (Ellis and Hicklin, 2008).
Santos et al. (2004) described an internal and external autocrine loop between VEGF and its receptor VEGFR2 that is thought to be related to leukemia survival regulation, whereby VEGF is required to be exported and to interact with one of its receptors (VEGFR2) which leads to accumulation of VEGFR2 in the nucleus, where it is constitutively phosphorylated. A possible autocrine loop has also been described in thyroid cancers of follicular origin and pancreatic carcinoma (von Marschall et al., 2000; Vieira et al., 2005). In leukemia it has also been suggested that an angiogenic paracrine loop between VEGF-C and FLT-4 may be related to the increased survival of some leukemias subsets and a protectant role from apoptosis induced by chemotherapy (Dias et al., 2002). In AML specifically, overexpression of VEGF/VEGFR2 in leukemic blasts relates to angiogenesis originated in the bone marrow of patients (Padró et al., 2002).
For that purpose, we proposed to study in an in vitro model, using an AML cell line (HL60), how NaLac regulates the expression of MCT1, MCT4, LDHA and LDHB, from protein profile to gene transcription, addressing their promoters activity and methylation profiles. The effect of NaLac was assessed by exposing HL60 cell to NaLac in an acute and chronic way. Since, VEGF is described as being an important growth factor in HL60 survival we will also verify if VEGF signalling pathway can be involved in MCTs and LDHs modulation. The final goal of this study is to get some insights in order to know if MCTs and/or LDHs are suitable therapeutic targets for AML treatment.
35
2. Aims
The general aim of this work is to determine the role of lactate (NaLac) metabolism in Acute Myeloid Leukaemia (AML).
As specific aims we defined:
- To evaluate the modulation of MCT1, LDHA and LDHB expression by NaLac; - To evaluate the incorporation of carbons from lactate in other compounds; - To evaluate the role of VEGF in MCT1, LDHA and LDHB expression.
37
3. Material and methods
3.1 Biological material
RNA from bone marrow samples of AML patients from the Portuguese institute of Oncology, Lisbon were used under consent.
MCT1, LDHA and LDHB genes promoter sequences were amplified from genomic DNA of a colon carcinoma cell line (HCT15) (ATCC, CCL-225™).
Amplification of plasmids was done in One-Shot TOP 10 Chemically Competent Escherichia Coli (C4040-10, Invitrogen).
Assays were performed in a human acute myeloid leukemia cell line: HL60, an acute promyelocytic leukemia cell line (ATCC, CCL-240™).
3.2 Sample processing
3.2.1 Cell culture
HL60 cell line was maintained in culture with RPMI 1640 medium 1X (31870 containing 10% Fetal Bovine Serum (FBS) (16000-044, Invitrogen), 1% Antibiotic-Antimycotic (15240062, Invitrogen) and 1% L-Glutamine (25030-081, Invitrogen) and maintained at 37⁰C in a humidified 5% CO2 environment.
Lactate (NaLac) (1065222500, Merck) was used at a concentration of 10mM with overnight incubation.
Vascular endothelial growth factor (VEGF) (V7259, Sigma) was used at a concentration of 25ng/mL and incubated overnight. Whenever VEGF was used heparin (H3149, Sigma) was added as well at 5U/mL.
HL60 long-term NaLac cells were added NaLac at a concentration of 10mM every time the cells were split.
38
For metabolic assays monitored by NMR, cells grew in RPMI 10%FBS with 10mM [U-13 C]-lactate sodium salt (CX1585V, Sigma).
When needed cell number was determined using a Bürker counting chamber (haemocytometer).
3.3 Relative quantifying PCR for MCT1, MCT4, LDHA, LDHB, PEPCK, G6PD
RNA was extracted from each cell line using an RNeasy Mini kit (74106, Qiagen), according to the manufacturer’s protocol. Samples were stored at -80⁰C. RNA was quantified through spectrophotometry by measuring absorbance at 260 nm in a Nanodrop 2000 (Thermo Scientific).
Synthesis of complementary DNA (cDNA) was done through reverse transcription polymerase chain reaction (RT-PCR) in a T3000 thermocycler (Biometra), according to the following conditions:
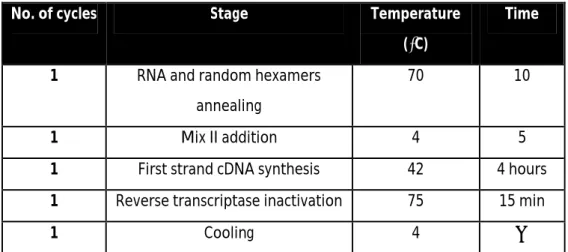
Table 1 – Conditions for cDNA synthesis.
No. of cycles Stage Temperature
(⁰C)
Time
1 RNA and random hexamers annealing
70 10
1 Mix II addition 4 5
1 First strand cDNA synthesis 42 4 hours
1 Reverse transcriptase inactivation 75 15 min
1 Cooling 4 ∞
For each synthesis reaction a Mix I containing 1µg RNA in RNase free water up to 7µL plus 0,5µL random hexamers (11043922, Invitrogen) was prepared, with a final volume of 7,5µL. Following incubation at 70⁰C for 10 minutes, the temperature was decreased to 4⁰C to enable addition of Mix II, which consisted of: 4µL of First Strand Buffer 5X (Y00146, Invitrogen), 3µL of 10mM dNTPs (deoxynucleotides), 2,5µL sterile water, 2µL of 0,1M DTT (dithiotheitol) (Y00147,
Invitrogen), 0,5 µL of 40U/µL RNase Out (10777-019, Invitrogen) and 0,5µL of 200 U/µL Superscript©
II (18064-022, Invitrogen) for a final volume of 12,5µL. For 384-well plates, each sample reaction consisted of a mixture of 1µL cDNA, 0,5µL of 5mM primers (Reverse + Forward) with 2uL of water
39
and 3,5µL of Master Mix supplied by the LightCycler© 480 SYBR Green PCR Master Mix kit (430915, AB), for a final volume of 7µL per well. Samples were evaluated in triplicate. Hypoxanthine-guanine phosphoribosyltransferase (HPRT) or rRNA 18S were used as endogenous control. RQ-PCR was carried out for 45 cycles, with an annealing temperature of 60⁰C, in a LightCycler© 480 Real Time PCR System (Roche). Primers used are presented in Table 5.
3.4 Western Blot
Cells were centrifuged, washed with Phosphate Buffered Saline (PBS). Pellets were resuspended in RadioImmuno Precipitation Assay (RIPA) buffer with added orthovanadate (S6508, Sigma-Aldrich) 1mM and protease inhibitors (cOmplete Mini EDTA-free Protease Inhibitor Cocktail Tablets, 04693159001, Roche). RIPA buffer was added to each dry pellet and cell lysis occurred at -20⁰C.
The Bradford method was chosen for protein quantification. Using Protein Assay reagent (161-0156, BioRad), serial dilutions of Bovine Serum Albumin (BSA) were used as standard to set a calibration curve from 3µg/mL to 1,785µg/mL. Following addition of Protein Loading Buffer (Annex I) to the cell extracts, these were denatured at 95-100⁰ for 10 minutes. For each well 100µg of protein sample were applied. Samples were separated in a 15% polyacrylamide gel. Electrophoresis was carried out at 200 volts on a Tris-Glycine SDS (TGS) buffer 1x (TGS buffer 10X, 161-0772, BioRad). Proteins were then transferred to a nitrocellulose membrane (162-0112, Bio-Rad) in a Mini Trans-Blot Electrophoretic Transfer Cell (Bio-Rad) with transfer buffer (Annex I) overnight at 4⁰C and 100 volts. The membrane blocking of non-specific binding was done by incubation in a 5% (w/v) solution of non-fat milk in PBS 0,1% Tween 20 (Annex I) for 1 hour at room temperature, under shaking.
Protein detection was achieved by incubating with the primary antibody specific to each protein, diluted 1:1000 in non-fat milk in PBS 0,1% Tween 20 overnight at 4⁰C under shaking. The primary antibodies used were the following: monoclonal anti-rabbit MCT1 (AB35388), monoclonal rabbit MCT4 (AB33168), monoclonal rabbit LDHA (SAB11000500), and monoclonal anti-mouse LDHB (WH0003945). The membrane was then rinsed three times with PBS 0,1% Tween 20 and incubated with the secondary antibody (anti-rabbit (31460, Thermo Scientific) or anti-mouse (31430, Thermo Scientific)) conjugated with horseradish peroxidase (HRP) and diluted 1:5000 in non-fat milk in PBS 0,1% Tween 20 for two hours, shaking at room temperature and rinsed three times with PBS 0,1% Tween 20. HRP reactivity was developed using SuperSignal© West Pico
40
Chemiluminescent Substrate (34080, Thermo Scientific). Images were digitally obtained through a ChemiDoc XRD System with Image Lab software. Bands were quantified using Image J software (rsb.info.nih.gov/ij/).
3.5 Immunofluorescence
Cells were grown in 5mL of medium, with overnight incubation with VEGF (25ng/ml) or NaLac (10mM). Cells were centrifuged at 1200 rpm for 2-3 minutes and resuspended in 1,5mL PBS-BSA 0,1%. Cells were transferred onto slides using a Cytospin 2 (Shandon) at 1200rpm for 5 minutes.
Cells were then fixed using methanol. Cell circles on slides were delimitated using a hydrophobic pen (S2002, Dako). For each circle 30µL of primary antibody were used and incubated overnight at 4ºC, protected from light. Primary antibodies were diluted 1:100 in PBS-BSA 0,1% for MCT1 and MCT4 antibodies (monoclonal anti-rabbit, AB35388 and AB33168, respectively), and in PBS-BSA 0,1% Triton X100 for LDHA (monoclonal anti-rabbit, SAB11000500) and LDHB antibodies (monoclonal anti-mouse, WH0003945) . After rinsing three times, 5 minutes each, with PBS 1X, cells were incubated with secondary antibodies for 2 hours at room temperature, protected from light. Secondary antibodies were diluted 1:500 in PBS-BSA 0,1% and the antibodies used were: Alexa Fluor© 488 anti-rabbit (A-11034, Invitrogen) and Alexa Fluor© 488 anti-mouse mouse (A-11001, Invitrogen). Following incubation, slides were again rinsed three times in PBS 1X and then 5µL VECTASHIELD mounting medium with DAPI (4’-6-diamidino-2-phenylindole) (H-1200, Vector Labs) was added to each delimited circle. Negative controls followed all these procedures except incubation with primary antibody. Cells were observed under an Axio Imager.Z1 microscope (Zeiss) fluorescence microscope. Images were acquired at x200 and x400 magnification with AxioVision software and processed with Image J software.
3.6 Construction of promoter deletion constructs
3.6.1 Acquisition of insert coding sequence 3.6.1.1 PCR reaction
Amplification of the promoter sequence was done through Polymerase Chain Reaction (PCR) (primers used are presented in Table 5). Genomic DNA from HCT15 cell line was used.
41
For each reaction a mixture was made, consisting of: 2,5µL of PCR Rxn Buffer 10X (Y02028,
Invitrogen), 2µL of 200mM dNTPs, 1,5µL of 50mM MgCl2 (Y02018, Invitrogen), 1µL of each primer,
100ng of template DNA, 0,5µL of 5U/µL Taq DNA polymerase (18038-026, Invitrogen) and sterile bidestilled water up to 25µL.
PCR reaction was carried out in a T3000 thermocycler (Biometra) according to the following program:
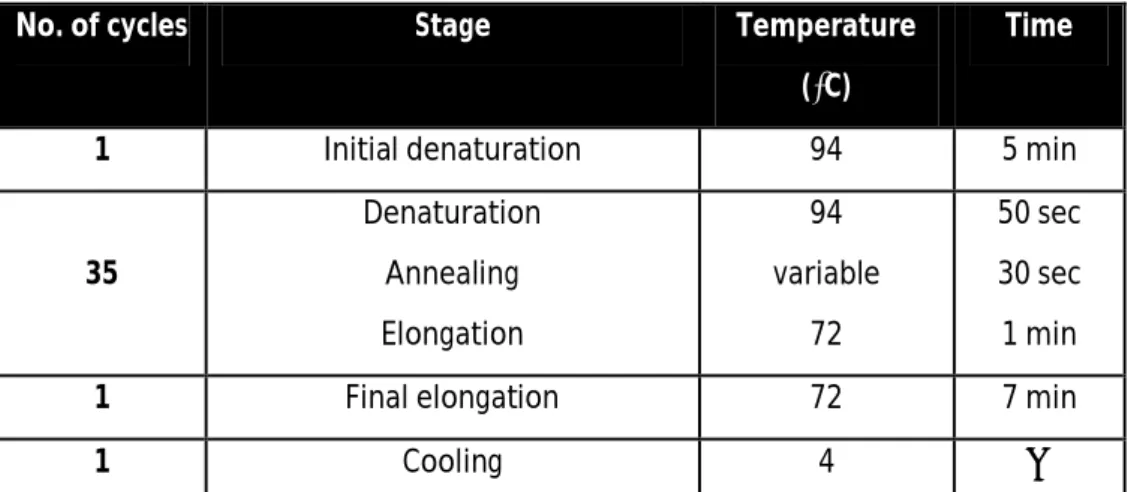
Table 2. Program used for PCR.
No. of cycles Stage Temperature
(⁰C)
Time
1 Initial denaturation 94 5 min
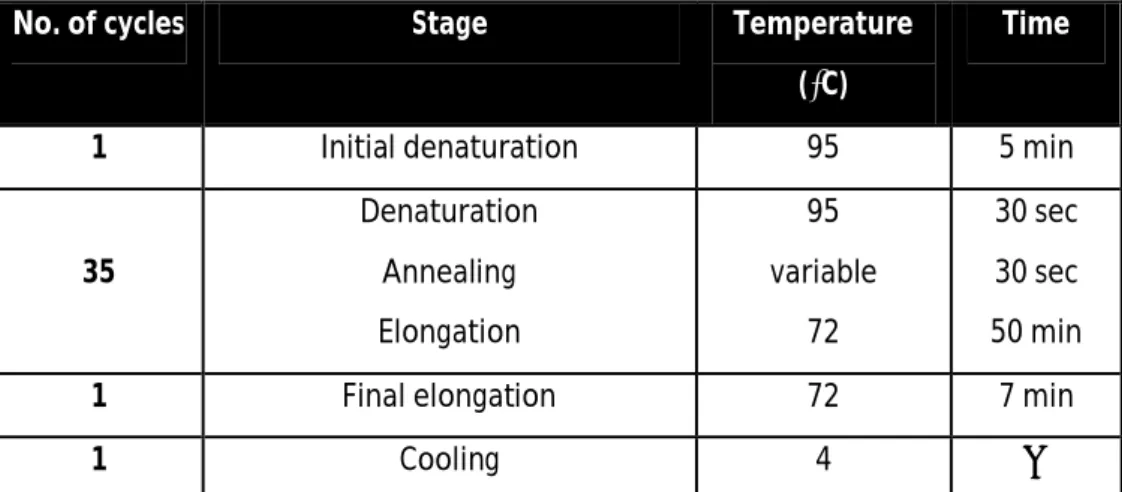
35 Denaturation Annealing Elongation 94 variable 72 50 sec 30 sec 1 min
1 Final elongation 72 7 min
1 Cooling 4 ∞
Amplified products were then visualised by electrophoresis to confirm size, in a 2% (w/v) agarose (in TBE buffer 1X (EC-860, National diagnostics)) gel, stained with 0,05% (v/v) ethidium bromide and under UV (BioDocAnalyse Transilluminator, Biometra).
Bands of interest were extracted from the gel and purified using Illustra GFX PCR DNA and Gel Band Purification Kit (28-9034-70, GE Healthcare Life Sciences), following the manufacturer’s instructions.
3.6.1.2 Sequencing reaction
The sequence from the PCR fragments was confirmed through DNA sequencing. Two separate reactions, one containing the forward primer and one containing the reverse primer, were made for each sample. Each mixture consisted of: 3µL of Big dye Terminator v1.1 and 2µL of Big dye sequencing buffer 5X (BigBye Terminator v3.1 Cycle Sequencing kit ,4337456, Applied Biosystems), 1µL of forward or reverse primer, 3µL of DNA template, and sterile bidestilled water up to 20µL. The reaction was carried out in a T3000 thermocycler (Biometra). Primers used are presented in table 5.
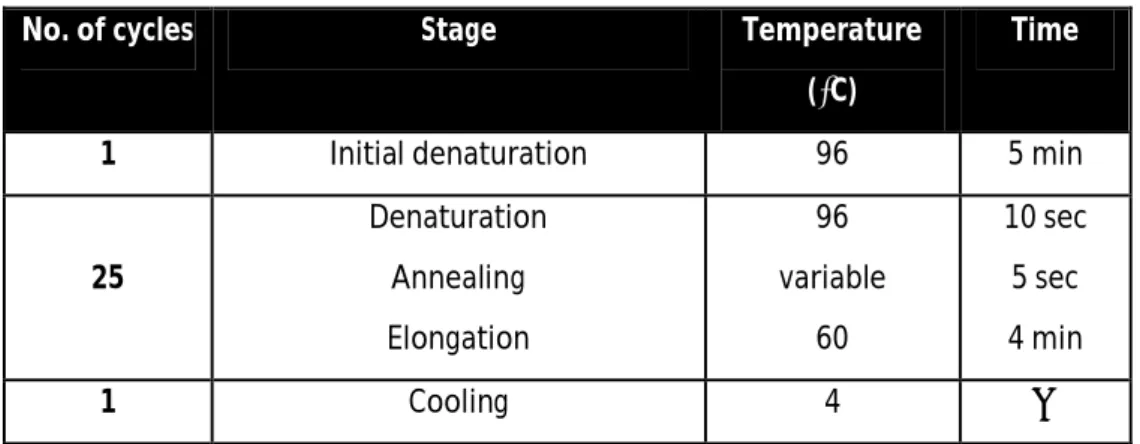
42 Table 3. Program used for sequencing reaction.
No. of cycles Stage Temperature
(⁰C)
Time
1 Initial denaturation 96 5 min
25 Denaturation Annealing Elongation 96 variable 60 10 sec 5 sec 4 min 1 Cooling 4 ∞
Amplified samples were then purified using AutoSeq G-50 dye terminator removal kit (27-5340-02, GE Healthcare Life Sciences), following the manufacturer’s instructions.
Capillary electrophoresis was done in an ABI Prism™ 310 Genetic Analyzer (Applied Biosystems).
Sequences were analysed with Sequencing analysis 3.4.1 software.
3.6.2 Plasmid construction and cloning
Following sequencing, restriction sequences were added to promoters fragments by amplifying fragments using primers with restriction sequences by PCR as described in section 3.6.1.2 (primers used are presented in table 5).
Digestion of pGL3basic vector and of the promoter sequence with restriction ends was the next step. Each digestive reaction was composed of: 2,5µL Buffer R (BR5, Fermentas) , 1µL HindIII, 1µL MluI, up to 20 µL of purified DNA or 1µg of pGL3basic, and sterile bidestilled water to total 25 µL. Digestion occurred overnight at 37⁰C in a T3000 thermocycler (Biometra).
Ligation of the pGL3basic vector and the inserts (promoter fragments) consisted of: 1 µL digested pGL3basic, 1 µL T4 ligase (15224-041, Invitrogen), 1µL T4 ligase buffer (EL 0014, Fermentas), up to 10µL digested promoter fragments and sterile bidestilled in a total volume of 10 µL. Ligation was carried out overnight at 16⁰C in a T3000 thermocycler (Biometra).
43
Plasmid cloning was carried out by transforming One-shot TOP 10 Chemically Competent Escherichia coli (C4040-10, Invitrogen), according to the manufacturer’s protocol, and plated in Petri dishes with Larry Broth (LB) (Annex I) medium with 100µg/mL ampicillin.
3.6.3 Plasmid isolation
From each plate, 10 independent colonies were picked and cultured in 5mL LB medium (Annex I) with 100µg/mL ampicilin, at 37⁰C with shaking, overnight.
Plasmid extraction was performed using Plasmid DNA MiniPreps kit (SP-PMN-100, EasySpin), following the manufacturer’s protocol and the DNA obtained was quantified through at 260nm in a Nanodrop 2000 (Thermo Scientific).
The plasmids were confirmed to be the right constructs through PCR, using primers complementary to specific sequences in the pGL3basic. Amplified products were visualised by electrophoresis to confirm size, in a 2% (w/v) agarose (in TBE buffer 1X (diluted from TBE buffer 10X, National diagnostics)) gel, stained with 0,05% (v/v) ethidium bromide and under UV (BioDocAnalyse Transilluminator, Biometra). DNA sequencing was used as in section 3.6.1.2 to confirm sequences.
3.7 Transfection of HL60 and HL60 long-term NaLac cell lines
3.7.1 Transfection
HL60 and HL60 long-term NaLac were transfected with pGL3-LDHAF1, LDHAF2, LDHAF3, LDHBF1, LDHBF2, MCT1F1, MCT1F2 using Lipofectamine™ 2000 (11668019, Invitrogen).
Prior to preparing complexes 1x10⁶ cells of each cell line were diluted in 500µL of serum and antibiotic free RPMI 1640 medium and plated.
For each triplicate set 1,5µg of pGL3 variant and 0,3 µg of pCMV-Renilla were diluted into 150µL of serum free RPMI 1640 medium and gently mixed. Lipofectamine™ 2000 (11668019, Invitrogen) was gently mixed before using and 6µL were diluted in 150µL of serum and antibiotic free RPMI 1640.
44
After 5 minutes, diluted pDNA and diluted Lipofectamine™ 2000 (11668019, Invitrogen) were combined, mixed, and allowed to form complexes for 20 minutes at room temperature.
To each well, which contained the 1x10⁶ cells in 500µL of serum and antibiotic free RPMI 1640 medium was added 100 µL of complexes, and the plate was gently mixed.
Incubation was done for 4-6 hours, at 37⁰C in a humidified 5% CO2 environment after which, 500µL per well of complete RPMI 1640 medium was added.
For cells subjected to VEGF (25ng/mL) or NaLac (10mM), 24 hours after transfection these compounds were added.
Cell lysis was done 48 after transfection. Cells were transferred from the plate to microtubes and centrifuged at 1200rpm for 2 minutes followed by disposal of the supernatant. They were then resuspended in 1,5mL PBS 1X and centrifuged a second time. Supernatant was disposed and cells were lysed using 100µL of Lysis Buffer provided in Dual Luciferase® Reporter Assay kit (E1910, Promega) diluted 1X in sterile water and allowed to stand for 15 minutes at room temperature. Storage was done at -80⁰C with a minimum of an overnight before testing luciferase activity.
Cell extracts were moved to an opaque 96 well plate to analyse firefly and Renilla luminescence activity. Dual Luciferase® Reporter Assay kit (E1910, Promega) was used according to the manufacturer’s instructions. Firefly was normalized with Renilla activity in order to consider the transfection efficiency. Results are expressed in fold of negative control, empty pGL3basic vector.
3.8 Bisulfite treatment
3.8.1 Bisulfite reaction and DNA conversion
DNA was extracted from cells using the DNA purification protocol (Citogene) and bisulfite treatment was carried out to evaluate methylation patterns of MCT1 and LDHA promoters.
Each bisulfite reaction contained: 2µg DNA solution up to a maximum of 19µL diluted in up to 19uL RNase-free H2O, 1µL RNase Out (10777-019, Invitrogen), and 85µL dissolved bisulfite mix and 35µL DNA protect buffer (EpiTect Bisulfite kit, 59104, Qiagen). Protocol was followed according to manufacturer’s instructions, with the exception of Bisulfite reaction components; carrier RNA supplied in the kit was always added to Buffer BL and following the final step in protocol, 1µL RNase Out (10777-019, Invitrogen) was added to every tube prior to storage at -20⁰C.
45
3.8.2 PCR and sequencing
To amplify promoters fragments from bisulfite converted DNA were used primers considering the converted sequence and which annealing in sequences without CpG occur.For each reaction a mixture was made, consisting of: 5µL of PCR Rxn Buffer 10X (Y02028, Invitrogen), 4µL of 200mM dNTPs, 3µL of 50mM MgCl2 (Y02018, Invitrogen), 3µL of each primer, 4µL of template DNA, 0,5µL of 5U/µL TaqGold DNA polymerase (N88080246, Invitrogen) and sterile bidestilled water up to 50µL.PCR reaction was carried out in a T3000 thermocycler (Biometra) according to the following program:
Table 4. Program used for PCR.
No. of cycles Stage Temperature
(⁰C)
Time
1 Initial denaturation 95 5 min
35 Denaturation Annealing Elongation 95 variable 72 30 sec 30 sec 50 min
1 Final elongation 72 7 min
1 Cooling 4 ∞
Amplified products were then visualised by electrophoresis to confirm size, in a 2% (w/v) agarose (in TBE buffer 1X (diluted from TBE buffer 10X, EC-860, National diagnostics)) gel, stained with 0,05% (v/v) ethidium bromide and under UV (BioDocAnalyse Transilluminator, Biometra). Bands of interest were cut from the gel and purified using Illustra GFX PCR DNA and Gel Band Purification Kit (28-9034-70, GE Healthcare Life Sciences), following the manufacturer’s instructions. A small volume of purified DNA (1µL) was run in an electrophoresis to control purification efficiency.
Methylation of CpG from promoter sequences were evaluated by sequencing as described in section 3.6.12.
3.9 Cell extracts and NMR spectroscopy
HL60 control cells and cells exposed to [U-13C] -lactate sodium salt (CX1585V,Aldrich), were collected and the lipidic fraction was extracted with 15 ml chloroform/methanol/HCl 12 M (2:1:0.01,
46
v/v/v) and 3.8 ml KCl 66 mm. After centrifugation, the organic phase was evaporated under nitrogen, and lipids were suspended in chloroform-d for NMR analysis.
For analysis of the intracellular content, the cells were extracted with ice-cold ethanol (80%) and the supernatants were freeze-dried and suspended in D2O for NMR analysis.
Proton decoupled 13C-NMR spectra of cellular extracts were acquired in a Bruker AVANCE III 500 (Bruker, Rheinstetten, Germany) at 125.77 MHz, using a 5 mm 13C selective probe head. The chemical shifts in aqueous sample were referred to (trimethylsilyl) propanesulfonic acid, while the samples in chloroform-d were referred to the solvent signal designated at 77.0 ppm. Assignments were made by comparison with chemical shifts found in the literature for metabolic intermediates.
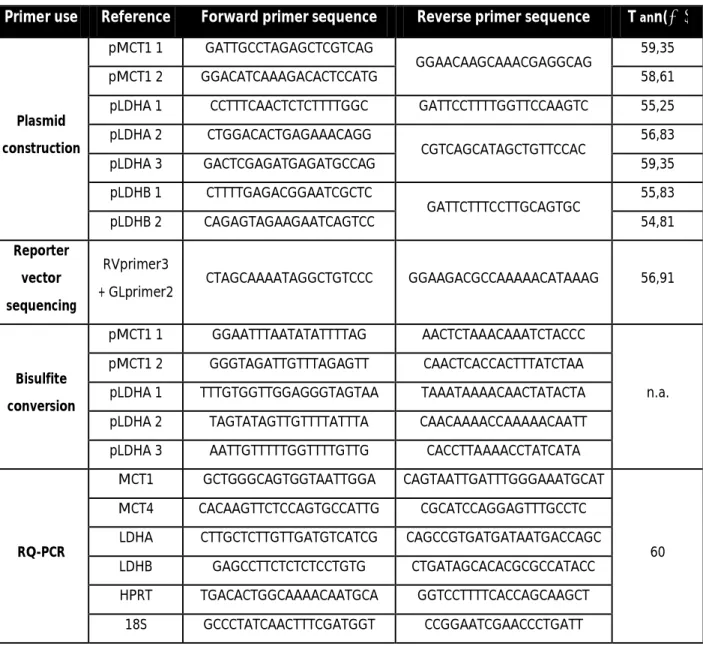
Table 5. Primers used during the experimental work
Primer use Reference Forward primer sequence Reverse primer sequence T ann(⁰C)
Plasmid construction
pMCT1 1 GATTGCCTAGAGCTCGTCAG
GGAACAAGCAAACGAGGCAG 59,35
pMCT1 2 GGACATCAAAGACACTCCATG 58,61
pLDHA 1 CCTTTCAACTCTCTTTTGGC GATTCCTTTTGGTTCCAAGTC 55,25 pLDHA 2 CTGGACACTGAGAAACAGG CGTCAGCATAGCTGTTCCAC 56,83 pLDHA 3 GACTCGAGATGAGATGCCAG 59,35 pLDHB 1 CTTTTGAGACGGAATCGCTC GATTCTTTCCTTGCAGTGC 55,83 pLDHB 2 CAGAGTAGAAGAATCAGTCC 54,81 Reporter vector sequencing RVprimer3
+ GLprimer2 CTAGCAAAATAGGCTGTCCC GGAAGACGCCAAAAACATAAAG 56,91
Bisulfite conversion
pMCT1 1 GGAATTTAATATATTTTAG AACTCTAAACAAATCTACCC
n.a. pMCT1 2 GGGTAGATTGTTTAGAGTT CAACTCACCACTTTATCTAA
pLDHA 1 TTTGTGGTTGGAGGGTAGTAA TAAATAAAACAACTATACTA pLDHA 2 TAGTATAGTTGTTTTATTTA CAACAAAACCAAAAACAATT pLDHA 3 AATTGTTTTTGGTTTTGTTG CACCTTAAAACCTATCATA
RQ-PCR
MCT1 GCTGGGCAGTGGTAATTGGA CAGTAATTGATTTGGGAAATGCAT
60 MCT4 CACAAGTTCTCCAGTGCCATTG CGCATCCAGGAGTTTGCCTC
LDHA CTTGCTCTTGTTGATGTCATCG CAGCCGTGATGATAATGACCAGC LDHB GAGCCTTCTCTCTCCTGTG CTGATAGCACACGCGCCATACC HPRT TGACACTGGCAAAACAATGCA GGTCCTTTTCACCAGCAAGCT
18S GCCCTATCAACTTTCGATGGT CCGGAATCGAACCCTGATT
![Figure 1. Topology of a monocarboxylate transporter. Of note are the various hydrophilic regions – N and C-teminal residues and the large intracellular loop region between transmembrane-spanning segments 6 and 7 [from Juel and Halestrap, 1999]](https://thumb-eu.123doks.com/thumbv2/123dok_br/15488868.1040906/26.892.156.741.249.620/topology-monocarboxylate-transporter-hydrophilic-residues-intracellular-transmembrane-halestrap.webp)
![Figure 3. Normal and leukaemic bone marrow niche [from http://hematopoiesis.info]](https://thumb-eu.123doks.com/thumbv2/123dok_br/15488868.1040906/30.892.222.672.704.1013/figure-normal-leukaemic-bone-marrow-niche-http-hematopoiesis.webp)