Analysis of the physical-chemical
and sensorial properties
of Maria type cookies
Daniela Pereira1, Paula M. R. Correia1, 2, Raquel P. F. Guiné1, 2
1Departamento de Indústrias Alimentares, ESAV, Quinta da Alagoa, Estrada de Nelas, Ranhados,
3500-606 Viseu, Portugal
2CI&DETS, Instituto Politécnico de Viseu, Av. Cor. José Maria Vale de Andrade, Campus Politécnico,
3504-510 Viseu, Portugal [email protected]
Abstract: Given the importance of the cookies of type Maria worldwide, and considering the absence of any
scientific study setting out their main features, it becomes important to identify the differentiating characteristics of several commercialized brands, in particular related to the chemical, physical and sensory characteristics. In this way, the aim of this work was to study and compare eight different brands of cookies of type Maria. The elemental chemical analysis (moisture, ash, protein, fat, fibre and carbohydrates contents), determination of physical parameters (volume, density, texture and colour) and sensory evaluation of studied cookies were performed. Multivariate statistical methods (Pearson correlation, principal component analysis and cluster analysis) were applied to estimating relationships in analysed data.
The results for the elemental analysis showed that the samples were very similar in terms of some components, like for example ashes, while quite different in terms of other components, such as moisture and fat contents. With respect to texture and colour the samples showed, in general, some important differences. In terms of sensory evaluation, the sample C was the one that in most sensory tests gathered the preference of the panellists. The cluster analysis showed that the sample A was much different from the other samples. The results of principal component analysis showed that the main component explains 32.6 % of the total variance, and is strongly related to variables associated to colour.
Keywords: Maria cookies, physical-chemical characterization, texture, colour, sensory analysis.
Introduction
The cookies are small bakery products (Manley, 1998) made from a formula rich in sugar and fat and relatively low in water (Hoseney, 1998). Manley (1998) defined cookies as products prepared with wheat flour, fat, milk powder, salt, sugar, water and some minor ingredients such as sodium bicarbo-nate, ammonium bicarbobicarbo-nate, and emulsifiers that serve to improve the colour, flavour, texture and consistency. They are characterized by having a well-developed gluten structure, but with increas-ing amounts of sugar, fat or gluten becomes more extensible and less elastic. There are many dif-ferent functional properties of importance in the preparation of bakery products. The ingredients, individually, can have more than one function to a product or group of bakery products (Cauvin and Young, 2006). The cookies and biscuits (crackers, sweet biscuits, strongly sweet, semi-sweet, wafers) are characterized by a low moisture content and high levels of fats and sugar (Cauvin and Young, 2006). Given the low moisture content associated with the thinness, biscuits are characteristically hard and crunchy, properties that are much appreciated upon eating (Cauvin and Young, 2006). The most
important phenomena during oven cooking of cookies and biscuits are the considerable loss of wa-ter and Maillard reactions occurring at the surface, causing darkening and colour changes. As Manley (1998) reported, the product becomes appealing to consumers depending on its visible appearance and qualities. Cauvin and Young (2006) found that during the cooking process when the moisture mi-grates from the wet core to the drier surface it turns the product drier, and the following expansion and contraction cause breakage originating microscopic lines of weakness, influencing its resistance.
Maria cookie is a very popular type of cookie made with wheat flour, sugar, oil and vanilla essence. It has a round shape, with the name “Maria” engraved on the surface and intricate designs on the edge. It is very popular among children, being especially consumed by infants with milk, being also fre-quently used in the preparation of sweet recipes (Pereira, 2013). In 1874, an English baker on the occasion of the marriage of Duchess Maria Alexan-drovna of Russia to the Duke of Edinburgh, created a new cookie in her honour. Because that marriage was followed with great interest everywhere, the lo-cal industrialists began to imitate the product all over the world. It is manufactured and marketed in
countries like Spain, Costa Rica, Portugal, Nether-lands, Turkey, Venezuela, China, Uruguay, Malaysia and Japan, among others (Pereira, 2013). The semi-sweet Maria cookies are produced according to a commercial formulation and baking practice, having been the basic recipe published by Pedersen, L. et al. (2004). As regards the nutritional value, Maria cookie has a high caloric value, of about 500 kcal per 100 g. It has a lower fat content as com-pared to other cookies (15—20 %), is rich in carbo-hydrates (approximately 70—75 %) but the amount of protein is low (about 6 %) (Pereira, 2013).
The texture of the foods is related to their physical properties and the result of their chemical composi-tion. Texture is considered one of the most important sensory attributes for the acceptance of cookies and biscuits, determining their quality, since it affects consumer acceptance (Gaines et al., 1992). Cookies and biscuits present a lightly compacted granular structure, where air is entrapped in a number of granules and not uniformly distributed. They are sugar rich and have a cohesive and brittle structure (Piteira, 2005). Changes in ingredients and processes cause variations in texture, the fat being one of the main ingredients causing these changes, even more than sugar or flour (Zoulias et al., 2002).
The colour comprises a complex three-dimensional information and can be represented by spectro photo-metric curves which are plots of fractions of incident light (reflected or transmitted) as a function of wave-length across the visible spectrum (Perrot et al., 1996; Saltin and Sumnu, 2006). In industrial cooking of cereal products such as cookies, the product proper-ties that influence the colour are quite numerous. According Saltin and Sumnu (2006), the colour measurement can be used as an indirect means of analysing a specific component with which a colour is associated in a food.
The main objectives of the present work were to characterize different brands of Maria type cookies sold in the Portuguese market in terms of chemical, physical and sensory properties. Furthermore, it was also intended to understand which charac-teristics correlate with each other and those who give a strong contribution for the definition of the characteristics of this product.
Materials and methods
MaterialsThe samples analysed were cookies of Maria type from eight different brands, designated as letters like this: samples A, B, C and D corresponded to brands known as white (sold with the name of certain hypermarket chains); samples G, H and I corresponded to commercial brands (trade mark); finally, sample K corresponded to a trade mark also, but foreign. Although all samples were marketed in Portugal, sample K was produced in Spain, while all others were produced in Portugal.
Chemical analyses
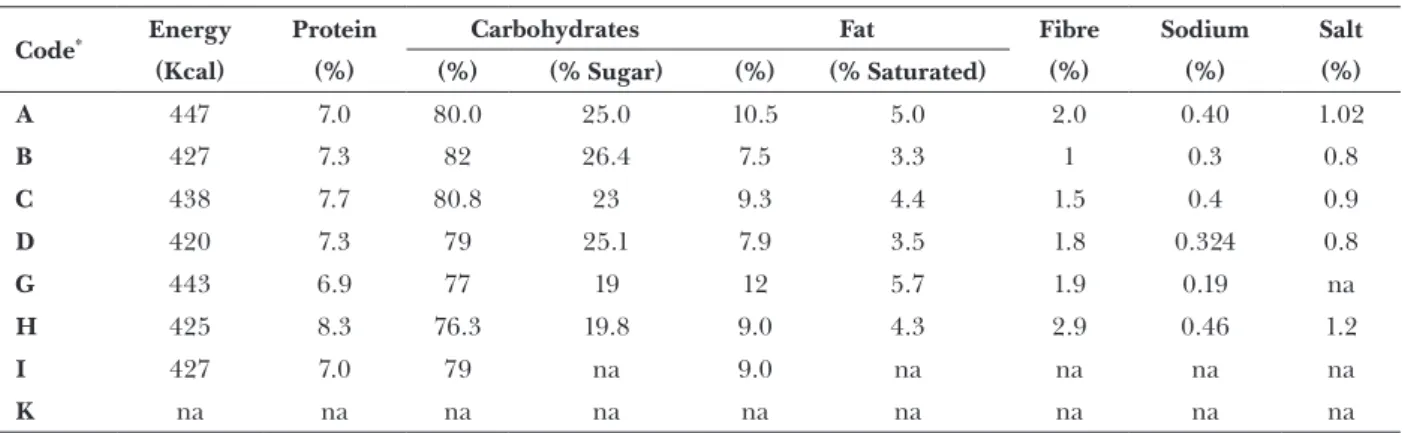
Table 1 depicts the amounts of the chemical com-ponents present in the samples analysed, as stated in the label, when available.
The Standard methodologies of the Association of Official Analytical Chemists (AOAC, 2000) were used for the determination of moisture content, ash, protein, fibre and fat. The total carbohydrates content was determined according to Rodrigues (2012). All analyses were done in triplicate.
Dimensions and density
The dimensions were measured in terms of thick-ness and diameter, measured with a capiler, thus allowing calculate radius and volume. Mass was
de-Tab. 1. Label information about the chemical composition of the Maria cookies analysed (as stated in the
package and for 100 g of product).
Code* Energy Protein Carbohydrates Fat Fibre Sodium Salt
(Kcal) (%) (%) (% Sugar) (%) (% Saturated) (%) (%) (%) A 447 7.0 80.0 25.0 10.5 5.0 2.0 0.40 1.02 B 427 7.3 82 26.4 7.5 3.3 1 0.3 0.8 C 438 7.7 80.8 23 9.3 4.4 1.5 0.4 0.9 D 420 7.3 79 25.1 7.9 3.5 1.8 0.324 0.8 G 443 6.9 77 19 12 5.7 1.9 0.19 na H 425 8.3 76.3 19.8 9.0 4.3 2.9 0.46 1.2 I 427 7.0 79 na 9.0 na na na na K na na na na na na na na na
*Samples A to D are white brands, samples G to I are commercial brands, sample K is foreign brand.
termined by weighting, and the specific weight was calculated dividing the sample mass by its volume (Matuda, 2008). For these analyses, 15 cookies of each brand were used.
Colour
A variety of systems has been developed to describe colours, among which the CIELab is commonly used in the search for food quality control. In the CIELab colour space L* is brightness and varies from black (L* = 0) to white (L* = 100) and the opposing colour parameters are a* and b*, with a* representing green if negative and red if positive (varying in the range –60 ≤ a* ≤ +60) and a* representing blue when negative and yellow when positive (also varying in the range –60 ≤ b* ≤ +60) (Lara et al., 2011; Piteira, 2005; Saltin and Sumnu, 2006).
The colour was analysed by a colorimeter CR-400 Chroma Meter (Konica-Minolta, Japan) using a D65 illuminant, and the results were expressed as coordinates of the CIE Lab system. Calibration of the apparatus was carried out before use, through a reading on a white tile pattern. Determinations were made on both surfaces of cookies (up and down sides), in a total of 30 replications per sample.
Texture
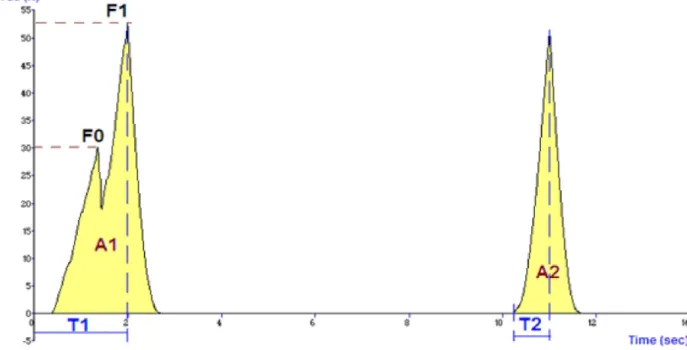
Texture was accessed by means of Texture profile analysis (TPA) measured at 20 ± 2 °C using a texturometer Texture Analyser TA.XT Plus from Stable Microsystems, UK. Calibration was carried out with the aid of a 5 kg load cell. The probe used was a P/75 aluminium, 75 mm diameter, and the test speed was 0.5 mm/s. Samples were always
placed with the top upward and fourteen replicates were carried out for each brand of wafers. Several parameters, such as fracturability (F0), hardness (F1), springiness (T2/T1 × 100 %), cohesiveness (A2/A1) and chewiness (F1 × A2/A1 × T2/T1) (see Figure 1) were calculated from the force/time curves obtained (TPAs).
Sensory analyses
The sensory evaluation method used in this work was the hedonic scale preference test. This is a test which measures the subjective consumer ac-ceptance of and preference for products. This type of test consists in giving the samples to the assessors, questioning them about their pre-ference between the different samples, according to an established scale. In hedonic scale, the asses-sor expresses its acceptance for the product, fol-lowing a previously established scale that varies gradually, based on the attributes expressing its intensity. The scale points are distinguished ver-bally, so that they can be associated with numeri-cal values allowing statistinumeri-cal analysis (Monteiro and Martins, 2003; Pereira, 2013).
The sensory panel was composed of a total of 90 par-ticipants, aged between 17 and 62 years, distributed as: 61 % were under 25 years, 19 % were between 25 and 35 years, 12 % between 36 and 45, and 8 % were over 45 years. Regarding gender, 32 % were male and 68 % were female.
The panel members carried out their evaluation by filling a questionnaire regarding the evaluating the following attributes: visual (colour intensity and homogeneity, roughness of the surface); textural
(hardness and crispness); palatable (intense of fla-vour, sweetness, butter taste, vanilla flavour); overall assessment.
The assessors expressed the intensity of each attribute using a scale where 0 denotes a minimal value and 10 maximal one.
Statistics
Data were analysed with SPSS software for Win-dows version 19.0 (IBM, New York, USA) and Sta-tistic version 6 (Statsoft, Tulsa, Oklahoma, USA). It was performed an analysis of variance one-way ANOVA; a comparison of the mean differences for all parameters by Tukey HSD test; the calcu-lation of the Pearson correcalcu-lation coefficients (r) to determine the relationships between the various properties evaluated. Finally, the results were sub-jected to a Principal Components Analysis (PCA) and Cluster Analysis (CA) in order to observe the differences and similarities of the samples ana-lysed. The significance level used for all statistical tests was 95 %.
Results and discussion
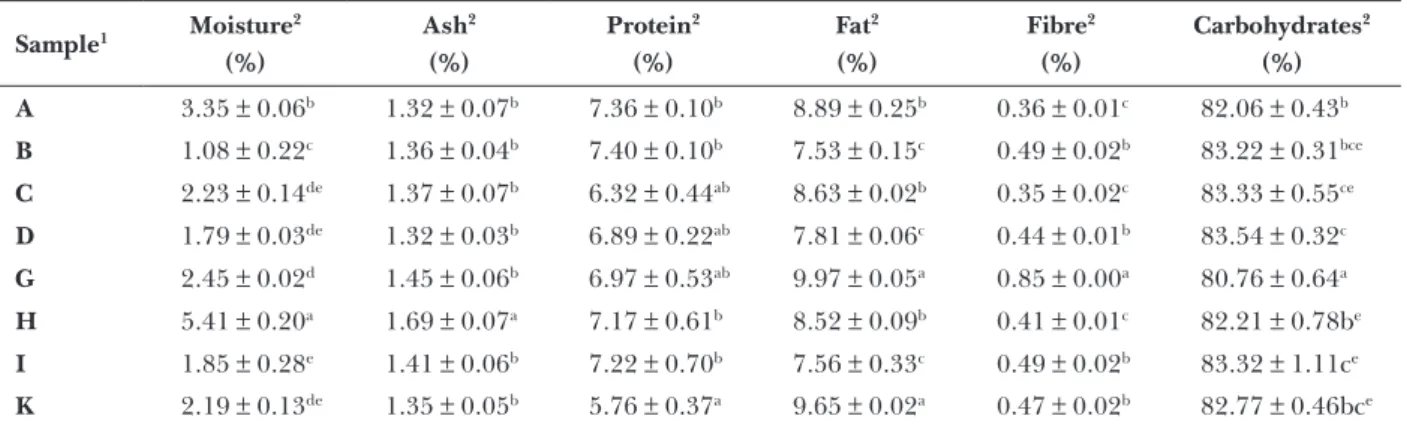
Chemical analysesThe results of chemical analyses of cookies are presented in the table 2. The moisture content of the different samples was found to vary between 1.08 % and 5.41 %, having the samples C, D and K substantially similar values. The determination of ash content reveals information relating to mine-rals. In the present study the values of ash content varied between 1.32 % and 1.69 %, but only sample H is statistically different from all others. The pro-tein content ranged between 5.76 % in Sample K and 7.40 % for sample B. However, in general, these
variations do not represent significant differences among samples, except for sample K (with the lowest value), which is statistically different from the group constituted by samples A, B, H, I. Samples C, D, and G are similar, with protein content of 6.32, 6.89 and 6.97 %, respectively. The samples fat content is significantly different, probably due to the addition of fats which varies depending on the formulations of the different brands. As to the fat content, samples G and K are those that contain more fat, 9.97 %, and 9.65 %, respectively, while samples B, D and I are less fat rich, with contents of 7.53, 7.81 and 7.56 5, respectively. The fibre content also varied between each formulation. The values reported in Table 2 show that samples A, C and H were not statistically different among themselves, and the same happens with the group of samples B, D, I and K. In general, it was observed that these types of product are low in fibre. Regarding the carbohydrates content, it was observed that the values varied from 80.8 % (sample G) and 83.54 % (sample D). It could be inferred from the results of the determination of the Pearson correlation co-efficients that there is a strong positive correlation between moisture and ash contents (r = 0.728). On the other hand, important negative correlations were encountered between carbohydrates and fat (r = –0.754) and between carbohydrates and fibre (r = –0.594), although in this last case the correla-tion was not so strong.
Dimensions and density
Table 3 presents the values of the measured mass and the calculated volume and density. Regarding the medium mass of one cookie, sample K was significantly different from the others, with a very high value of 6.66 g. In terms of volume, sample D was the smallest (17.00 cm3) while sample H was Tab. 2. Chemical properties of the different brands of Maria cookies analysed.
Sample1 Moisture2 (%) Ash2 (%) Protein2 (%) Fat2 (%) Fibre2 (%) Carbohydrates2 (%) A 3.35 ± 0.06b 1.32 ± 0.07b 7.36 ± 0.10b 8.89 ± 0.25b 0.36 ± 0.01c 82.06 ± 0.43b B 1.08 ± 0.22c 1.36 ± 0.04b 7.40 ± 0.10b 7.53 ± 0.15c 0.49 ± 0.02b 83.22 ± 0.31bce C 2.23 ± 0.14de 1.37 ± 0.07b 6.32 ± 0.44ab 8.63 ± 0.02b 0.35 ± 0.02c 83.33 ± 0.55ce D 1.79 ± 0.03de 1.32 ± 0.03b 6.89 ± 0.22ab 7.81 ± 0.06c 0.44 ± 0.01b 83.54 ± 0.32c G 2.45 ± 0.02d 1.45 ± 0.06b 6.97 ± 0.53ab 9.97 ± 0.05a 0.85 ± 0.00a 80.76 ± 0.64a H 5.41 ± 0.20a 1.69 ± 0.07a 7.17 ± 0.61b 8.52 ± 0.09b 0.41 ± 0.01c 82.21 ± 0.78be I 1.85 ± 0.28e 1.41 ± 0.06b 7.22 ± 0.70b 7.56 ± 0.33c 0.49 ± 0.02b 83.32 ± 1.11ce K 2.19 ± 0.13de 1.35 ± 0.05b 5.76 ± 0.37a 9.65 ± 0.02a 0.47 ± 0.02b 82.77 ± 0.46bce 1Samples A to D are white brands, samples G to I are commercial brands, sample k is foreign brand.
2Results are given as mean ± standard deviation. Values in the same column with the same letter are not statistically different
the biggest (30.87 cm3), (confirmed by the statisti-cal results). Regarding this physistatisti-cal property, the values were very different among the samples ana-lysed. The highest value differed from the lowest one by almost 100 %. This indicates that the size of the Maria cookies is in fact very heterogeneous. As to density, it was observed in general that the values are low, thus indicating a porous structure, characteristic from the bakery products. Despite the low density, there were significant differences among all samples, as indicated by the statistical results. Sample I proved to be the least dense of all (0.180) and contrarily sample A was the densest (0.310).
Tab. 3. Mass, volume and density of the different
brands of Maria cookies analysed.
Sample1 Mass 2 (g) Volume2 (cm3) Specific weight2 (g/cm3) A 5.78 ± 0.08d 18.66 ± 0.43e 0.310 ± 0.00e B 5.52 ± 0.15b 19.92 ± 0.65d 0.277 ± 0.00a C 5.75 ± 0.07d 29.89 ± 0.61g 0.192 ± 0.00f D 5.19 ± 0.08e 17.00 ± 0.93f 0.306 ± 0.01e G 6.00 ± 0.05c 27.95 ± 0.38c 0.215 ± 0.00c H 6.00 ± 0.07c 30.87 ± 0.83a 0.194 ± 0.01f I 5.23 ± 0.11e 29.05 ± 0.34b 0.180 ± 0.00d K 6.66 ± 0.35a 29.79 ± 0.42g 0.224 ± 0.01b 1Samples A to D are white brands, samples G to I are
com-mercial brands, sample k is foreign brand.
2Results are given as mean ± standard deviation. Values in
the same column with the same letter are not statistically different by Tukey test (p > 0.05).
The statistical analysis of data showed that mass is strongly correlated to fat (r = 0.819), and negatively correlated to protein (r = –0.611). This is due to the low density of fats as compared to proteins. On the other hand, density and volume are strongly nega-tively correlated (r = –0.970), as expected.
Colour
Colour is one of the parameters used for process control during roasting, because brown pigments appear as browning and caramelization reactions progress (Moss and Otten, 1989). Many factors have been reported to affect the development of colours on the product surface, including temperature, air velocity, moisture and heat transfer into the sample (Shibukawa et al., 1989).
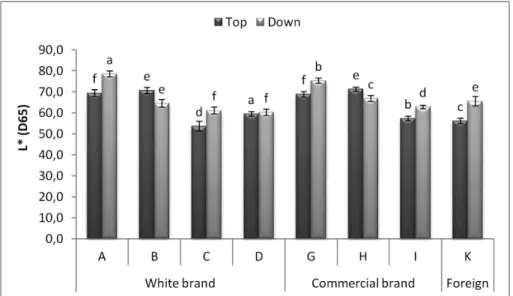
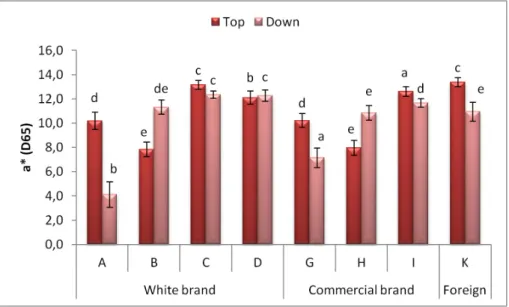
Figures 2 to 4 show the values of the colour para-meters L*, a* and b*. It can be seen in the Figure 2 that all the samples stand in the clear zone, with values of brightness (L*) above 50. In all cases the values of a* are positive, thus indicating the pre-dominance of the colour red over the green. The coordinate b* assumes also positive and relatively high values, indicate a strong predominance of the yellow colouration, in disfavour of the blue.
In general, the parameter L* on the upper side presents lower values than that on the down side, being darker on the top as shown for samples A, C, G, I and K (Figure 2). This is indicative of the existence of a browner colour on top of the cookie, due to the cooking process and to the contact with the hot air, which had a higher temperature than the oven tray. The colour of the crust is the result of browning and Maillard reactions, which depend on the content of reducing sugars and amino acids or proteins on the surface, as well as the
tempera-Fig. 2. Colour parameter L* for the Maria Cookies analysed. Values with the same letter are not statistically different by Tukey test (p > 0.05).
ture and cooking time (Cauvin and Young, 2006). Furthermore, the differences observed in L* might also be due to the heat transfer coefficients related to temperature, moisture and air velocity. Similar results were reported by (Goldstein and Seethara-man, 2011).
Generally, the values of coordinate a* on the top are higher when compared to the bottom of the cookie (Figure 3). The samples that showed a darker colour on top (lower values of L*), such as A, C, G, I and K, were also those showing higher values of the red-dish colour (higher a*). Probably, this effect is due to the red pigmentation resulting from the brown-ing and Maillard reactions. In samples B, D and H the red colouration at the top is less intense than at
the bottom. In this case the browning reactions are more marked at the base of the cookies, indicating that the tray had a higher temperature than the air in the oven.
The inspection of the coordinate b* in the Figure 4, reveals that the greatest differences between the cookies tested occurred at the top side, where the values varied from 30.47 to 34.51. Excluding sam-ples A and G, the b* values were generally higher in the lower side, so that the yellow colouration was more intense in the bottom.
The statistical analysis using Pearson coefficients allowed to observe a strongly negative correlation between the brightness at the bottom side of the cookie and carbohydrates content (r = –0.838). On
Fig. 3. Colour parameter a* for the Maria Cookies analysed. Values with the same letter are not statistically different by Tukey test (p > 0.05).
Fig. 4. Colour parameter b* for the Maria Cookies analysed. Values with the same letter are not statistically different by Tukey test (p > 0.05).
the other hand, the carbohydrates content and the colour coordinate a* at the bottom of the cookie re-veal a strong correlation (r = 0.727), since carbohy-drates have influence on the red colour, as expected by the effect of sugars in the development of brown pigments. Furthermore, the coordinates a* and L* reveal a strong negative correlation (r = –0.946 on top and r = –0.978 on bottom). Still, the coordinate b* of the surface of the cookie and the moisture con-tent show a strongly positive correlation (r = 0.718).
Texture
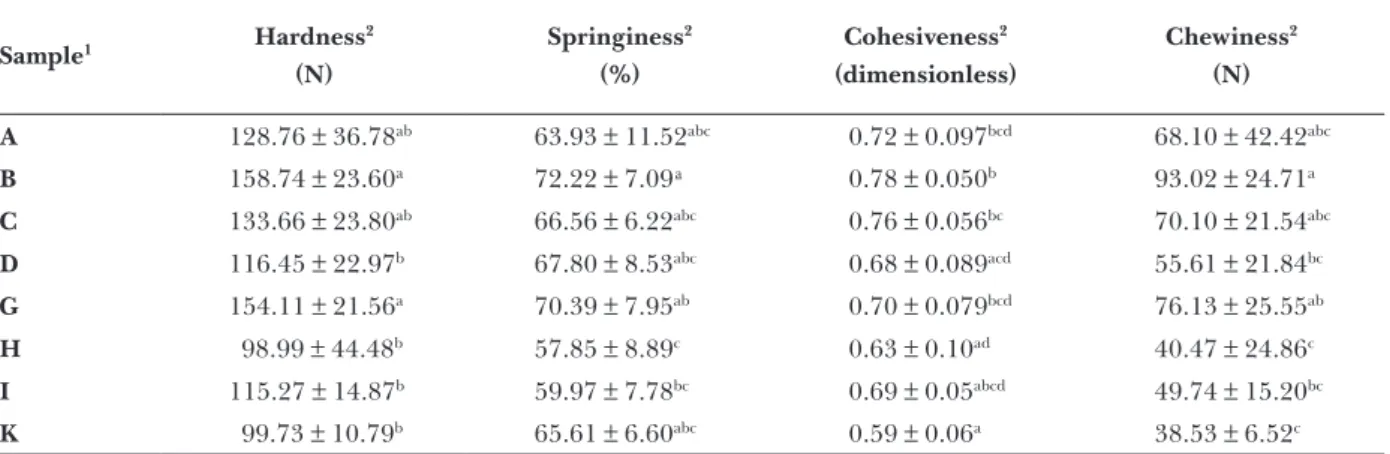
Table 4 shows the textural parameters calculated from the TPAs obtained for all samples. The re-sults for fracturability were not included, because they were found to be very variable, even among the same brand, being in some cases zero and in other cases very high. Maache-Rezzoug et al. (1998) investigated the effect of fat content in the texture of biscuits and found that an increase in fat content resulted in greater friability, and in a less crispy product.
The values of hardness showed that sample H was the softest while the sample B was the hardest, and, that foreign brand (K) was also one of the softest (Table 4). Hardness is the textural property which attracts more attention in evaluation of baked goods, because of its close association with human perception of freshness (Karaoğlu and Kotancilar, 2009). According to Seyhun et al. (2003), the in-creased hardness of the crumb can be attributed to the amylose and amylopectin re-crystallisation, to the formation of complexes between starch and proteins, and to redistribution of water between the components of the product, as well as other events which may occur in this baked product during storage. Samples D, H, I and K exhibit very similar
values of hardness. These lower values of hardness can be somehow justified by a high moisture con-tent present in sample H, while in sample K, it is its high fat content that increases brittleness, and that results from migration of moisture from the centre to the surface, causing breakage. These results can also be influenced by other factors such as a more open and irregular structure of the sample, protein denaturation, loss of water-holding capacity, solubi-lization of proteins and coagulation.
Elasticity of samples, measured as springiness in percentage, it showed that sample H was the least elastic while sample B was the most elastic (Table 4). Elasticity is the rate at which a product that has been deformed returns to its original condition after the external force is removed (Szczesniak et al., 1975). It has been reported in the literature that the elasticity of fully baked products generally decreases during storage (Baik et al., 2000; Gómez et al., 2004; Vulicevic et al., 2004).
The values presented in Table 4 for cohesiveness show that sample K was the least cohesive whereas sample B was the most cohesive. The cohesiveness corresponds to the internal strength of the bonds that make up the body of the food product and can be used to express the ability and rate at which the material disintegrates. A useful measure of cohe-siveness is the rate at which a food product disinte-grates under the mechanical action of chewing (Abbas et al., 2006; Szczesniak et al., 1975). The samples A, B and C present the higher values of cohesiveness, while sample K is the one which shows the lowest value, indicating greater fragility among all samples. The cohesiveness is the ability of a ma-terial to crack, so that the higher the cohesion value, the greater the ability of the cake to break when subjected to stress, such as for example certain
stor-Tab. 4. Textural parameters of the different brands of Maria cookies analysed.
Sample1 Hardness 2 (N) Springiness2 (%) Cohesiveness2 (dimensionless) Chewiness2 (N) A 128.76 ± 36.78ab 63.93 ± 11.52abc 0.72 ± 0.097bcd 68.10 ± 42.42abc B 158.74 ± 23.60a 72.22 ± 7.09ª 0.78 ± 0.050b 93.02 ± 24.71a C 133.66 ± 23.80ab 66.56 ± 6.22abc 0.76 ± 0.056bc 70.10 ± 21.54abc D 116.45 ± 22.97b 67.80 ± 8.53abc 0.68 ± 0.089acd 55.61 ± 21.84bc G 154.11 ± 21.56a 70.39 ± 7.95ab 0.70 ± 0.079bcd 76.13 ± 25.55ab H 98.99 ± 44.48b 57.85 ± 8.89c 0.63 ± 0.10ad 40.47 ± 24.86c I 115.27 ± 14.87b 59.97 ± 7.78bc 0.69 ± 0.05abcd 49.74 ± 15.20bc K 99.73 ± 10.79b 65.61 ± 6.60abc 0.59 ± 0.06a 38.53 ± 6.52c 1Samples A to D are white brands, samples G to I are commercial brands, sample k is foreign brand.
2Results are given as mean ± standard deviation. Values in the same column with the same letter are not statistically different
age conditions, differences in temperature, loss of intramolecular attraction between ingredients, dry-ing and tendency to break with agdry-ing (Karaoğlu and Kotancilar, 2009).
The evaluation of chewiness showed that, there is a wide range of variability between 38.53 and 93.02 N (Table 4). The chewiness corresponds to the energy needed to chew a solid food to a state of readiness to swallow. The samples under analysis showed that B and G have the highest value of chewiness, fol-lowed by sample C, with relatively similar values. These values are justified as a consequence of the high values of other textural parameters for these samples. Those cause that chewiness corresponds to the product of these three textural parameters. On the other hand, samples H and K displayed lower chewiness values. In a similar study, Karaoğlu & Kotancilar (2009) showed , that the symmetry index decreases significantly with increasing of initial and intermediate baking and storage time.
Given the great diversity in the moisture content values, significantly influencing the physical charac-teristics of the cookie, it would be expected some variability in the textural properties. Statistical analy-sis confirmed that elasticity presents an inverse cor-relation with moisture (r = –0.702). Furthermore, the hardness has a high correlation with the elasti-city (0.782), with cohesiveness (0.828) and with chewiness (0.973). Also chewiness is strongly related to springiness (0.766) and cohesiveness (r = 0.897). Manohar et al. (1999) studied the effect of fat and emulsifier on the texture of biscuits and concluded that the fat and the emulsifier used caused changes in the rheological properties of the masses and
the final quality of biscuits. In the present case, no important correlations were found between the textural properties and the fat content.
Sensory analyses
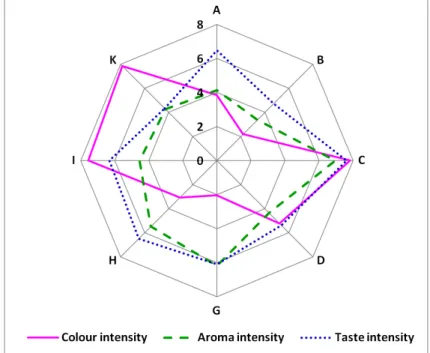
The colour intensity is related with many factors: the baking time of the dough; the contact and temperature in the baking plates or the formulation (either in fat or in cereal), thus different colours originate within the same sample (Pereira, 2013). Figure 5 reveals that the intensity of colour was found very different depending on the sample, Samples C, I and K were considered as having a very intense colouration whereas samples B and G were identified as those less coloured. As described earlier, all scores were in the range 0 to 10. The statistical analysis performed to the results obtained allowed concluding that samples C, I and K are not statistically different, therefore, they could not be differentiated by the sensorial panel used. The colour intensity perceived by the panellists was clearly influenced by the brightness of the upper side of the wafer as well as the coor-dinate a*, which assigns the hue to the crust of the cookie, these being inversely correlated variables (r = –0.946). The perception of the colour intensity of the cookie was found to be strongly negatively correlated to the coordinates L* and a* on the upper surface (with Pearson coefficients of –0.947 and –0.895, respectively). Also the colour intensity was found to correlate with protein and carbohydrates contents (r = –0.684 and r = 0.599, respectively). Figure 5 also shows that the aroma intensity of sample C stands out, being perceived as the most
aromatic, although in statistical terms samples C, G and H are different. Also the panellists were not able to differentiate samples A, B, D, I and K in terms of aroma intensity. In statistical terms, this property was inversely correlated with density (r = –0.621). The aroma intensity shows a strong correlation with the vanilla flavour (r = 0.931), because the aroma intensity is given by odoriferous characteristics that appear after baking of the cookie. This parameter also shows high correlation with other features such as the intensity of flavour (r = 0.726), sweet flavour (r = 0.777), butter flavour (r = 0.810), vanilla flavour (r = 0.861) and the overall assessment of the cookie (r = 0.847).
The evaluation of the taste intensity involves the perception of taste related to substances which constitute the sample. This sensory test shows, by observation of Figure 5, the preference for sample C, while sample K was evaluated as the least tasty. The remaining samples showed a high similarity, as demonstrated by statistical analysis. The results also showed a very strong positive relation between taste intensity and aroma intensity (r = 0.726) or vanilla aroma (r = 0.699) while demonstrating a negative relation with cereal aroma (r = –0.925).
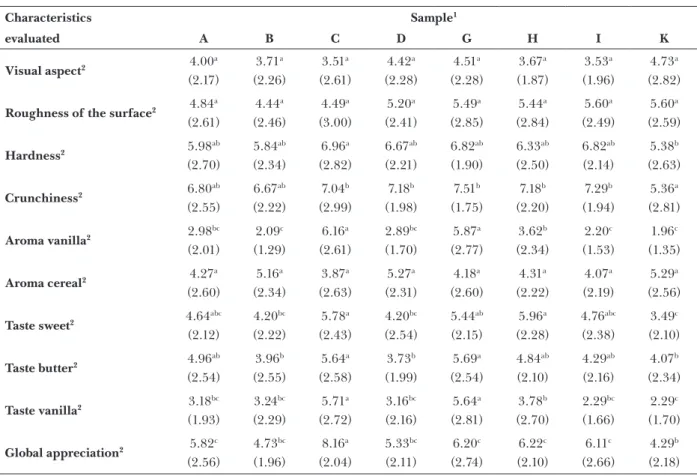
The results in table 5 show that the visual aspect of the cookies was evaluated in a similar way, and that the panellists were not able to differentiate any of the cookies. Still, sample K shows the highest result (an average score of 4.73) and sample C the lowest (score of 3.51), even though these differences are not statistically significant, due to the dispersion of the results. As to the roughness of the surface, once again the panellists were not able to differentiate the samples, being samples I and K the roughest. This variable was found to correlate with cohesiveness (r = -0.831) and with chewiness (r = –0.736). Also the visual aspect was related to fat content, with a Pearson coefficient of 0.640.
The textural property hardness in cookies is mainly associated to the moisture and fat content (Zoulias et al., 2002). According to the panellists, sample C was considered the harder (with a score of 6.96) while sample K was the less hard (with a score of 5.38) (see Table 5). In statistical terms, the panellists were able to differentiate samples C and K, but not other sam-ples. Furthermore, statistical analysis also showed that hardness was directly correlated with crunchi-ness, with a Pearson coefficient of 0.819, since the factors influencing both properties are shared.
Tab. 5. Sensorial evaluation of the different samples analysed.
Characteristics Sample1 evaluated A B C D G H I K Visual aspect2 4.00 a (2.17) 3.71a (2.26) 3.51a (2.61) 4.42a (2.28) 4.51a (2.28) 3.67a (1.87) 3.53a (1.96) 4.73a (2.82)
Roughness of the surface2 4.84a
(2.61) 4.44a (2.46) 4.49a (3.00) 5.20a (2.41) 5.49a (2.85) 5.44a (2.84) 5.60a (2.49) 5.60a (2.59) Hardness2 5.98 ab (2.70) 5.84ab (2.34) 6.96a (2.82) 6.67ab (2.21) 6.82ab (1.90) 6.33ab (2.50) 6.82ab (2.14) 5.38b (2.63) Crunchiness2 6.80ab (2.55) 6.67ab (2.22) 7.04b (2.99) 7.18b (1.98) 7.51b (1.75) 7.18b (2.20) 7.29b (1.94) 5.36a (2.81) Aroma vanilla2 2.98 bc (2.01) 2.09c (1.29) 6.16a (2.61) 2.89bc (1.70) 5.87a (2.77) 3.62b (2.34) 2.20c (1.53) 1.96c (1.35) Aroma cereal2 4.27a (2.60) 5.16a (2.34) 3.87a (2.63) 5.27a (2.31) 4.18a (2.60) 4.31a (2.22) 4.07a (2.19) 5.29a (2.56) Taste sweet2 4.64 abc (2.12) 4.20bc (2.22) 5.78a (2.43) 4.20bc (2.54) 5.44ab (2.15) 5.96a (2.28) 4.76abc (2.38) 3.49c (2.10) Taste butter2 4.96ab (2.54) 3.96b (2.55) 5.64a (2.58) 3.73b (1.99) 5.69a (2.54) 4.84ab (2.10) 4.29ab (2.16) 4.07b (2.34) Taste vanilla2 3.18 bc (1.93) 3.24bc (2.29) 5.71a (2.72) 3.16bc (2.16) 5.64a (2.81) 3.78b (2.70) 2.29bc (1.66) 2.29c (1.70) Global appreciation2 5.82c (2.56) 4.73bc (1.96) 8.16a (2.04) 5.33bc (2.11) 6.20c (2.74) 6.22c (2.10) 6.11c (2.66) 4.29b (2.18)
1Samples A to D are white brands, samples G to I are commercial brands, sample k is foreign brand.
2Results are given as mean value and in brackets the standard deviation. Values in the same row with the same letter are not
Regarding crunchiness it was found that sample K was identified as showing the lowest crispness (5.36), while sample G showed the highest value (7.51), although not statistically different from samples C, D, H, I, or even samples A and B.
The vanilla aroma is related to the concentration of ingredients added in the manufacture process of cookies, being also more or less related to other effects or combined with other factors, such as toasted, butter and cereal aromas). In the present case, the vanilla aroma was identified in higher concentrations in samples C and G, statistically not different, as can be seen in Table 5, but still very different from all other samples. On the other hand, the panellists identified samples B, I and K as those with a less intense aroma to vanilla. When the panellists were asked about the aroma to cereal (Table 5), they were not able to distinguish among the samples, being nevertheless sample C scored with the lowest value (3.87) and sample K with the highest value (5.29).
The results in Table 5 show that the sweet taste was mainly identified in samples C and H, being influenced by the addition of sucrose in the initial formulation. Still, these samples could not be fully differentiated from samples A, G and I. Sample C was considered by the panellists as the least sweet, although not distinguishable from samples A, B, D, G and I. Statistical analysis also demonstrated that the sweet taste was correlated to other sensorial properties, namely: vanilla aroma (r = 0.729), cereal aroma (r = –0.817), taste intensity (r = 0.838), or even with chemical properties, such as ash (r = 0.739) or carbohydrates (r = 0.602). It is interesting to note (Table 5) that samples containing higher butter taste (samples C and G) were also considered the sweetest, and that samples B and D, which revealed lower scores for butter taste, were also those that showed lower values for sweet taste. This observa-tion is corroborated by the high value of the Pearson coefficient correlating these two variables, r = 0.730. The samples that revealed high scores for butter taste (C and G) in the sensory analysis also showed to contain high levels of fat in their composition. The correlation between these properties is positive (r = 0.583). Furthermore, butter taste was also re-lated to carbohydrates content (r = –0.642). Finally, butter taste was correlated with aroma: vanilla (r = 0.878) and cereal (r = –0.807) as well as with taste intensity (r = 0.735), thus indi cating that the fats present contribute strongly to the perception of taste by the panellists. Results in the Table 5 also show that sample C was chosen by the members of the panel as the one with the greatest intensity of the vanilla flavour (score of 5.71) along with sample G (5.64), being these two brands clearly different
from all others, according to the statistical analysis performed, whereas the remaining samples regis-tered considerably lower scores, and, in particular, samples K and I (2.29), with the lowest values. It was further observed that the vanilla taste correlates with other properties, such as vanilla aroma (r = 0.978), intensity of taste (r = 0.622), sweet taste (r = 0.713) and butter taste (r = 0.841).
The global appreciation involves assessing the samples characteristics as evaluated in all the sensorial tests, and it this information that influ-ence the decision about what brand to purchase (Pereira, 2013). Table 5 shows that sample C was distinguished as the best among all brands tested (being this result statistically significant), and this assumes a further importance given that this is one of the white brands, so one of the brands sold at a lower price. Sample K (the foreign brand) stands on the other extreme, considered as the least preferred by the assessors, although not distinguishable from samples B and D, as the statistical results indicated. The results of the statistical analysis also revealed that the global appreciation correlates inversely with cereal aroma, with a Pearson correlation coefficient of –0.817, while correlating positively with characteristics like vanilla aroma (r = 0.813), intensity of taste (r = 0.951), sweetness (r = 0.819), butter taste (r = 0.742) and vanilla taste (r = 0.746). This indicates that these last properties contribute greatly for the overall assessment of the perceived quality by the members of the panel.
Multivariate analyses
The results of physical, chemical and sensory characteristics were subjected to multivariate analysis by Principal Component Analysis (PCA) and Cluster Analysis (CA) with software SPSS (version 19). In these analyses, those parameters which did not allow to discriminate the samples were excluded. Therefore, the following vari-ables: fibre, fat, carbohydrates, density, weight, volume, cohesiveness, springiness, a*, b* and L* (these three on the upper and lower sides), aroma intensity, colour intensity and taste intensity were considered.
The results of PCA showed that there are four main components that explain 73.2 % of the total variance, so that PCA1 explains 32.6 %, PCA2 ex-plains 26.6 % and PCA3 exex-plains 14.0 %. It was found that the first principal component is strong-ly related to variables associated to colour, such as L*
up (–0.900), L*down (–0.822), a*up (0.736) or a*down
(0.796). The second principal component is es-sentially defined by the physical and chemical variables: fat (0.787), carbohydrates (–0.620), weight (0.838), volume (0.718) and cohesiveness
(–0.748). In the case of the third principal compo-nent, the most important variables are related to the sensory perception: aroma intensity (0.784) and flavour intensity (0.905). Thus, one can inter-pret the three components that allow characte-rizing the structure of interconnection between the included variables, as follows:
— Component 1: Colour
— Component 2: Physico-chemical characteristics — Component 3: Sensory perception
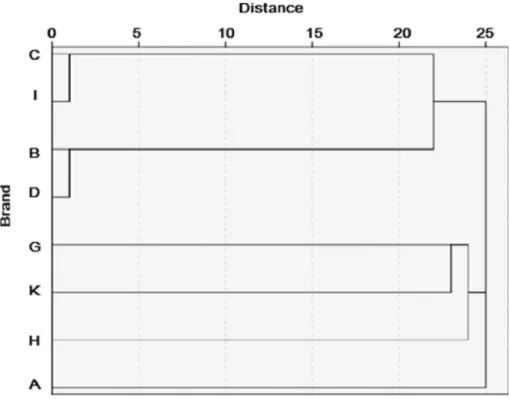
CA (Cluster Analysis) was performed by applying the Ward method, using the uncorrelated variables that represent data obtained in the principal com-ponent analysis. Figure 6 shows the dendrogram obtained. The graph in Figure 6 reveals that the samples are gathered into three distinct groups near to the Euclidean distance of 25, one of them corresponding to sample A, which is clearly dif-ferent from all others. It should be noted that when samples belong to the same group for a high Eucli-dean distance, this reveals that there is a significant similarity between them in statistical terms, based on the variables tested. However, the overall per-ception of the panellists does not quite corroborate these findings.
For a Euclidean distance of less than 20 the existence of six distinct groups was observed, being samples A, H, K and G completely distinguished. However, samples C and I were very similar, even for a very low Euclidean distance (under 5), and this is also observed for samples B and D. The observation that samples B
and D were very similar to each other was also made by the panellists, which in the overall analysis of the sensory characteristics were not able to discriminate between them, assigning them scores that were not statistically different in the global appreciation.
Conclusions
The present work allowed drawing some general conclusions that enabled to compare the eight dif-ferent brands of Maria cookies analysed.
Concerning the moisture content it could be con-cluded that sample B had less water while sample H was the one containing a greater amount of wa-ter in its constitution. Regarding the ash content no important differences were observed among brands, except for brand H that revealed a higher content. As to protein, sample K showed a lower content. The wide variability observed in the fat content, and also its high amount, are due to the use of butter in the formulation of Maria cookies, which is, however, important for its characteristic flavour. Of the samples studied, sample G showed the highest value for fat content, followed by sample K. As to the fibre content, it was found to be low in all brands, revealing the use of refined flours. As regards the content of carbohydrates it was observed that sample G had the lowest amount while sample D was the richest in carbohydrates. It was observed that white brands had a lower volume as compared to the other cookies (e.g. the
biggest sample H). Sample K was the heaviest, and, regarding density, the least dense was sample C while the most dense was A.
Concerning the brightness, samples A, B and samples G, H were the brightest of all samples, in contrast with sample C, which was the darkest. It was further observed that the colour was strongly yellow (a* positive) and red (b* positive), either of the upper or the bottom sides of the cookies. Regarding texture, sample G was the hardest and sample H the softest. Springiness was also the lowest in sample H and the highest in samples B and G. Cohe-siveness was clearly the lowest in sample K, although not clearly distinguishable in the other brands. As to chewiness, some differences were observed, with samples H and K presenting the lowest values, much influenced by the low values for hardness.
The sensorial evaluation showed that samples C, K and I were considered to have a strong colouration, while samples C and A had the stronger aroma, and sample C the more intense taste. From these results, sample C stands out as very high classified in all these characteristics. Also in the global appreciation sample C was clearly identified as the best brand among the Maria cookies tested.
References
Abbas SA, Ali S, Halim SIM, Fakhrul-Razi A, Yunus R, Choong TSY (2006) Journal of Food Engineering 76: 626—631.
Anzaldúa-Morales A (1994) La evaluación sensorial de los alimentos en la teoria y la prática, Editorial Acribia, Zaragoza.
AOAC (2000) Official methods of analysis, Association of Official Analytical Chemists, Washington.
Baik OD, Marcotte M, Castaigne F (2000) Food Research International 33: 599—607.
Bourne MC (1975) Interpretation of force curves from instrumental texture measurements em Rhelogy and Texture in Food Quality, The AVI Publishing Company, Inc., Westport, Connecticut.
Cauvin S, Young L (2006) Productos de panadería: Ciencia, Tecnologia y Prática Editorial Acribia, S. A., Zaragoza-España.
Gaines CS, Kassuba A, Finney PL (1992) Cereal Chemistry 69: 115—119.
Goldstein A, Seetharaman K (2011) Food Research International 44: 1476—1481.
Gómez M, Delreal S, Rosell CM, Ronda F, Blanco F, Blanco CA, Caballero PA (2004) European Food Research and Technology 219: 145—150.
Hoseney RC (1998) Principles of Cereal, Science and Technology, American Association of Cereal Chemists, Inc., St. Paul, Minnesota, USA.
Karaoğlu MM, Kotancilar HG (2009) International Journal of Food Science & Technology 44: 93—99. Kemp SE, Hollowood T, Hort J (2009) Sensory
Evaluation: A Practical Handbook, Wiley-Blackwell, United Kingdom.
Lara E, Cortés P, Briones V, Perez M (2011) LWT — Food Science and Technology 44: 622—630.
Maache-Rezzoug Z, Bouvier J-M, Allaf K, Patras C (1998) Journal of Food Engineering 35: 23—42.
Manley D (1998) Biscuit, Cookie and Cracker Manu-facturing: Manual 1 — Ingredients, Woodhead Publishing Limited, Cambridge-England.
Manohar RS, Rao PH, Manohar RS, Rao PH (1999) European Food Research and Technology 210: 43—48.
Matuda TG (2008) Estudo de congelamento de massa de pão: Determinação experimental das propriedades termofísicas e desempenho de panificação. PhD Thesis, Escola Politécnica — Universidade de São Paulo, São Paulo, Brasil.
Meilgaard M, Civille GV, Carr BT (1999) Sensory Evaluation Techniques, CRC Press, United States of America.
Monteiro ARG, Martins MF (2003) Processo de produtos na indústria de biscoitos: Estudos em casos de fabricantes de médio porte. IV Congresso Brasileiro de Gestão e Desenvolvimento de Produtos, 1—10. Moss JR, Otten L (1989) Canadian Institute of Food
Science and Technology 22, 34—39.
Pereira D (2013) Estudo comparativo de bolacha maria de diferentes marcas. Master Dissertation, Instituto Politécnico de Viseu, Viseu, Portugal.
Perrot N, Trystram G, Le Guennec D, Guely F (1996) Journal of Food Engineering 29: 301—315.
Piteira MFC (2005) Alimentos Funcionais: Incorporação de Fibras em Bolachas.Doutoramento em Engenharia Agro-Industrial, Universidade Técnica de Lisboa — Instituto Superior de Agronomia, Lisboa, Portugal. Rodrigues A (2012) Caracterização de pão Regional do
Distrito de Viseu e de Pão São. Master Thesis, Instituto Politécnico de Vise, Viseu, Portugal.
Rosenthal AJ (2001) Textura De Los Alimentos: Medida y Percepción, Editorial ACRIBIA, S.A., Zaragoza — España.
Saltin S, Sumnu SG (2006) Physical Properties of Foods, Ankara, Turkey.
Seyhun N, Sumnu G, Sahin S (2003) Nahrung 47: 248—251.
Shibukawa S, Sugiyama K, Yano T (1989) Journal of Food Science 54: 621—624.
Szczesniak AS, Loew BJ, Skinner EZ (1975) Journal of Food Science 40: 1253—1256.
Vulicevic I, Abdel-Aal E-S, Mittal G, Lu X (2004) LWT — Food Science and Technology 37: 205—213.
Zoulias EI, Oreopoulou, V, Tzia C (2002) Journal of Food Engineering 55: 337—342.