Are Firms that Contribute to Sustainable
Development Valued by Investors?
Maria del Mar Miralles-Quiros,
1* Jose Luis Miralles-Quiros
1and Irene Guia Arraiano
2 1University of Extremadura, Financial Economics, Faculty of Economics, Badajoz, Spain 2Lisbon Polytechnic Institute, Lisbon, PortugalABSTRACT
Sustainability reporting contributes to making sustainable development a higher priority for
companies, increases the social responsibility of their managers, and reinforces the
credibil-ity and trust of their stakeholders. However, prior research about the value relevance of
sus-tainability disclosure for
financial stakeholders provides inconclusive results. In this context,
the aim of our research is to analyse whether sustainability disclosure provides relevant
in-formation and incremental value for investors in the European setting where this practice
has been steadily increasing in the period 2001–2013. Our overall results support the belief
that conducting business in accordance with ethical norms is value relevant for European
in-vestors. However, our results also reveal that there is no homogeneity among markets, even
for the periods before and after the global
financial crisis. These findings could have several
implications for internal and external stakeholders such as managers, shareholders, and
policymakers. Copyright © 2016 John Wiley & Sons, Ltd and ERP Environment
Received 13 November 2015; revised 3 September 2016; accepted 14 September 2016
Keywords: sustainable development; sustainability reports; stakeholder engagement;financial stakeholders; financial crisis
Introduction
E
NVIRONMENTAL AND SOCIAL CONCERNS HAVE CONTINUOUSLY BEEN ON THE RISE IN THE LAST 20 YEARS. ACCORDINGLY,stakeholders have started to demand that companies take responsibility for the impact of their activities on the environment and society by disclosing information on how they are managing this impact (Bowerman & Sharman, 2016). Therefore, many companies have started to use sustainability reports that enable them to exhibit their sustainability and social responsibility initiatives.
This practice is especially relevant for companies quoted on stock markets. By providing this additional
informa-tion,firms can reduce the information asymmetries between managers and financial stakeholders. More
informa-tion would attenuate thefinancial stakeholders’ uncertainty about the future economic benefits and the risks of the
company could be reduced. Analysts and investors can use this information to make better estimates of the *Correspondence to: Maria del Mar Miralles-Quiros, University of Extremadura, Financial Economics, Faculty of Economics, Av. Elvas s/n, Badajoz 06071, Spain.
E-mail: marmiralles@unex.es
Published online in Wiley Online Library (wileyonlinelibrary.com)DOI: 10.1002/csr.1392
company’s shares (Healy and Palepu, 2001). We can therefore expect a positive association between corporate social responsibility (CSR) disclosure and the market value of companies that provide this kind of information.
However, previous empirical evidence in this researchfield provides mixed results. There are some reasons for
these inconclusivefindings: the use of data from different countries and time periods that makes the comparison
across studies unbearable and even the use of different measures of CSR disclosure. This is because CSR disclosure is still a voluntary reporting practice in several countries and is performed in a non-default format.
In this sense, not only investors but also analysts and other financial stakeholders usually request for
harmonisation, standardisation, and objective reports worldwide to facilitate comparison across companies (Alonso-Almeida et al., 2014). The Global Reporting Initiative (GRI) was created for that purpose. Thus, the GRI is the most widely used global standard for sustainability reporting according to several researchers (Brown et al., 2009; Prado-Lorenzo et al., 2009; Rasche, 2009; Skouloudis et al., 2009; Tsang et al., 2009; Levy et al., 2010; Marimon et al., 2012; Roca and Searcy, 2012).
In this context, the aim of this study is to examine whether CSR disclosure following GRI guidelines provides relevant information and incremental value to investors on the European stock markets of Denmark, Finland,
France, Germany, Italy, the Netherlands, Norway, Spain, Sweden, and the United Kingdom over the 2001–2013
period, considering the singularities of each market as well as the impact of the internationalfinancial crisis.
The contribution of this research to prior literature is two-fold. First, we focus on the European setting where
CSR disclosure has been continuously increasing over the sample period under the influence of the economic
pol-icies defined by the European Commission (2011). However, there still exist cultural and legislative differences
among countries. For that reason, we not only analyse the European markets as a whole, but we also provide
evi-dence from each market individually despite current research which focuses on a specific industry (Carnevale
et al., 2012), a particular market (De Klerk et al., 2015; Bowerman and Sharman, 2016) or even exclusively on the
largestfirms (Kaspereit and Lopatta, 2016). Secondly, we provide evidence before and after the global financial crisis
which could supposedly change the preferences offinancial stakeholders about this kind of information.
Our overall results reveal that European investors as a whole value this type of information, especially in the years
prior to the internationalfinancial crisis. It supports the belief that conducting business in compliance with ethical
norms is a value-increasing business strategy for investors. However, we also observe differences among markets. It seems that only investors in the German and UK markets consider CSR disclosure information in the total
informa-tion set used for their investment decision-making. Investors in the remainder markets do not appear tofind that
CSR disclosure provides incremental value to their valuations of thefirms, except in the case of the Swedish market
in which we observe a negative influence on the share value of firms that disclose sustainability information. Finally,
our results indicate that the behaviour of investors before the economic crisis was not maintained and there are
significant changes in share appreciation for the companies that publish sustainability reports.
Thesefindings could have several implications for internal and external stakeholders: for managers when
consid-ering their disclosure decisions; forfinancial stakeholders such as shareholders, potential investors, and analysts
when making their investment decisions or preparing their investment advice; for policymakers when
implementing new regulations about sustainability disclosure; and other non-financial stakeholders such as clients
or citizens interested in companies’ reports related to social and environmental issues.
The remainder of the paper is organized as follows. We present previous empirical evidence about thisfield. We
then outline the methodology employed for our empirical research. Next we define the database employed about
sustainability reports and European stock markets. We then show the results obtained and finally provide the
conclusions of our study.
Literature Review
Sustainability reporting has received a great deal of attention from academics. Previous research has focused on the disclosure and credibility of CSR information (Kolk, 2003; McMurtrie, 2005; Alonso-Almeida et al., 2014; Fernández-Feijoo et al., 2014; Romolini et al., 2014; Martínez-Ferrero et al., 2015); the motives for managers to com-pile sustainable reports (Brown and Fraser, 2006; Kolk, 2008; Spence, 2009; Baumgartner, 2014; Frias-Aceituno et al., 2014; Lozano, 2015); the links between CSR disclosures and business characteristics (Secchi, 2006; Brammer and Pavelin, 2008; Garcia-Sanchez, 2008; Haddock-Fraser and Fraser, 2008; Mio, 2010; Miras-Rodriguez et al.,
2015; Perez-Lopez and Moreno-Romero, 2015); and how stakeholders react to CSR disclosures (Collison et al., 2003; Hassel et al., 2005; Cormier and Magnan, 2007; Wahba, 2008; Moneva and Cuellar, 2009; Prado-Lorenzo et al., 2009; Schadewitz and Niskala, 2010; Berthelot et al., 2012; Cardamone et al., 2012; Carnevale et al., 2012; De Klerk and De Villiers, 2012; Carnevale and Mazzuca, 2014; Dobele et al., 2014; De Klerk et al., 2015; Bowerman and Sharman, 2016; Kaspereit and Lopatta, 2016).
However, despite numerous studies in thisfield, we believe that the value that financial stakeholders assign to
sustainability reports is not yet clear (Wahba, 2008; Carnevale et al., 2012). Some authors document that CSR infor-mation is regarded as value relevant for investors employing surveys (De Villiers and Van Staden, 2010, 2012; Beare et al., 2014) or analysing the impact of this kind of information on share returns (Murray et al., 2006; Jones et al., 2007). Nevertheless, the majority of researchers have employed the valuation model proposed by Ohlson (1995) in
which the share value of equity is explained by the mandatoryfinancial accounting information provided by the
company, combined with other non-accounting information such as CSR disclosures. As Bowerman and Sharman
(2016) indicate, if analysts or investors combine CSR disclosure with thefinancial information they use in their
in-vestment decision-making process, then these two types of information together should better explain market valu-ations. However, previous research examining the association between CSR disclosures and the share value of equity employing this methodology provides inconclusive results, suggesting the need for further investigation.
The first studies, such as those of Hassel et al. (2005), Cormier and Magnan (2007), and Moneva and Cuellar
(2009), focused on the value relevance of environmental information with different results. In particular, Hassel et al. (2005) found that the environmental information disclosed by Swedish companies in the 1990s was associated
with a decrease in the market value of equity. Theirfindings were supported by the cost-concerned perspective,
which attributes a decrease in market value to increased costs associated with the increase in disclosure. For the same period, Cormier and Magnan (2007) analysed the impact of voluntary environmental reporting on the market
value of Canadian, French, and German listedfirms and only found a positive impact on the German stock market.
Later, Moneva and Cuellar (2009) foundfinancial environmental disclosure by Spanish companies to be associated
with an increase in share prices during the period 1996–2004.
Thefirst studies that analysed the value relevance of social and environmental reports were those of Schadewitz
and Niskala (2010) and De Klerk and De Villiers (2012), who followed the GRI guidelines, and those of Berthelot et al. (2012), Cardamone et al. (2012), Carnevale et al. (2012) and Carnevale and Mazzuca (2014), who employed hand-collected CSR data without considering any broadly applicable or reliable set of standards.
Schadewitz and Niskala (2010) analysed the behaviour of a very small number of socially responsible companies in the Finnish market. Having started the study with only 7 companies in 2002, and reaching 15 in 2005, the results
were conclusive in demonstrating that the information made available by the GRI has a positive influence on the
value of the companies quoted on the stock market. Moreover, De Klerk and De Villiers’ (2012) results indicated that
the combined effect of CSR disclosure andfinancial accounting information explained South African market
attri-butes better than an exclusive focus onfinancial accounting information.
Meanwhile, Cardamone et al. (2012) analysed 178 companies listed on the Italian stock market over the
2002–2008 period and concluded that the relationship between financial and sustainability information was
nega-tive, showing that the investors did not value the non-financial information. On the contrary, Berthelot et al. (2012)
investigated 146 companies listed on the Canadian stock market, 28 of which published sustainability reports in 2007. Their results showed that investors valued companies that adopted CSR practices and, in turn, the companies
benefited financially for adopting such practices.
In this line of research are the works of Carnevale et al. (2012) and Carnevale and Mazzuca (2014) for the banking sector. On the one hand, Carnevale et al. (2012) analysed all European-listed banks in the Euro-12 zone over the
2002–2008 period. The analysis for the entire sample does not provide evidence that investors attribute value
relevance to social reporting. However, the cross-country analysis shows that in some countries the social report positively affects the stock price and in others negatively affects the stock price. On the other hand, Carnevale and Mazzuca (2014) analysed 14 countries with a total of 113 banks considered socially responsible over the
2002–2011 period. The authors concluded that, even though the economic crisis had a negative effect on all banks,
socially responsible or not, European banks that published sustainability reports fared better during the crisis. The most recent studies are those of De Klerk et al. (2015), Bowerman and Sharman (2016), and Kaspereit and Lopatta (2016). All of them have in common analysis of the largest companies and the use of alternative criteria
to measure CSR practice and disclosure. De Klerk et al. (2015) studied the 69 of the largest companies quoted on the British market in 2008. By applying the GRI criteria, as well as the information extracted from the KPMG report, they concluded that British investors valued the socially responsible companies analysed in that particular year. Sub-sequently, Bowerman and Sharman (2016) analysed the UK and Japan markets and observed that only investors in the UK consider CSR disclosure information in their total information set for their investment decision making.
Whereas investors in Japanesefirms do not appear to find that CSR disclosure provides incremental value to their
valuations of thefirms.
Finally, we highlight the work of Kaspereit and Lopatta (2016). These authors analyse whether relative corporate sustainability as measured by the Sustainable Asset Management (SAM) ranking and sustainability reporting in terms of GRI application levels are associated with a higher market valuation for a sample comprised by the 600
largest European companies over the 2001–2011 period. Their results show that membership of the Dow Jones
Sus-tainability Index (DJSI), which is based on the SAM susSus-tainability ranking, is associated with a higher market valu-ation over the sample period. Meanwhile, the empirical evidence is less conclusive when GRI sustainability reporting is analysed. In addition, the research of Kaspereit and Lopatta (2016) does not provide a cross-country comparison. In this context, our study aims to provide further research that improves on these limitations.
Methodology
To analyse whether investors value the social responsibility information provided by companies, we employ the valuation model developed by Ohlson (1995, 2001). This model is based on the premise that market value of equity
is a function of book value and accounting earnings (i.e.,financial accounting information) as well as of other
non-financial information which can be regarded as relevant to the increased value of a company.
In this study, we consider the information provided by companies in their sustainability reports in compliance with the GRI criteria which are the most widely used for CSR disclosure. In this sense, we consider that companies which adopt the GRI framework are more likely to have higher-quality CSR disclosure which could be value relevant for investors. Thus, the proposed model is given by the following equation:
MVi;t¼ α0þ α1BVi;tþ α2Ei;tþ α3GRIi;tþ εi;t (1)
where MVi , tis the market value of company i in year t, BVi , tis the book value of company i in year t, Ei , t
rep-resents the earnings of company i for the year t, GRIi , tis a dummy variable, which takes the value 1 if the company i
publishes its sustainability report in accordance with the GRI criteria in year t, and zero otherwise; andfinally, εi , tis
the error of the company i in year t. We expectα3, the coefficient for GRI disclosure, to be positively and significantly
associated with the market value of equity, thus indicating that this information is value relevant for investors. We employ a panel data methodology for our empirical research which consists of a combination of time-series
and cross-sectional data in a joint test and allows us to control for individual heterogeneity– or unobservable
com-pany effects– as well as for the endogeneity of the explanatory variables. Thus, we consider all companies quoted
on the ten major European stock markets over the period 2001–2013 in the preliminary regression model. However,
we must highlight that our sample period includes the globalfinancial crisis that began in the USA in mid-2007 with
the sub-prime mortgage crisis and continued some months later with the default of Lehman Brothers, one of the larg-est banks in the USA. These events were the beginning of a recession period in developed countries with negative consequences in all economies including intense falls in the European stock markets. In this context, we consider
it is essential to analyse to what extent the economic context may influence the initial results obtained for the entire
sample. For that reason, we also provide evidence for two sub-sample periods: afirst sub-sample period from 2001 to
2007, prior to the globalfinancial crisis; and a second sub-sample period from 2008 to 2013 of economic recession.
Moreover, we highlight that the singularities of each country should be considered in this broad analysis of the European markets. As Jackson and Apostolakou (2010) indicate, the characteristic of each European market, such as
the number of quotedfirms, the legislation, as well as the social and environmental policies adopted by each
gov-ernment may influence the market value of socially responsible companies. Therefore, we include a cross-country
Finally, we note that the goodness offit of the panel data regression model previously proposed is provided
show-ing the F statistic which analyses the joint significance of the explanatory variables as well as the adjusted R2that
represents the proportion of variability of the dependent variable that is explained by the explanatory variables.
Database
The database employed in this study is composed of two types of relevant information: social responsibility informa-tion based on companies’ sustainability reports and financial informainforma-tion usually employed by investors in their investment decision-making process. We describe in this section these two types of information.
Information about Social Responsibility
Recent years have been characterised by a substantial increase worldwide in the number offirms that have started to
publish sustainability reports. This trend has accelerated the need to provide credibility and to create legislation that supports the information provided. Thus, the GRI was created with the aim of helping organisations to provide in-formation about sustainability, as well as to assist stakeholders in interpreting it. Therefore, every year since 1999,
the GRI prepares and publishes a list offirms that publish sustainability reports worldwide in accordance with its
globally recognised criteria, which are used in the present study.
The number of companies that are socially responsible according to these criteria has increased over the last de-cade predominantly in Europe. Among other reasons, this may be due to the European Union recommendations as well as the individual member states legislation. In this sense, we must highlight the publication of the COM 2001 366 (Green Paper) by the European Commission in , 2001, and the COM 2002 347 in 2002, where a strategy for CSR was presented, inviting companies to voluntarily adopt social, environmental, and economic objectives in their relations with the stakeholders, with the aim of directing investors to companies that publish sustainability reports. Following the EU recommendations, the Spanish government introduced the mandatory presentation of envi-ronmental reports (BOE, 2002). After that, the UK government elaborated the UK Companies Act (2006) urging companies to publish sustainability reports. Moreover, in the wake of the economic crisis of 2008, the Danish gov-ernment understood that in times of economic crisis it is advantageous for companies to adopt socially responsible practices which act as a strategic defence mechanism in the corporate world, and elaborated the Action Plan for Corporate Social Responsibility (Danish Government, 2008). More recently, in 2013, the Swedish government introduced a new legal requirement, making it mandatory for companies to incorporate into their policies aspects such as respect for human rights, and the reduction of their impact on climate change.
In this context, we analyse the sustainability reports provided by 1650 companies quoted on the stock markets of
ten European countries– Denmark, Finland, France, Germany, Italy, the Netherlands, Norway, Spain, Sweden, and
the UK– over the 2001–2013 period.1It is a wide sample not only because of the number offirms considered but
also because it covers 13 years of analysis. According to the information presented herein, 2001 marked an increase in the number of companies in Europe that started to publish sustainability reports in compliance with GRI criteria, and for that reason, it was selected as the initial year of our empirical research. Meanwhile, we should highlight that
our study exclusively considers non-financial firms. We decided to exclude financial firms because they have a
specific accounting system which is different from the other sectors of activity.2
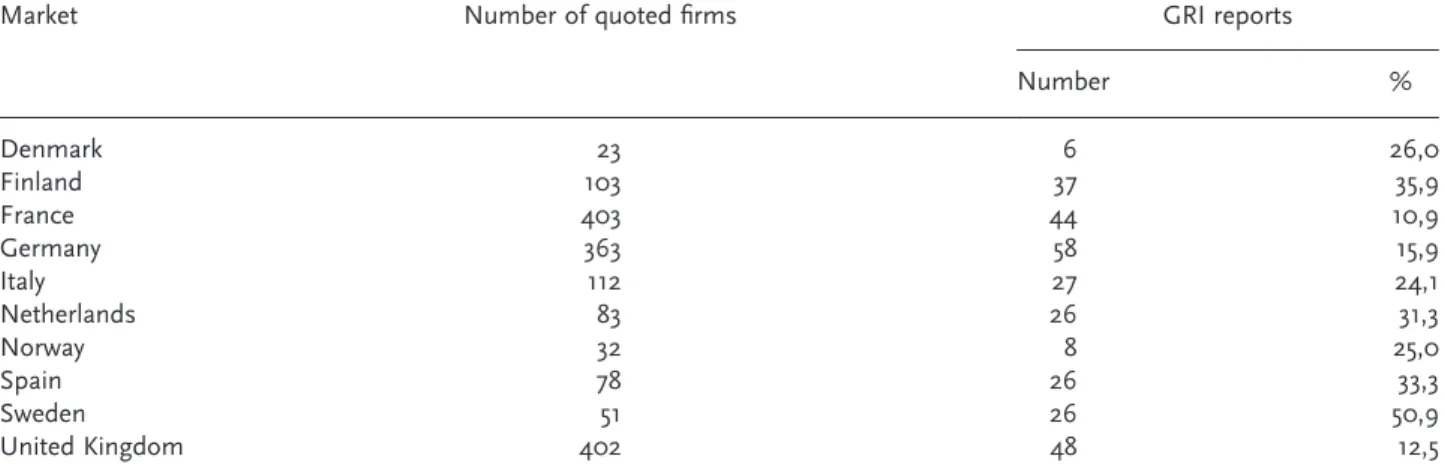
Table 1 shows the structure of our sample in each of the ten European stock markets considered during the
2001–2013 period and after the exclusion of the financial firms. Moreover, we display the number of listed firms
that publish sustainability reports in accordance with the GRI criteria, as well as the percentage that this selected
group represents among all listedfirms.
As we can see in Table 1, France, the UK, and Germany are the major European stock markets, with 403, 402,
and 363 listedfirms in their respective stock markets, Germany being the leader in terms of CSR disclosure with
58 companies that publish sustainability reports following the GRI guidelines (which represent the 15.9% of the market), followed by the UK with 48, and France with 44. Meanwhile, the Nordic countries have the largest 1The remainder of European stock markets were excluded from the study because the number of listedfirms with CSR disclosure practices in
compliance with the GRI guidelines was limited.
percentage of listed firms that publish sustainability reports. More precisely, Sweden has a 50.9% followed by Finland with a 35.9%. Finally, within the Mediterranean markets, Spain and Italy are the leaders with 33.3% and 24.1%, respectively.
Financial Information
Thefinancial information required to apply the Ohlson (1995) valuation model described in the methodology
sec-tion, in particular the market value and book value of equity at the end of each calendar year, as well as the annual earnings of each company, were taken from the Thomson Reuters DataStream database.
Table 2 provides the descriptive statistics (mean, maximum, minimum, and standard deviation) of these vari-ables as well as the number of observations of the sample. We employ a share price specification of the Ohlson (1995) model as recommended by Barth and Clinch (2009) to mitigate any scale effects present in the sample. For that reason, the information in Table 2 is provided in per share rates. As we can see, the average share price of the sample companies is 17.95 with a standard deviation of 29.57, the mean book value per share is 12.80 with a standard deviation of 30.59 and the average earnings per share is 1.21 with 2.6 of the standard deviation. Moreover, we highlight that observations with a negative book value were removed from the sample, in accordance with Lourenço et al. (2012; 2014). Additionally, to make sure that the sample outliers did not influence the regression re-sults, we sorted the market value in ascending order and the companies of each country in the top and bottom 2.5%
were removed.3As a result, we have a total of 18,694 observations in the sample.
Empirical Results
Empirical Results for the Ten European Markets
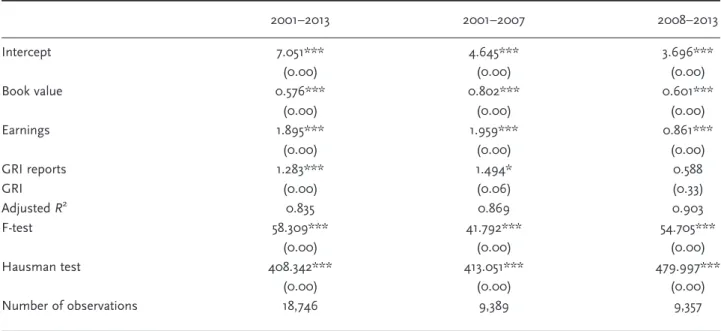
We initially present the results obtained applying the Ohlson (1995) valuation model considering the ten European markets as a whole. Results are reported in Table 3 for the entire sample as well as for the two sub-samples.
For the entire sample, we observe that, as expected, the coefficients for book value per share and earnings per
share are positively and significantly associated with share price. Moreover, the coefficient for GRI disclosure is
pos-itive and statistically significant at a 1% level. It indicates that the European markets as a whole value the socially
responsible companies included in the list published by the GRI during the 2001–2013 period. These overall results
are similar to those obtained by Kaspereit and Lopatta (2016) for the largest European companies and indicate that conducting business in accordance with ethical norms is value relevant for European investors.
3This procedure is in accordance with prior literature, where it is discussed and studied by Curto et al. (2011).
Market Number of quotedfirms GRI reports
Number % Denmark 23 6 26,0 Finland 103 37 35,9 France 403 44 10,9 Germany 363 58 15,9 Italy 112 27 24,1 Netherlands 83 26 31,3 Norway 32 8 25,0 Spain 78 26 33,3 Sweden 51 26 50,9 United Kingdom 402 48 12,5
Table 1. Structure of the sample
This table shows the structure of the sample in each of the 10 European stock markets considered, during the period of 2001 to 2013, after the exclusion of thefinancial sector and the extraction of outliers. The number of selected companies according to the GRI criteria, as well as the percentage of listed companies in their respective markets, is also shown.
Thesefindings are especially relevant for managers because they reveal they have adequately disclosed sustain-ability information to the investment community. In this sense, we must note that investors are critical stakeholders
and can wield considerable influence on the sustainability strategy of the companies they own. For that reason,
com-panies must provide high quality information as well as drive investors to this information. Consequently, the cred-ibility and trust of investors in this kind of information is associated with an increase in the share value of equity. Meanwhile, we take into account that the Ohlson (1995) valuation model is based on a predicted positive and
sig-nificant association between the market value of equity and its explanatory variables. However, this association
might be different for recession periods such as the last one initiated in mid-2007 in the USA and expanded all over the world in the subsequent months, especially affecting European countries. For that reason, we divide our sample
period in two sub-samples– from 2001 to 2007 and from 2008 to 2013 – to provide evidence in two different
eco-nomic states. As we can see in Table 3, although the mandatoryfinancial information is value relevant for investors
in both subsamples, when we analyse the value relevance of sustainability information we observe that during the
Market value Book value Earnings
Mean 17.957 12.800 1.211
Maximum 426.649 886.792 47.680
Minimum 0.013 0.000 0.000
Standard deviation 29.573 30.598 2.674
Number of observations 18,694
Table 2. Descriptive statistics
This table shows the descriptive statistics (mean, maximum, minimum, and standard deviation) of the market value, book value and earnings per share variables of the ten European markets as a whole during the 2001–2013 period. Finally, the number of observations is provided. 2001–2013 2001–2007 2008–2013 Intercept 7.051*** 4.645*** 3.696*** (0.00) (0.00) (0.00) Book value 0.576*** 0.802*** 0.601*** (0.00) (0.00) (0.00) Earnings 1.895*** 1.959*** 0.861*** (0.00) (0.00) (0.00) GRI reports 1.283*** 1.494* 0.588 GRI (0.00) (0.06) (0.33) AdjustedR2 0.835 0.869 0.903 F-test 58.309*** 41.792*** 54.705*** (0.00) (0.00) (0.00) Hausman test 408.342*** 413.051*** 479.997*** (0.00) (0.00) (0.00) Number of observations 18,746 9,389 9,357
Table 3. Empirical results for the ten European markets
This table shows the results of the Ohlson (1995) valuation model in Europe during the 2001–2013 period, and over the sub-periods of 2001–2007 and 2008–2013. The explanatory variables are the book value and earning per share as well as a dummy variable that takes the value 1 if a company is included in the GRI list in the respective year, and zero otherwise. The values of the adjustedR2 andF statistics as well as the Hausman test and their respective p-value are presented in the table, as well as the number of observations.
2001–2007 period, investors value socially responsible companies that comply with GRI while for the 2008–2013 period, the results are not statistically relevant.
There could be diverse explanations for these results. On the one hand, it is expected that during turbulent pe-riods in the stock markets, investors are more concerned about the level of risk they are assuming than other issues
such as sustainability. On the other hand, these results could be caused by the specific practices of the companies in
recession periods, such as the reduction of the CSR developments or the quality of their sustainability reports. These
facts in which the reports are not adequate or are less informative could produce distrust among financial
stakeholders.
Empirical Results for Each European Market
As we indicated in the methodology section, it is essential to consider the singularities of each country in this broad analysis of the European setting. For that reason, we provide in this sub-section evidence from each market individ-ually not only for the entire sample but also for the two sub-samples.
The results of the regression model applied to each European market in the period from 2001 to 2013 are
pre-sented in Table 4. We observe that the coefficients associated with the book value and earnings per share are positive
and significant for almost all markets. However, we also observe that the coefficient associated with the GRI variable
is only positive and significant for the German and British markets, with a 1% and 10% significance level
respec-tively. These results are similar to those obtained by Cormier and Magnan (2007) for the German market, and by De Klerk et al. (2015) for the British one. In contrast, the Swedish market is the only one that penalizes CSR disclo-sure practices. However, these results are in accordance with those obtained previously by Hassel et al. (2005). The
rest of the markets do not have statistically significant values.
These results corroborate the existence of great differences among markets, documented by previous empirical
studies. Accordingly, our findings contribute to public policy debates at the country and European Union levels
(Albareda et al., 2008; Prado-Lorenzo et al., 2009; Galani et al., 2012; Sierra et al., 2013; Beare et al., 2014; Romolini et al., 2014), especially in relation to whether or not to regulate CSR disclosure and, more precisely, whether sustain-ability reporting should be mandatory. As we expressed before, the UK government has already adopted a national law on CSR reporting, while Germany has just resisted this commitment. However, many large German companies are internationally recognised for their CSR practices, and they are quite advanced on environmental performance, as well as social dialogue and stakeholder engagement (Beier, 2012). As we document in this research, all these facts are positively valued by investors in the German and British stock markets.
In contrast, investors in the Swedish stock market negatively value these practices. In this sense, we must con-sider the cost-concern explanation provided by Hassel et al. (2005) as well as the concon-siderations of Tagesson et al. (2009), who determine that Swedish CSR public policy should be subtler and adapted to cultural norms to reduce the gap between Swedish private companies and state-owned corporations in which there exists a higher tradition for transparency in terms of CSR information.
Before drawing some overall conclusions, we present in Tables 5 and 6 the results of the regression model
ap-plied to each European market in the sub-periods 2011–2007 and 2008–2013 respectively, to provide evidence in
two different economic states.
As we can see in Table 5, in the period prior to 2008 the coefficient associated with the GRI variable is positive at
a 1% significance level in the German and Spanish stock markets while for the remaining European markets the
results are not statistically significant. However, Table 6 shows that the coefficient associated with the GRI variable
is positive only in the Italian market, at a 10% significance level, and is negative on the stock markets of the
Netherlands and Sweden, with a 10% and 1% level, respectively, obtaining non-significant results for the remainder
markets. These overall results indicate not only that there was a change in the behaviour of investors in each market in terms of CSR disclosure considerations, but also that stock markets did not react to this fact in the same way.
Finally, thesefindings reveal some implications in the European setting to reduce differences among countries
and economic states. In this sense, we agree with Steurer et al. (2012) who indicate that the spread and harmonisation of CSR disclosure across Europe depends not only on political leadership and respective public pol-icies on CSR but also on societal learning. Thus, there should be joint efforts by national governments, international organisations, and listed companies to commit to sustainability to gain in quality, visibility, and credibility for the investment community.
Denmark Finland France Ger many Italy Nethe rlands Norway Spain Sweden United Kingdom Intercept 4.486 0.790* 15.388*** 3.669 *** 2.4 11*** 8.400*** 2.890*** 5.079*** 3.813*** 1.341*** (0.21) (0.10) (0.00) (0.00) (0.00) (0.00) (0.01) (0.00) (0.00) (0.00) Book value 1.1 07*** 0.825*** 0.421*** 1.058 *** 0.847*** 0.755*** 0.611*** 0.593*** 0.593*** 0.849*** (0.00) (0.00) (0.00) (0.00) (0.00) (0.00) (0.00) (0.00) (0.00) (0.00) Earnings 0.727 3.460 *** 1.821** 1.290*** 2.261*** 1.915*** 1.655*** 2.208*** 3.390*** 4.433*** (0.21) (0.00) (0.00) (0.00) (0.00) (0.00) (0.00) (0.00) (0.00) (0.00) GRI reports -4.369 0.299 1.605 3.304 *** 0.840 0.773 -0.313 1.014 -2.276*** 0.624* GRI (0.29) (0.46) (0.37) (0.00) (0.17) (0.6 6) (0.73) (0.26) (0.00) (0.06) Adj. R 2 0.553 0.500 0.800 0.872 0.799 0.772 0.494 0.388 0.602 0.825 F-test 23.613*** 83.20 1*** 46.239*** 73.179*** 39.894*** 36.242*** 23.264*** 38.445*** 63.060*** 51.97 5*** (0.00) (0.00) (0.00) (0.00) (0.00) (0.00) (0.00) (0.00) (0.00) (0.00) Hau sman test 0.000 0.000 137.644*** 50.200*** 56.503*** 22.975* 0.000 0.000 0.000 32.387*** (1.00) (1.00) (0.00) (0.00) (0.00) (0.08) (1.00) (1.00) (1.00) (0.00) No. obs. 275 1,234 4,713 3,960 1,227 1,005 343 884 614 4,491 Table 4. Empirical results for each European market over the 2001 –2013 period This table shows the results of the Ohlson (1995) valuation model for each European market over the 2001 –20 13 period. The explanatory variables are the book value and earning per share as well as a dummy variable that takes the value 1 if a company is included in the GRI list in the respective year, and zero otherwise. The values of the adjusted R 2 and F statistics as well as the Hausman test and their respective p-value are presented in the table, as well as the number of observations. *** , * * and *represent signi ficance levels of 1%, 5% and 10%, respectively.
Denmark Finland France Germany Italy Netherlands Norway Spain Sweden United Kingdom Intercept -0.75 6 0.211 9.366*** -0.463 3.124*** 15.976*** 2.317** 2.722*** 2.954*** 1.417*** (0.85) (0.71) (0.00) (0.63) (0.00) (0.00) (0.03) (0.00) (0.00) (0.00) Book value 1.742*** 0.980* ** 0.700*** 1.341*** 0.891*** 0.265*** 0.633** * 1.339*** 0.740*** 0.748*** (0.00) (0.00) (0.00) (0.00) (0.00) (0.00) (0.00) (0.00) (0.00) (0.00) Earnings 0.011 2.928*** 2.096*** 1.732*** 0.269 1.177*** 3.571*** 0.012 3.967*** 4.964*** (0.99) (0.00) (0.00) (0.00) (0.25) (0.00) (0.00) (0.95) (0.00) (0.00) GRI reports -3.779 0.964 -3.397 6.377*** 0.415 -3.762 -1.287 5.497*** -0.836 0.693 GRI (0.61) (0.24) (0.24) (0.00) (0.59) (0.24) (0.26) (0.00) (0.32) (0.14) Adj. R 2 0.621 0.552 0.864 0.863 0.903 0.848 0.636 0.877 0.605 0.487 F-test 26.679*** 86.999*** 40.298*** 38.922*** 50.68 3*** 34.869*** 31.771*** 41.201*** 54.123*** 234.779*** (0.00) (0.00) (0.00) (0.00) (0.00) (0.00) (0.00) (0.00) (0.00) (0.00) Hau sman test 0.000 49.170*** 201.216*** 23.686*** 25.1 96*** 102.938*** 0.000 52.844*** 13.999 10.592 (1.00) (0.00) (0.00) (0.00) (0.00) (0.00) (1.00) (0.00) (0.12) (0.3 0) No. obs. 142 628 2,394 1,997 587 526 159 433 313 2,210 Table 5. Empirical results for each European market over the 2001 –2007 period This table shows the results of the Ohlson (1995) valuation model for each European market over the 2001 –2007 period. The explanatory variables are the book value and earning per share as well as a dummy variable that takes the value 1 if a company is included in the GRI list in the respective year, and zero otherwise. The values of the adjusted R 2 and F statistics as well as the Hausman test and their respective p-value are presented in the table, as well as the number of observations. *** , * * and *represent signi ficance levels of 1%, 5% and 10%, respectively.
Denmark Finland France Germany Italy Netherlands Norw ay Spain Sweden United Kingdom Intercept 3.695 -1.781** 7.624*** 2.234** * 1.010** 1.921 0.576 2.893*** 1.974** 0.755* ** (0.29) (0.04) (0.00) (0.01) (0.04 ) (0.13) (0.62) (0.01) (0.02) (0.00) Book value 1.028*** 1.322*** 0.481** * 0.969*** 0.538*** 0.698*** 0.819*** 0.617*** 0.533*** 0.469*** (0.00) (0.00) (0.00) (0.00) (0.00) (0.00) (0.00) (0.00) (0.00) (0.00) Earnings 0.972 1.266*** 0.750*** 0.611*** 1.271*** 1.150*** -0.285 2.426*** 2.255*** 4.545*** (0.11) (0.00) (0.00) (0.00) (0.00) (0.00) (0.54) (0.00) (0.00) (0.00) GRI reports -6.276 -0.419 2.594 2.364 1.731* -2.754* -0.072 0.517 -2.146*** -0.756* GRI (0.12) (0.49) (0.22) (0.13) (0.09) (0.07) (0.95) (0.63) (0.00) (0.10) Adj. R 2 0.555 0.842 0.870 0.928 0.835 0.911 0.482 0.372 0.562 0.875 F-test 21.607*** 30.453*** 39.487*** 72.110*** 28. 367*** 56.301*** 22.315*** 34.357*** 49.296*** 40.368*** (0.00) (0.00) (0.00) (0.00) (0.00) (0.00) (0.00) (0.00) (0.00) (0.00) Hau sman test 0.000 99.5 19*** 80.572*** 93.467*** 53.802*** 15.949** 0.000 0.000 0.000 69.202*** (1.00) (0.00) (0.00) (0.00) (0.00) (0.04) (1.00) (1.00) (1.00) (0.00) No. obs. 133 606 2,319 1,963 640 479 184 451 301 2,281 Table 6. Empir ical results for each Europe an market over the 2008 –2013 period This table shows the results of the Ohlson (1995) valuation model for each European market over the 2008 –2013 period. The explanatory variables are the book value and earning per share as well as a dummy variable that takes the value 1 if a company is included in the GRI list in the respective year, and zero otherwise. The values of the adjusted R 2 and F statistics as well as the Hausman test and their respective p-value are presented in the table, as well as the number of observations *** , * * and *represent signi ficance levels of 1%, 5% and 10%, respectively.
Conclusions
The investment in socially responsible companies has grown substantially worldwide and especially in Europe in the last decades. In this context, and under the influence of the economic policies defined by the European Commission over these years, as well as the policies and legislation of each European country, many companies quoted on Euro-pean stock markets consider it advantageous to publish sustainability reports, thus providing that information to
theirfinancial stakeholders. Meanwhile, analysts and investors usually request a broadly applicable and reliable
set of standards for comparison across companies. In this sense, the GRI criteria are the standards most widely used by companies to provide high-quality CSR information which can be value relevant for investors.
In this context, the aim of this study has been to analyse whether investors in the European stock market of Denmark, Finland, France, Germany, Italy, the Netherlands, Norway, Spain, Sweden, and the UK value the CSR in-formation published by listed companies in compliance with the GRI standards over the 2001–2013 period,
consid-ering the peculiarities of each market and the impact of the globalfinancial crisis.
The results from thefirm valuation analysis reveal that, although European investors as a whole value this type of
information in the total information set used for their investment decision making, there exists several differences across markets and between expansion and recession stages. More precisely, we document that only investors in the German and UK markets value CSR reports positively and significantly, whereas investors in the remainder markets
do not appear tofind that CSR disclosure provides incremental value to their valuations of the firms, except in the
case of the Swedish market in which we observe a negative influence on the share value of firms that disclose CSR reports. Meanwhile, we observe that the valuation of CSR disclosure by investors change substantially in each
mar-ket before and after the globalfinancial crisis.
Thesefindings have important implications for managers, shareholders, and policymakers if they want to reduce
these differences. On the one hand, companies should provide higher-quality sustainability reports as well as make greater strides to increase sustainability-related communication and direct engagement with the investment com-munity. On the other hand, investors should request companies for improved sustainability performance and har-monization in directing this information to the investment community. Finally, policymakers also have a relevant
role in thisfield. To continue the spread and harmonisation of CSR disclosure across Europe, there should be joint
efforts by national governments to encourage sustainability and develop common and robust public policies which contribute to reducing differences among them.
Further research should focus on addressing cultural and national differences across Europe related to CSR dis-closure at specific sectors. It should be particularly interesting to analyse the energy and banking sectors in which GRI has turned into a global reference and where its adoption rate is growing every year.
References
Albareda L, Lozano J, Tencati A, Midttun A, Perrini F. 2008. The changing role of governments in corporate social responsibility: drivers and responses. Business Ethics: A European Review17(4): 347–363.
Alonso-Almeida MM, Llach J, Marimon F. 2014. A closer look at the Global Reporting Initiative Sustainability Reporting as a tool to implement environmental and social policies: A worldwide sector analysis. Corporate Social Responsibility and Environmental Management21(6): 318–335. Barth ME, Clinch G. 2009. Scale effects in capital markets-based accounting research. Journal of Business Finance & Accounting36(3&4): 253–288. Baumgartner RJ. 2014. Managing corporate sustainability and CSR: a conceptual framework combining values, strategies and instruments
con-tributing to sustainable development. Corporate Social Responsibility and Environmental Management21(5): 258–271.
Beare D, Buslovich R, Searcy C. 2014. Linkages between corporate sustainability reporting and public policy. Corporate Social Responsibility and Environmental Management21(6): 336–350.
Beier J. 2012. CSR‘made in Germany’: Are voluntary standards enough? Business for Social Responsibility Report.
Berthelot S, Coulmont M, Serret V. 2012. Do Investors value sustainability reports? A Canadian study. Corporate Social Responsibility and Environ-mental Management19(6): 355–363.
Boletín Oficial del Estado (BOE). 2002. Instituto de Contabilidad y Auditoria de Cuentas 81: 12831–12834.
Bowerman S, Sharman U. 2016. The effect of corporate social responsibility disclosures on share prices in Japan and the UK. Corporate Ownership and Control13(2): 202–216.
Brammer S, Pavelin S. 2008. Factors influencing the quality of corporate environmental disclosure. Business Strategy and the Environment 17(2): 120–136.
Brown HS, de Jong M, Levy DL. 2009. Building institutions based on information disclosure: lessons from GRI’s sustainability reporting. Journal of Cleaner Production17(6): 571–580.
Brown J, Fraser M. 2006. Approaches and perspectives in social and environmental accounting: An overview of the conceptual landscape. Busi-ness Strategy and the Environment15(2): 103–117.
Cardamone P, Carnevale C, Giunta F. 2012. The value relevance of social reporting: evidence from listed Italian companies. Journal of Applied Accounting Research13(3): 255–269.
Carnevale C, Mazzuca M. 2014. Sustainability report and bank valuation: evidence from European stock markets. Business Ethics: A European Review23(1): 69–90.
Carnevale C, Mazzuca M, Venturini S. 2012. Corporate social reporting in European banks: The effects on afirm’s market value. Corporate Social Responsibility and Environmental Management19(3): 159–177.
Collison D, Lorraine N, Power D. 2003. An exploration of corporate attitudes to the significance of environmental information for stakeholders. Corporate Social Responsibility and Environmental Management10(4): 199–211.
Cormier D, Magnan M. 2007. The revisited contribution of environmental reporting to investors’ valuation of a firm’s earnings: An international perspective. Ecological Economics62(3&4): 618–626.
Curto J, Morais A, Lourenço I, Pinto J. 2011. The heteroscedasticity-consistent covariance estimator in accounting. Review of Quantitative Finance and Accounting37: 427–428.
Danish government. 2008. The Government’s Action Plan for Corporate Social Responsibility. Copenhagen.
De Klerk M, De Villiers C. 2012. The value relevance of corporate responsibility reporting: South African evidence. Meditari Accountancy Research 20(1): 21–38.
De Klerk M, De Villiers C, Van Staden C. 2015. The influence of corporate social responsibility disclosure on share prices. Evidence from the United Kingdom. Pacific Accounting Review 27(2): 208–228.
De Villiers C, Van Staden C. 2010. Shareholders’ requirements for corporate environmental disclosures: a cross country comparison. The British Accounting Review42(4): 227–240.
De Villiers C, Van Staden C. 2012. New Zeland shareholder attitudes towards corporate environmental disclosure. Pacific Accounting Review 24(2): 186–210.
Dobele AR, Westberg K, Steel M, Flowers K. 2014. An examination of corporate social responsibility implementation and stakeholder engage-ment: A case study in the Australian mining industry. Business Strategy and the Environment23(3): 145–159.
European Commission. 2001. Green Paper. Promoting a European framework for corporate social responsibility. www.i-csr.org/repository/ ECcom2001_0366en01.pdf [13 July 2015].
European Commission. 2011. Comunication from the commission to the European Parliament, the Council, the European Economic and Social Committee and the Committee of the Regions. A renewed EU strategy 2011-14 for Corporate Social Responsibility. http://www.europarl.eu-ropa.eu/meetdocs/2009_2014/documents/com/com_com(2011)0681_/com_com(2011)0681_en.pdf
Fernández-Feijoo B, Romero S, Ruiz S. 2014. Commitment to corporate social responsibility measured through global reporting initiative reporting: factors affecting the behavior of companies. Journal of Cleaner Production81: 244–254.
Frias-Aceituno JV, Rodriguez-Ariza L, Garcia-Sanchez I. 2014. Explanatory factors of integrated sustainability andfinancial reporting. Business Strategy and the Environment23(1): 56–72.
Galani D, Gravas E, Stavropoulos A. 2012. Company characteristics and environmental policy. Business Strategy and the Environment21(4): 236–247.
Garcia-Sanchez I. 2008. Corporate social reporting: Segmentation and characterization of Spanish companies. Corporate Social Responsibility and Environmental Management15(4): 187–198.
Haddock-Fraser J, Fraser I. 2008. Assessing corporate environmental reporting motivation: Differences between‘Close-to-Market’ and ‘Business-to-Business’ companies. Corporate Social Responsibility and Environmental Management 15(3): 140–155.
Hassel L, Nilsson H, Nyquist S. 2005. The value relevance of environmental performance. The European Accounting Review14(1): 41–61. Healy PM, Palepu KG. 2001. Information asymmetry, corporate disclosure, and the capital markets: a review of the empirical disclosure
litera-ture. Journal of Accounting and Economics31(3): 405–440.
Jackson G, Apostolakou A. 2010. Corporate social responsibility in Western Europe: an institutional mirror or substitute. Journal of Business Ethics 94(3): 371–394.
Jones S, Frost G, Loftus J, Van Der Laan S. 2007. An empirical examination of the market returns andfinancial performance of entities engaged in sustainability reporting. Australian Accounting Review17(1): 17–87.
Kaspereit T, Lopatta K. 2016. The value relevance of SAM’s corporate sustainability ranking and GRI sustainability reporting in the European stock markets. Business Ethics: A European Review25(1): 1–24.
Kolk A. 2003. Trends in sustainability reporting by the fortune global 250. Business Strategy and the Environment12(5): 279–291.
Kolk A. 2008. Sustainability, accountability, and corporate governance: Exploring multinationals’ reporting practices. Business Strategy and the Environment17(1): 1–15.
Levy DL, Brown HS, de Jong M. 2010. The contested politics of corporate governance: the case of the Global Reporting Initiative. Business & Society49(1): 88–115.
Lourenço I, Callen J, Branco M, Curto J. 2014. The value relevance of reputation for sustainability leadership. Journal of Business Ethics119: 17–28. Lourenço I, Callen J, Branco M, Curto J, Eugenio T. 2012. How does the market value corporate sustainability performance? Journal of Business
Ethics108: 417–428.
Lozano R. 2015. A holistic perspective on corporate sustainability drivers. Corporate Social Responsibility and Environmental Management22(1): 32–44.
Marimon F, Alonso-Almeida MM, Rodriguez MP, Cortez CA. 2012. The worldwide diffusion of the global reporting initiative: what is the point? Journal of Cleaner Production33: 132–144.
Martínez-Ferrero J, García-Sánchez IM, Cuadrado-Ballesteros B. 2015. Effect offinancial reporting quality on sustainability information disclo-sure. Corporate Social Responsibility and Environmental Management22(1): 45–64.
McMurtrie T. 2005. Factors influencing the publication of social performance information an Australian case study. Corporate Social Responsibility and Environmental Management12(3): 129–143.
Mio C. 2010. Corporate social reporting in Italian multi-utility companies: An empirical analysis. Corporate Social Responsibility and Environmental Management17(5): 247–271.
Miras-Rodriguez MM, Carrasco-Gallego A, Escobar-Perez B. 2015. Are socially responsible behaviors paid off equally? A cross-cultural analysis. Corporate Social Responsibility and Environmental Management22(4): 237–256.
Moneva JM, Cuellar B. 2009. The value relevance offinancial and non-financial environmental reporting. Environmental and Resource Economics 44(3): 441–456.
Murray A, Sinclair D, Power D, Gray R. 2006. Dofinancial markets care about social and environmental disclosure? Further evidence and explo-ration from the UK. Accounting, Auditing & Accountability Journal19(2): 228–255.
Ohlson JA. 1995. Earnings, book values and dividends in equity valuation. Contemporary Accounting Research11(2): 661–686.
Ohlson JA. 2001. Earnings, book values and dividends in equity valuation. An empirical perspective Contemporary Accounting Research18(1): 107–120.
Perez-Lopez D, Moreno-Romero A. 2015. Exploring the relationship between sustainability reporting and corporate social responsibility imple-mentation. Business Strategy and the Environment24(8): 720–734.
Prado-Lorenzo JM, Gallego-Alvarez I, Garcia-Sanchez IM. 2009. Stakeholders engagement and corporate social responsibility: The ownership structure effect. Corporate Social Responsibility and Environmental Management16(2): 94–107.
Rasche A. 2009. Toward a model to compare and analyze accountability standards–the case of the UN global compact. Corporate Social Respon-sibility and Environmental Management16: 192–205.
Roca LC, Searcy C. 2012. An analysis of indicators disclosed in corporate sustainability reports. Journal of Cleaner Production20: 103–108. Romolini A, Fissi S, Gori E. 2014. Scoring CSR reporting in listed companies– Evidence from Italian best practices. Corporate Social Responsibility
and Environmental Management21(2): 65–81.
Schadewitz H, Niskala M. 2010. Communication via responsibility reporting and its effect onfirm value in. Finland Corporate Social Responsibility and Environmental Management17(2): 96–106.
Secchi D. 2006. The Italian experience in social reporting: An empirical analysis. Corporate Social Responsibility and Environmental Management 13(3): 135–149.
Sierra L, Zorio A, Garcia-Benau M. 2013. Sustainable development and assurance of corporate social responsibility reports published by Ibex-35 companies. Corporate Social Responsibility and Environmental Management20(6): 359–370.
Skouloudis A, Evangelinos K, Kourmousis F. 2009. Development of an evaluation methodology for triple bottom line reports using international standards on reporting. Environmental Management44: 298–311.
Spence C. 2009. Social and environmental reporting and the corporate ego. Business Strategy and the Environment18(4): 254–265.
Steurer R, Martinuzzi A, Margula S. 2012. Public policies on CSR in Europe: Themes, instruments, and regional differences. Corporate Social Responsibility and Environmental Management19(4): 206–227.
Tagesson T, Blank V, Broberg P, Collin SO. 2009. What explains the extent and content of social and environmental disclosures on corporate websites: A study of social and environmental reporting in Swedish listed corporations. Corporate Social Responsibility and Environmental Management16(6): 352–364.
Tsang S, Welford R, Brown M. 2009. Reporting on community investment. Corporate Social Responsibility and Environmental Management16(3): 123–136.
UK government. 2006. Companies Act. 2006. www.legislation.gov.uk/ukpga/2006/46/section/417 [13 July 2015].
Wahba H. 2008. Does the market value corporate environmental responsibility? An empirical examination. Corporate Social Responsibility and En-vironmental Management15(2): 89–99.