MODELLING TECHNIQUES
Khadija Temidayo Kelani
Comparison between BPMN2.0 and IDEF (0&3)
Dissertation presented as partial requirement for obtaining
the Master’s degree in Information Management
LOMBADA MGI
2018 Title:
Modelling Techniques
Subtitle:
Comparison between BPMN2.0 and IDEF
Student
NOVA Information Management School Instituto Superior de Estatística e Gestão de Informação Universidade Nova de Lisboa
MODELLING TECHNIQUES
by Khadija Temidayo Kelani Dissertation presented as partial requirement for obtaining the Master’s degree in Information Management, with a specialization in Information Systems and Technologies Management Advisor: Vitor Santos February,2018i
DEDICATION
To my Parent, Sisters and my Man for their unconditional love and moral supportii
ACKNOWLEDGEMENT
I am thankful to Almighty Allah for seeing this through for me. I would like to use this opportunity to thank all that supported me through my studies. My advisor Professor Vitor Santos for his relentless effort towards completion of my master’s thesis. His continuous ideas, motivation and guidance were mostly helpful.
To my man who stood by me, encouraged and pushed me beyond my limit in achieving my goal, I am really grateful.
Lastly, my loving and adorable parent, I really appreciate your love and support. Your constant word of encouragements served as my moral compass. I am proud to be your daughter and I am really grateful for your relentless effort towards me achieving my goals and dream.
iii
ABSTRACT
Understanding the full concepts of modelling techniques is what organizations lack these days which sometimes affects their decision in terms of choosing the tools to model and implement their processes. This, however, is a challenge as organisations tend to choose tools based on current trend or what their competitors used to achieve profit. Other researchers have done similar analysis comparing multiple modelling languages to identify the strength and weakness of each of the languages and to enlighten the users.
This study analysed both BPMN2.0 and IDEF (IDEF0 and IDEF3) and built a comparative matrix showing the strengths and weakness of each technique. Design Science Research (DSR) was used for the methodology that involved carrying out surveys and drafting questionnaires. The results gotten from the survey was used to validate the matrix thereby suggesting recommendations with the hope of being useful to both academia and professionals. In doing so first, there was the need to establish an understanding of each tool which incorporates the framework and breakdown structure.
KEYWORDS
Business Process Management; BPMN; IDEF0; IDEF3; Modelling Techniquesiv
TO BE SUBMITTED RESULTS FROM THIS THESIS
v
INDEX
1. Introduction ... 1 1.1. Background of the study ... 1 1.2. Motivation & Justification ... 2 1.3. Study Objectives ... 3 2. Literature review ... 4 2.1. Modelling Techniques ... 5 2.1.1. IDEF Language ... 5 2.1.2. BPMN2.0 ... 10 3. Methodology ... 14 3.1. Design Science Research ... 14 3.2. Strategy of the Research ... 15 4. Proposal of the Framework ... 16 4.1. The Framework ... 16 4.2. Validation ... 16 4.2.1. Survey ... 16 4.3. Data Analysis ... 16 4.3.1. Background of respondents ... 16 4.3.2. Usability ... 17 4.3.3. Representation ... 17 4.3.4. Communication and Alignment ... 17 4.3.5. Readability ... 18 4.3.6. Creativity ... 18 5. Discussion ... 20 6. Conclusion ... 21 6.1. Summary Of the work and Findings ... 21 6.2. Limitations of the Research ... 21 6.3. Future Work ... 21 7. Bibliography ... 22 Annex ... 24 Annex 1: Occurrence Frequency of BPMN Constructs ... 24 Annex 2: Comparative Matrix ... 25 Annex 3: Survey Questions and answers(average) ... 26 Annex 4: Proposed Comparative Matrix ... 27vi
INDEX OF FIGURES
Figure 2.1: Types of IDEF methods (Šerifi, Dašić, Ječmenica, & Labović, 2009) ... 6 Figure 2.2: Basic IDEF0 context diagram (IBM, 2008) ... 7 Figure 2.3: Flow of arrows with the box (Menzel & Mayer, 1998) ... 8 Figure 2.4: Join and Fork Arrow (Menzel & Mayer, 1998) ... 9 Figure 2.5: Building blocks of an IDEF3 process (Menzel & Mayer, 1998) ... 10 Figure 2.6: A typical IDEF3 process (CS Odessa Corp, 2018) ... 10 Figure 2.7: Summary of BPMN Notations (Chinosi & Trombetta, 2012) ... 11 Figure 3.1: Design Science Research Cycle (Vaishnavi & Kuechler, 2004) ... 14 Figure 4.1: Types of Organizations ... 17vii
INDEX OF TABLES
Table 2.1: Different Arrows and the functions ... 8 Table 2.2: BPMN2.0 elements and the functions (Genon, Heymans, & Amyot, 2010) ... 12 Table 4.1: Summary of results gotten ... 18viii
LIST OF ACRONYMS AND ABBREVIATIONS
BPM Business Process Management BPMN2.0 Business Process Modelling and Notation BPMS Business Process Management System DFD Dataflow Diagram DSR Design Science Research EPC Event-driven Process Chain ICAM Integrated Computer Aided Manufacturing ICOMs Input, Control Output and Mechanism IDEF Integration Definition OMG Object Management Group RAD Rapid Application Development model UML Unified Modelling Language1
1. INTRODUCTION
According to (Mojdeh, 2005), Business Process Management is a series of processes and applications designed to optimize the execution of business strategy. Business Process Management (BPM) serves as a bridge between information systems and businesses which helps in facilitating good communication, collaboration with internal and external entities and improves efficiency in an organization. However, many organizations sometimes think they have full knowledge or they have implemented the full use of BPM without knowing there is more to it, this sometimes prevents them from achieving their goals. In past years, organizations have used business process tools in automating their processes thereby making their work efficient and generating value in the long run. These tools have evolved as time went by a new modelling language/tools emerged. Examples of modelling languages include Unified Modelling Language (UML), Data flow diagram (DFD), Business Process Modelling Notation (BPMN), Integration Definition (IDEF), Event-driven Process Chain (EPC) etc. (Mojdeh, 2005) identified four Business process management framework steps namely: Strategize, Plan (these two defines what to be done); Monitor, Act and adjust
(which defines how it should be done).
Modelling tools can be classified according to the volume and nature of information to be captured. This has a direct correlation on the form and depth of performance analysis carried out (ABPMP_CBOK_Guide_English, 2013). For the purpose of this research, BPMN 2.0 and IDEF (IDEF0 and IDEF3) will be analysed to determine the strength and weakness of both modelling techniques which can be a source of knowledge for professionals (organizations) and academia. 1.1. BACKGROUND OF THE STUDY
Over the years, modelling techniques evolved as new areas were explored for the sole purpose of making sure organizations can maximize the use of these techniques in achieving their objectives. According to (Mojdeh, 2005), executives have been able to identify, communicate and monitor the key drivers that generate business value with the help of business process tools. Hence, this made things easy for them.
Organizations often choose modelling tools based on popularity or what their competitor implemented. However, they neither have a full knowledge of the modelling tool nor are they able to select the one that best suits their business process. This has proven to be costly to organizations not only financially, but there is an almost equal loss of man-hours used in the implementation of the unsuitable technique and other associated costs (like less productivity, low productivity etc.). For this study, IDEF0, IDEF3, and BPMN2.0 were analysed side by side. These three modelling tools were chosen because IDEF tools were the first set
2
of modelling tools to be developed by the US air force and most of the present tools including BPMN2.0 were adapted from it. The analysis is to identify what changed and why there has been a shift towards the use of BPMN2.0 in recent times. These tools will be briefly discussed in the next chapter.
1.2. MOTIVATION & JUSTIFICATION
The objective of this research is to analyse and understand why BPMN2.0 is given much concern and priority in terms of using modelling language over other tools like IDEF0 and IDEF3 among others. The three modelling tools were analysed side by side to identify their strength and weakness.
Past research shows that each modelling technique can be used depending on the complexity of the process and the robustness of the technique. However, considering IDEF was the first modelling technique first implemented and other techniques were based on IDEF concept, it calls for re-evaluation with the most recent technique, BPMN2.0. Previous analysis done by several authors such as (Pawlewski & Hoffa, 2014) were done with other modelling techniques. However, this study aims to focus solely on just IDEF0 & 3 and BPMN2.0. This gives an opportunity to do a deep dive analysis that focuses on answering the following questions: 1. Does BPMN2.0 implement organizations business processes the way they like? 2. Do organizations use the full function of the modelling tool implemented? 3. How well does it help improve their business? However, the result of this comparison can be used by academia and professionals to:
1. Have a better and wider knowledge of the modelling tools before implementing/executing; 2. Minimize cost, time and resources used; 3. Better understand the tools framework.
3 1.3. STUDY OBJECTIVES Main Goal The main goal of this research is to analyse and compare the two main Modelling techniques; BPMN 2.0 and IDEF language Specific Objectives
1. Describe the management framework of business process management that encompasses BPMN2.0 and IDEF; 2. Make a comparative analysis of both tools; 3. Develop the assessment method for evaluating the strength and weakness of both techniques; 4. Choose the selection criteria for the improvement measures; 5. Identify the constraints, key measures and make possible recommendations if possible.
4
2. LITERATURE REVIEW
Various analysis has been done in the past on different modelling tools giving different views and insights. (Pawlewski & Hoffa, 2014) did a study by comparing two modelling techniques (UML and IDEF0) with results indicating that IDEF0 emerged as the best. IDEF0 was chosen because of its user capabilities in terms of constructing and comprehending a model, even though, UML was recognized for software development by IT specialist in designing IT systems, IDEF0 was still chosen as the best.IDEF0 comprises of four main activities which are Input, Output, Control and mechanism (Pawlewski & Hoffa, 2014). Unlike IDEF0, BPMN 2.0 has over 100 construct attributes which are grouped into four elements such as; Flow objects, Connecting objects, Swimlanes and
Artefacts(Zur Muehlen & Recker, 2008). It was also noted that not all of the constructs are
used only those important to the business analyst.
According to (Object Management Group (OMG), 2011), BPMN2.0 primary goal is to provide a notation that is easy to understand to all users including the business analysts, technical users, and end users as well. It serves as a means of communicating with both internal entities (business users and process implementers) and external entities (customers and suppliers).
An analysis done by (Negi, Bansal, & Kanpur, 2009) in an attempt to identify a modelling technique (IDEF0, IDEF3, DFD, RAD, Activity Diagram, EPC and BPMN) that is most suitable for integration and automation of ERP systems showed that BPMN and EPC was able to capture the four Process perspectives; Functional, Behavioural, Organizational and
Informational perspectives. However, IDEF0 captured Functional perspectives but was not
able to do so with Behavioural (IDEF3 was also able to capture this although with limitations). Organizational and Informational process perspective has limitations for IDEF0 while it was not available for IDEF3. This, however, did not allow IDEF0 and IDEF3 to be considered as a suitable technique to be used for analysis. However, (Costin & Fox, 2004) in a study also stated that IDEF0 was used for producing a function model of a new or existing system and IDEF3 is a technique for producing a dynamic model of the system. Hence, the combination of both techniques brings a complementary feature to business process modelling. They also proposed that the hybrid of both IDEF0 and IDEF3 is more modular by grouping the joins and splits of activities in the form of input and output trees of connectors which has more advantage over standard workflow models. Furthermore, a study done by (Cheng-Leong, Li Pheng, & Keng Leng, 1999) on manufacturing enterprise system chose IDEF0 for its functionalities which happen to be superior to many other functional modelling methodologies in terms of simple graphics, conciseness, rigor, and precision with the level of abstraction and separation within an organization. Although, IDEF3 was later introduced to complement IDEF0 in terms of describing the process business
5 flow and as well describe the functionalities. It was later concluded that the use of IDEF0 and IDEF3 is useful in terms of integration and time reduction. Thus, it could confirm and support the development of the enterprise system. Nevertheless, despite the graphical notation of BPMN2.0 it has been seen not to be enough to properly model choreographies1 but only internal processes. Although BPMN2.0 gives the
possibility of representing a business process with different perspectives like individual process or the choreography view (Cortes-Cornax, Dupuy-Chessa, Rieu, & Mandran, 2016). Additionally, (ABPMP_CBOK_Guide_English, 2013) highlighted the disadvantages of BPMN2.0 and IDEF language which are summarized below:
Disadvantages of BPMN include:
▪ Training and experience is required to fully utilize the full set of symbols correctly ▪ It is difficult to see relationships among multiple levels of a process Disadvantages of IDEF language include: ▪ Implementations are often visually unappealing ▪ The notation consists mainly of boxes and arrows which appear cluttered and busy. Although there are advantages to both tools which includes: ▪ IDEF has a precise expression, it is easy to use and follow logical decomposition of model levels. It can be used for any level of activity modelling.
▪ BPMN2.0 has a widespread use and understanding which is used to identify process constraints.
2.1. MODELLING TECHNIQUES 2.1.1. IDEF Language
Integration definition (IDEF) suite was developed by the US Airforce in 1970 for their Integrated Computer Aided Manufacturing (ICAM) program with the sole purpose of increasing manufacturing program with the help of computer technology (Menzel & Mayer, 1998). According to (Kim, Weston, Hodgson, & Lee, 2003), IDEF modelling notations were designed to model entities in an enterprise in order to have a useful abstract picture of the different views (function viewpoint and information viewpoint). They went further to state that the main purpose was to have different views of the IT system requirement. The next section will discuss IDEF0 and IDEF3 as they are more relevant to BPMN2.0 in terms of process modelling. Figure 2.1 is a list of IDEF types and their brief description. Each one
1 Choreography (Cortes-Cornax et al., 2016) defined it as the overall depiction of interactions between various
organizational units that are involved in a common business process. It provides a simple understanding, analysis and optimizing cross-organizational business processes.
6
focuses on an aspect of modelling, that is, each captures an aspect of an organization differently. Figure 2.1: Types of IDEF methods (Šerifi, Dašić, Ječmenica, & Labović, 2009) 2.1.1.1. IDEF0 (Waissi, Demir, Humble, & Lev, 2015) defined IDEF0 as a graphic description of a system that is developed for a specific purpose and from a selected viewpoint. (Pawlewski & Hoffa, 2014) also defined IDEF0 as a detailed graphical representation of the hierarchical structure of a system that shows the relationship between all the functional elements in a system. It is used in showing high-level activities (such as; input, control, output, and mechanism) which can be further broken down into lower levels although it may require “branch control” (Aguilar-Savén, 2004). Originally referred to as System Analysis and Design Technique (SADT), IDEF0 uses boxes, arrows, and text to communicate the procedure for carrying out a process. Figure 1.2 shows a snapshot of a basic IDEF0 context diagram of a purchase order with the syntax showing how the activities of an organization are modelled.
7 Figure 2.2: Basic IDEF0 context diagram (IBM, 2008) 2.1.1.2. How IDEF0 works It’s a graphical representation which has two constructs namely: boxes and arrows. (Menzel & Mayer, 1998) further described how the process works; which includes taking in certain inputs by a means of some mechanism that is controlled in some form which then produces an output by transforming the input. It is represented by connecting the arrowhead specifically to the bottom, left side or top of the box. Likewise, the tail of the arrow can only be connected to the right side of the box or to the head of another arrow segment as shown in Figure 2.3.
8
Figure 2.3: Flow of arrows with the box (Menzel & Mayer, 1998)
However, (Waissi et al., 2015) highlighted the different arrows and functions which are summarized in Table 2.1. Table 2.1: Different Arrows and the functions Furthermore, IDEF0 also consists of Joins and Fork. According to (Menzel & Mayer, 1998), a join demonstrates the recognition of a single ICOM which comes from different sources which are used to merge ICOMs together while a fork is used to decompose or split a join as Types of Arrow Functions Control Arrow Conditions, rules, and constraints levied on a function which includes external factors like competition, policies, culture, laws, and regulation etc. Mechanism Arrow It defines means and resources (e.g. workforce, finance, infrastructure, machines and equipment) used to perform a function. Call Arrow It is used in sharing and linking details within models Input and Output Arrow
The input arrow takes in data to be processed and passed to the output arrow.
9 shown in Figure 2.4. However, arrows originating at one box and ending at another show the resource connection between the indicated functions. Figure 2.4: Join and Fork Arrow (Menzel & Mayer, 1998) 2.1.1.3. IDEF 3 Unlike IDEF0 which focuses on how the activities of an organization are defined and how the inputs, controls, and mechanisms such as products and resources are used in generating outputs, IDEF3 is a general-purpose language used to model enterprise processes where time and the sequence of events are important. That is, an IDEF3 process places less focus on products and resources, rather emphasizing more on the general role of objects in a situation. These are expressed as object-state components used for modelling how objects undergo a change in a process (Menzel & Mayer, 1998). Simply put, it is a way of describing the time-based behaviour of systems and provides means of representing sequence (Kim, Weston, Hodgson, & Lee, 2003).
There are two types of diagrams in the IDEF3 standard. The first type of diagram is Process Flow Description Diagrams (PFDD), while the second type is called Object State Transition Network (OSTN) diagrams. The building block of an IDEF3 process includes rectangular boxes called Units of Behaviour (UOB) which carry names and unique numeric identifiers, arrows (links) which denotes the direction of flow of process execution and junctions which signify logical constraints imposed on the process. Figure 2.5 shows the units required for an IDEF3 process and Figure 2.6 shows an IDEF3 process diagram.
10 Figure 2.5: Building blocks of an IDEF3 process (Menzel & Mayer, 1998) Figure 2.6: A typical IDEF3 process (CS Odessa Corp, 2018) 2.1.2. BPMN2.0
BPMN first originated in the field of process descriptions that can be modelled and processed by the Business process management system (BPMS) to create technical and business-level models (Lambot, Slob, Van Bosch, Stockbroeckx, & Vanclooster, 2004).
11
BPMN2.0 is widely used in the U.S. especially the U.S. Department of Defence in which it is known for its robust symbol set for modelling different aspects of business processes. It defines the relationships such as workflow and order precedence (ABPMP_CBOK_Guide_English, 2013).Some of the key features identified are as follows:
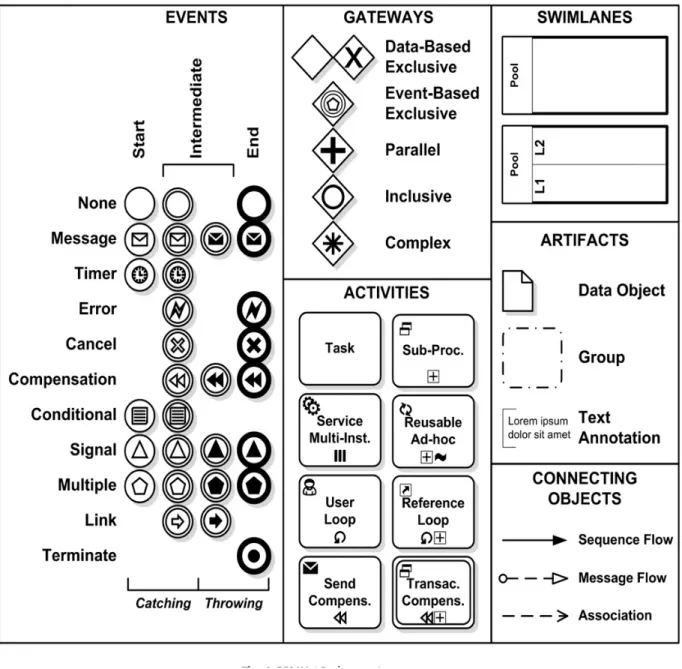
▪ Over 100 total icons, organized into descriptive and analytic sets to meet different user needs/requirements. ▪ A very precise notation indicating the beginning, intermediate and end events; activities and message flow etc. However, most of these icons are not often used. ANNEX 1: OCCURRENCE FREQUENCY OF BPMN CONSTRUCTS shows how frequent each BPMN notations are used and by whom. Summary of the most commonly used notations is shown in Figure 2.7. Figure 2.7: Summary of BPMN Notations (Chinosi & Trombetta, 2012)
12
For better understanding, Table 2.2 shows a summary of the notations grouped into four elements alongside their functions. Unlike IDEF0, BPMN2.0 deals with more than boxes and arrows are also known as activities. Each activity is triggered by an event which is represented by its own notation depending on the type of trigger. Table 2.2: BPMN2.0 elements and the functions (Genon, Heymans, & Amyot, 2010) Basic Element Categories Functions Flow Objects Flow objects are elements used in the description of models. Flow objects include events which are represented as circles, activities denote an action to be carried and are represented as rectangles with rounded corners and gateways are arrow-shaped notations which depict condition-based paths. Connecting Objects Connecting objects are elements used in linking flow objects together. There are three types of connecting object viz: Sequence flow, message flow and association. On the other hand, Sequence flows consist of arrows with solid lines and describe the order in which activities are carried out. Message flows are represented by arrows with open circles on one end and a pointed edge on the other end. While associations are dotted lines used to show a relationship between flows objects and artefacts. Swim Lanes Swim lanes are elements that put activities within horizontal and vertical lanes based on their categories. They can be used to depict which processes are classified together based
13 on their affiliations or roles. There are two types of swim lanes: pools, and lanes. Artefacts Artefacts are elements used to provide additional information about models or processes. The three (3) types of artefacts are data objects, groups and annotations.
14
3. METHODOLOGY
This chapter explains the methodology used for the study and how it was implemented
3.1. DESIGN SCIENCE RESEARCH
The methodology that was used for this study is design science research. (Vaishnavi & Kuechler, 2004) stated that design science research is an interesting way of solving problems, creating true and new knowledge via existing knowledge. Furthermore, (Vaishnavi & Kuechler, 2004) used a model in Figure 3.1 to describe the processes involved which focuses on solving identified problems and improving them.
To cumulate existing knowledge and acquire new ideas from users in the field, questionnaires (survey), interviews and workshops can be used. One-on-one interviews particularly give room to ask specific questions that are directly related to the subject, likewise surveys. This gives better insight and innovations. For this study, a survey was carried out to certain organizations and professionals in the field of study to collate the information needed and which was used to validate the comparison matrix that was developed.
Figure 3.1: Design Science Research Cycle (Vaishnavi & Kuechler, 2004)
15
The process started with problem identification and research, which lead to the development of new or improved ideas as shown in ANNEX 2: COMPARATIVE MATRIX and then validation and conclusion. These steps will be detailed in the next section.
3.2. STRATEGY OF THE RESEARCH
As several analyses have been done in the past on the different modelling languages, it was imperative to analyse the first basis of the modelling language together with the most pronounced modelling technique today. To do this, a deep understanding of the structure of the tools and in-depth knowledge of how both languages are used was scrutinized. Past articles and research, discoveries and the DSR method as explained in 3.1 were used to critically analyse both languages. From the methodology adopted, this research passed through these stages namely: 1. Problem Identification / Derivation of the Matrix 2. Survey for validation 3. Analysis of the result 4. Conclusion Extensive research was carried out in other to better understand the key areas in modelling and design of processes. Some of the key areas which were identified were then classified based on Usability, Representation, Communication and Alignment, Readability and Creativity. Ultimately, this can also be used to highlight key areas that organizations should consider in choosing tools. These five (5) main areas are briefly explained below: 1. Usability: This explains how well either of the tools under review is easy to use and comprehend; 2. Representation: If the processes modelled and designed are in line with the activities of the organization; 3. Communication and alignment: Processes modelled with either of the tools are able to communicate freely with each other within organization(s); 4. Readability: How convenient and easy for them to read the models 5. Creativity: How creative it is to design the models for each language (BPMN2.0 and IDEF0 & 3) These categories were summarized in form of a matrix with the pros and drawbacks for both BPMN2.0 and IDEF (0 & 3) as shown in ANNEX 2: COMPARATIVE MATRIXwas validated by
distributing surveys to specific professionals in the field.
16
4. PROPOSAL OF THE FRAMEWORK
4.1. THE FRAMEWORK
Based on the research and findings, there were some pros and drawbacks that were identified for both techniques in terms of modelling and design. These pros and cons were further examined based on key areas mentioned in 3.2 (i.e. Usability, Representation,
Communication and Alignment, Readability and Creativity). These were derived based on
research carried out by other researchers in the past in an attempt to analyse two or more modelling techniques. 4.2. VALIDATION 4.2.1. Survey The survey is divided into three (3) distinct parts; the first part introduced what the survey is about with no questions asked. It briefly describes BPMN 2.0 and IDEF. It also states the goal and purpose the survey aims to achieve. This is to give a brief description and overview of the thesis for clarification to the audience. The second part asks questions about the area of specialization and organization to which the respondent belongs to. This was done in other to ascertain the backgrounds of respondents and how their responses give relevance to the study. In the light of the second part, the last part was made up of questions in accordance with the comparative matrix drawn up in ANNEX 2: COMPARATIVE MATRIX. The questions have options to answer with a “scale of 1 - 5” where “scale 1” is for “totally disagree” and “scale 5” stands for “totally agree”. The purpose of the questions is to not only validate the matrix, but also to shed light on the research questions earlier drafted in 1.2. 4.3. DATA ANALYSIS 4.3.1. Background of respondents Of all respondents, 66.7% were academics with base knowledge of the subject area. Other respondents were professionals working in IT and R&D as shown in Figure 4.1. Respondents were typically IT specialists, 50% of whom had between two to six years of modelling experience with any of the tools. 16.7% had over ten (10) years’ experience while the rest had between six to eight years.
17 Figure 4.1: Types of Organizations 4.3.2. Usability All respondents agreed to the ease of use of modelling with BPMN 2.0 notations without full training, while only 33% can use IDEF tool without any guidance on how to use the boxes and arrows. Half of the respondents have never used a modelling tool with IDEF (0 &3) while the rest will require a user guide. 4.3.3. Representation In response to questions asked with regards to the suitability of the graphical notations of both tools in fully rendering the user's model, all respondents agreed that they are able to fully depict their activities using BPMN 2.0. It is worthy of note, however, that half of the respondents agreed to a lesser degree than the others. In the same vein, approximately 82.7% of respondents agreed that they have full knowledge of BPMN 2.0. On the hand, approximately 83% answered neutrally when asked about IDEF's ability in representing and modelling their activities while the others (16.7%) agreed to IDEF modelling processes with full representation of all activities. 16.7% of respondents disagreed with the question asking if the 6 sub-function restriction prevents them from being able to represent all their activities using IDEF tools and others were neutral in their answer.
4.3.4. Communication and Alignment
Respondents were asked if BPMN 2.0 allows communication and alignment of activities within processes and approximately 83% agreed while others completely. Whereas, the same couldn’t be said for IDEF as 16.7% disagreed, 50% were neutral, 16.7% agreed and the
18 rest completely agreed. Furthermore, respondents’ answers to the combination of both IDEF 0 & 3 was 66.7% was neutral, 16.7% agreed to this while others completely agreed. 4.3.5. Readability In terms of readability, all respondents agreed to BPMN2.0 process model being easy to read and understand while 66.7% disagreed to lack of training to understand the process modelled and the others were neutral to the idea. On the other hand, respondent answers to IDEF being easy to read were 16.7% disagreed, 66.7% were neutral while the others slightly agreed.
4.3.6. Creativity
Respondents answered neutrally when asked if the combination of both IDEF 0 & 3 leaves room for creativity. Nevertheless, 16.7% totally disagreed with lack of creativity due to use of boxes and arrows, 33.3% slightly disagreed and the rest were neutral. As regards to creativity with BPMN 2.0, 33.3% were neutral, 33.3% slightly agreed while 33.3% totally agreed. In spite of that, 16.7% totally disagreed with misinterpretation of BPMN2.0 creative processes modelled, 33.3% slightly disagreed, 33.3% were neutral while others slightly agreed to the idea. Summary of the results for questions asked to respondents is shown in Table 4.1. Table 4.1: Summary of results gotten Scale Key areas/Questions Totally Disagree (1) Slightly Disagree (2) Neutra l (3) Slightly Agree (4) Totally Agree (5) Representation Q1 0.0% 0.0% 0.0% 50.0% 50.0% Q2 0.0% 0.0% 83.3% 0.0% 16.7% Q3 66.7% 33.3% 0.0% 0.0% 0.0% Q4 16.7% 0.0% 83.3% 0.0% 0.0% Communication and Alignment Q1 0.0% 0.0% 0.0% 83.3% 16.7%
19 Q2 16.7% 0.0% 50.0% 16.7% 16.7% Q3 0.0% 0.0% 66.7% 16.7% 16.7% Readability Q1 0.0% 0.0% 0.0% 0.0% 100.0% Q2 66.7% 0.0% 33.3% 0.0% 0.0% Q3 0.0% 16.7% 66.7% 16.7% 0.0% Creativity Q1 0.0% 0.0% 100.0 % 0.0% 0.0% Q2 16.7% 33.3% 50.0% 0.0% 0.0% Q3 0.0% 0.0% 33.3% 33.3% 33.3% Q4 16.7% 33.3% 33.3% 16.7% 0.0%
20
5. DISCUSSION
Using the methodology stated in chapter 3, this section gives further discussion and insight into the data collated. In other to have an exact validation of the matrix drawn up, the survey was sent to experts in the field of study with experience and knowledge of both tools. From the results gotten it was seen that despite the simplicity of IDEF 0 & 3 with fewer notations as compared to BPMN2.0, it can be concluded that BPMN 2.0 is easy to use without full training. However, this does not mean basic training should not take place first. Furthermore, it can be concluded based on results gotten from the survey (100% of respondents) that the notations in BPMN2.0 have no restriction or limitations, instead it enhances the usability and representation of processes. Additionally, this improves the ability to read processes modelled with BPMN 2.0 notations since no full training is needed to understand and use it. However, the same could not be said for IDEF 0 & 3 as 83% of the respondents were neutral about its representation although some respondents agreed to its simplicity. Low usability of the language according to the result gotten hinders the representation of the process as low usage can lead to underutilisation and misinterpretation from both the user and the reader. Despite its non-complex structure/notation unlike BPMN 2.0, reading complex processes modelled could be challenging due to the enormous information shown and different variations of arrows used. This can be seen in the matrix which 16.7% agreed to. Just like BPMN 2.0, using IDEF requires basic training and understanding for proper utilization.
Nevertheless, BPMN2.0 robustness makes it fit for creative modelling irrespective of the process complexity as compared to IDEF 0&3 (which 100% of respondents were neutral to its creativity). However, its creativity can be misinterpreted by those with no basic knowledge of BPMN 2.0 and its notations. This creativity gives room for a full communication of processes within and outside organisations, free flow of information which are aligned with activities involved. With regards to IDEF, almost the same can be achieved if both IDEF 0&3 are combined.
Based on the foregoing, there were few variations to the matrix earlier drawn up. This however brought up the need to make certain changes to the earlier matrix. This conclusion is based on responses from the survey sent and past research. This can be seen in ANNEX 4: PROPOSED COMPARATIVE MATRIX
21
6. CONCLUSION
6.1. SUMMARY OF THE WORK AND FINDINGS
Having a well-defined process seems to be the common practice in organisations. However, implementing processes using the right set of tools is likewise important to deliver a workable process that can help organisations achieve its strategic objectives. This can also increase productivity, efficiency and quality of service among teams or in the organization as a whole.
This study used design science research as discussed in 3.1 to analyse the perceived advantage that BPMN2.0 may over other tools like IDEF0 and IDEF3. It also sought to establish the strengths and weaknesses of each tool by analysing them side by side. A comparative matrix was built to illustrate this, and a survey was carried out to ask professionals and organizations that use these tools about their experience modelling with them. The result of this survey was finally used to validate the comparative matrix earlier drawn. This ultimately led to the modification of the matrix as seen in ANNEX 4: PROPOSED COMPARATIVE MATRIX.
6.2. LIMITATIONS OF THE RESEARCH
There were few challenges while carrying out this research which included getting more professionals in the area of both languages. This includes professionals like the process engineers and analysts together with CIOs and CTOs. These professionals have full insight and experience with different modelling tools across various departments in an organisation. This, however, can give full insight based on their technical know-how on how well each modelling language/technique can be utilized in terms of the key areas earlier stated.
6.3. FUTURE WORK
For future use, a deep dive analysis could be done in different sectors of an organisation with both tools. This could give in-depth insight into the key areas of modelling together with the capability of both tools. Additionally, future work will benefit from having more contributions from professionals and researchers with experience using both tools.
22
7. BIBLIOGRAPHY
ABPMP_CBOK_Guide_English. (2013) (1st Editio). Association of Business Process Management Professionals. Retrieved from http://www.abpmp.org/. Aguilar-Savén, R. S. (2004). Business process modelling: Review and framework. International Journal of Production Economics, 90(2), 129–149. https://doi.org/10.1016/S0925-5273(03)00102-6 Cheng-Leong, A., Li Pheng, K., & Keng Leng, G. R. (1999). IDEF*: A comprehensive modelling methodology for the development of manufacturing enterprise systems. International Journal of Production Research, 37(17), 3839–3858. https://doi.org/10.1080/002075499189790 Chinosi, M., & Trombetta, A. (2012). BPMN: An introduction to the standard. Computer Standards and Interfaces, 34(1), 124–134. https://doi.org/10.1016/j.csi.2011.06.002 Cortes-Cornax, M., Dupuy-Chessa, S., Rieu, D., & Mandran, N. (2016). Evaluating the appropriateness of the BPMN 2.0 standard for modeling service choreographies: using an extended quality framework. Software and Systems Modeling, 15(1), 219–255. https://doi.org/10.1007/s10270-014-0398-0 Costin, B., & Fox, C. (2004). Hybrid IDEF0 / IDEF3 Modelling of Business Processes : Syntax , Semantics and Expressiveness. In Romanian-Austrian Workshop on Computer-Aided Verification of Information Systems: A Practical Industry-Oriented Approach (pp. 20–22). Kim, C. H., Weston, R. H., Hodgson, A., & Lee, K. H. (2003). The complementary use of IDEF and UML modelling approaches. Computers in Industry, 50(1), 35–56. https://doi.org/10.1016/S0166-3615(02)00145-8 Lambot, S., Slob, E. C., Van Bosch, I. Den, Stockbroeckx, B., & Vanclooster, M. (2004). Modeling of ground-penetrating radar for accurate characterization of subsurface electric properties. IEEE Transactions on Geoscience and Remote Sensing, 42(11), 2555–2568. https://doi.org/10.1109/TGRS.2004.834800 Menzel, C., & Mayer, R. J. (1998). The IDEF family of languages. Handbook on Architectures of Information Systems, 209–241. https://doi.org/10.1007/3-540-26661-5_10 Mojdeh, S. (2005). Technology-enabled Business Performance Management: Concept, Framework, and Technology. Proceedings of the 3rd International Management Conference, 1–9. Retrieved from http://www.irpds.com/FileEssay/modiriat-86-11-26-c-sy14.pdf Negi, T., Bansal, V., & Kanpur, I. (2009). Analysis of Business Process Modeling Techniques to Model Informational Process Perspective. Object Management Group (OMG). (2011). Business Process Model and Notation (BPMN) Version 2.0. Business, 50(January), 170. https://doi.org/10.1007/s11576-008-0096-z Pawlewski, P., & Hoffa, P. (2014). LANGUAGES OF PROCESS MODELING, 4(3), 221–229. Šerifi, V., Dašić, P., Ječmenica, R., & Labović, D. (2009). Functional and information modeling of23 production using IDEF methods. Strojniski Vestnik/Journal of Mechanical Engineering, 55(2), 131–140. Vaishnavi, V., & Kuechler, B. (2004). Design Science Research in Information Systems Overview of Design Science Research. Ais, 45. https://doi.org/10.1007/978-1-4419-5653-8 Waissi, G. R., Demir, M., Humble, J. E., & Lev, B. (2015). Automation of strategy using IDEF0 - A proof of concept. Operations Research Perspectives, 2, 106–113. https://doi.org/10.1016/j.orp.2015.05.001 Zur Muehlen, M., & Recker, J. (2008). How Much Language Is Enough? Theoretical and Practical Use of the Business Process Modeling Notation. In 20th International Conference on Advanced Information Systems Engineering (Vol. 5074, pp. 465–479). https://doi.org/10.1007/978-3-540-69534-9_35
24
ANNEX
Annex 1: Occurrence Frequency of BPMN Constructs
25 Annex 2: Comparative Matrix ISSUES BPMN 2.0 IDEF (0 & 3) USABILITY PROS: Easy to use as an expert if all notations and functionalities are well known PROS: Very easy to use as it deals with just boxes and arrows DRAWBACKS: There's need for training as it might be difficult to use at first glance due to the numerous notations DRAWBACKS: There is need to understand the concepts of the arrows and boxes REPRESENTATION PROS: Depending on the organization and its functionalities, BPMN 2.0 tends to represent and model almost all aspects PROS: Depending on the business unit and organization, IDEF can model the processes with full details DRAWBACKS: Due to the numerous notations, using the wrong notation will represent a different process or activity. DRAWBACKS: There's restriction of 6 sub-functions on every function modelled (with IDEF0) COMMUNICATION AND ALIGNMENT PROS: Processes modelled allows free flow of communication both within and outside the Organization which aligns with the business strategy PROS: It supports communication and breaks down every level in a hierarchical form DRAWBACKS: It is a bit difficult to capture and manage collaborative business processes (i.e. cross-organizational processes) which makes it hard to communicate DRAWBACKS: There's needing to combine both IDEF0 and IDEF3 to be able to model the processes accurately in a communicative way. READABILITY PROS: Depending on who views it, it is easy to read, attractive and understand PROS: It's very easy to read and understand due to the full information provided DRAWBACKS: Without adequate training, it might be difficult to understand and grasp what the model represents DRAWBACKS: The sight of the arrows and all the information can be cumbersome at first sight thereby making it less attractive to read CREATIVITY PROS: The many notations make room for creativity that can be pleasing to the eyes PROS: This happens when combining more than one aspect of IDEF DRAWBACKS: It can be misinterpreted DRAWBACKS: There's not much creativity here as it's just boxes and arrows
26
Annex 3: Survey Questions and answers(average)
Section Survey Question Average Response
Background 1. Type of Organization University, R&D, IT Company 2. Area of Speciality Information Systems 3. How long have you used any of the modelling languages above? 2-6 years Usability 1. It is easy for me to use a modelling tool with BPMN 2.0 notations without full training 5.00 2. I can use IDEF tool without any guidance on how to use the boxes and arrows while modelling and designing 2.00 Representation 1. Modelling with a BPMN 2.0 tool clearly shows all the activities as it is in my organization 4.50 2. I can model the activities/ processes in the unit/organization in detail with IDEF Language 2.67 3. I don't have full knowledge of the BPMN 2.0 notations, hence, I am not able to represent the activities properly 1.33 4. The 6-sub-function restriction prevents me from showing all the activities while using IDEF 2.67 Communication and Alignment 1. Processes or activities that involve external(outside) organizations are well designed (with BPMN 2.0 tool), and it has effective communication and free flow of information. 4.20 2. It's better to do this with IDEF because it breaks down every level in a hierarchical way 2.50 3. It's better to combine 2 of the IDEF subtypes, that is, IDEF0 and IDEF3 to achieve an accurate model 2.30 Readability 1. It's easy to read and understand a process model designed with a BPMN 2.0 tool 5.00 2. I don't have full training/knowledge; therefore, I am not able to fully understand what the model represents. 1.67 3. It’s easy to read/understand the processes, the information and the flow of arrows modelled with IDEF 3.00 Creativity 1. I can design in a creative way when I combine more than one IDEF sub-type together 3.00 2. There's not much creativity because it's just boxes and arrows 2.33 3. Designing with BPMN 2.0 tool is very creative with the notations 4.00
27 4. It is sometimes misinterpreted by others who don't know all the BPMN 2.0 notations very well 2.50 Annex 4: Proposed Comparative Matrix ISSUES BPMN 2.0 IDEF (0 & 3) USABILITY PROS: Easy to use as an expert if all notations and functionalities are well known PROS: Slightly easy to use as it deals with just boxes and arrows DRAWBACKS: Basic training or knowledge of BPM is required DRAWBACKS: There is need to understand the concepts of the arrows and boxes REPRESENTATION PROS: Depending on the organization and its functionalities, BPMN 2.0 tends to represent and model almost all aspects PROS: Depending on the business unit and organization, IDEF can model the processes to some extent DRAWBACKS: Due to the numerous notations, using the wrong notation will represent a different process or activity. DRAWBACKS: There's little or no restriction of 6 sub-functions on every function modelled (with IDEF0) depending on the complexity of the process. COMMUNICATION AND ALIGNMENT PROS: Processes modelled allows free flow of communication both within and outside the Organization which aligns with the business strategy PROS: It supports communication to certain extent and breaks down every level in a hierarchical form DRAWBACKS: It is a bit difficult to capture and manage collaborative business processes (i.e. cross-organizational processes) which makes it hard to communicate DRAWBACKS: Both IDEF0 &3 can be used separately. However, for accurate and precise communication, there’s needing to combine both IDEF0 and IDEF3 to be able to model the processes accurately in a communicative way. READABILITY PROS: Regardless of who views it, it is easy to read, attractive and understand PROS: It's very easy to read and understand due to the full information provided DRAWBACKS: Basic training is only required to fully understand and grasp complex process. DRAWBACKS: The sight of the arrows and all the information can be cumbersome at first sight thereby making it less attractive to read
28 room for creativity that can be pleasing to the eyes combining more than one aspect of IDEF DRAWBACKS: It can be misinterpreted DRAWBACKS: There's not much creativity here as it's just boxes and arrows