1
Financial inclusion in Africa
Improving it through Fintech
Susana Gamito
(152416043)
Dissertation written under the supervision of João Freire de Andrade
Dissertation submitted in partial fulfilment of requirements for the MSc in Finance, at
the Universidade Católica Portuguesa, June 2018.
2
Financial inclusion in Africa
Improving it through Fintech
Susana Gamitoa
a Master’s in Finance, Católica Lisbon School of Business and Economics
SUMMARY
This paper is devoted to the study of financial inclusion in Africa, finding out how to measure it and how can we improve it through the use of fintech tools. The goal is to show that, using fintech, we can increase financial inclusion levels in the countries that needed the most in Africa by applying it in the dimensions that are mostly lacking from improvement. We begin by showing how to measure financial inclusion by applying it to the following dimensions: access, usage, price, equality and technology. Then we analysed the results to find out which are the dimensions that are most lacking from investment, comparing it to the top ten countries in terms of financial inclusion levels. It was shown that the African countries mostly needed investment in the dimensions of usage and equality. Lastly, we looked at those dimensions and recommended several different ways how we can improve it through fintech tools, showing also what some of the African countries have been doing so far in this regard. In here our
recommendations were based on the use of interoperability, dematerialization, convergence, regulation and gamification.
3 Contents List List of Figures ... 4 List of Abbreviations ... 5 01. Introduction ... 6 02. Literature Review ... 8 03. Methodology ... 16 04. Data ... 20 05. Results’ Analysis ... 22
06. Limitations and Further investigation... 25
07. Recommendations ... 27
08. Real examples ... 30
09. Conclusion ... 35
10. Reference List ... 37
4
List of Figures
Figure 1 Values for the FII using equal weights for the dimensions ... 22
Figure 2 Distribution of weights to achieve optimal FII ... 23
Figure 3 Value for the FII considering equal weights ... 40
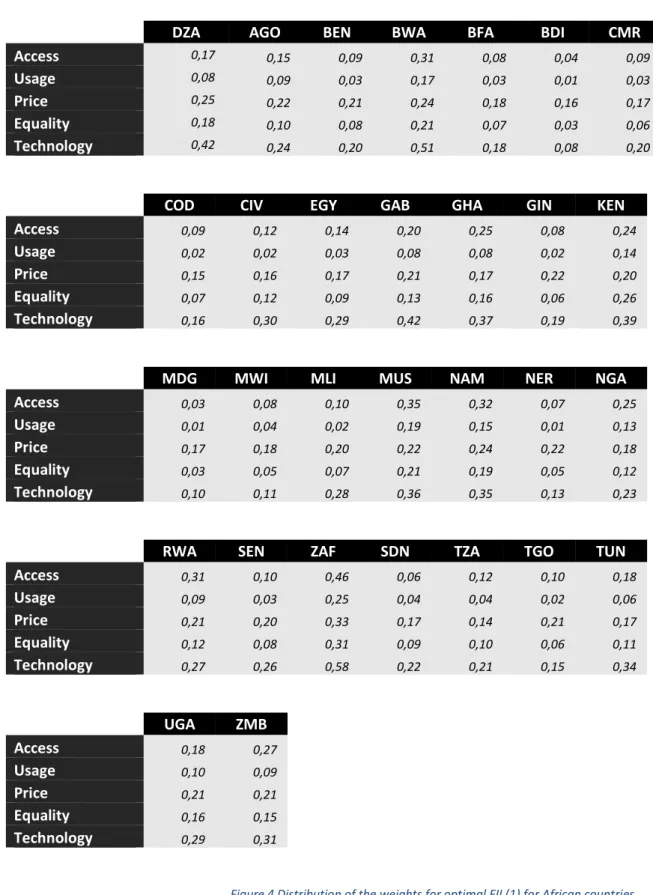
Figure 4 Distribution of the weights for optimal FII (1) for African countries ... 41
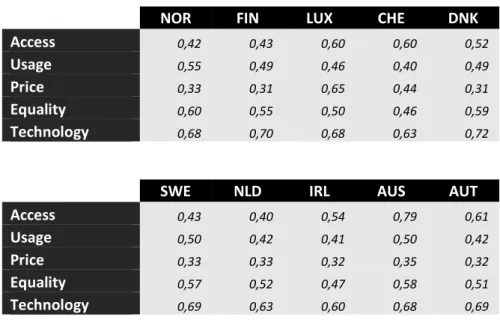
Figure 5 Distribution of the weights for optimal FII (1) for top countries ... 42
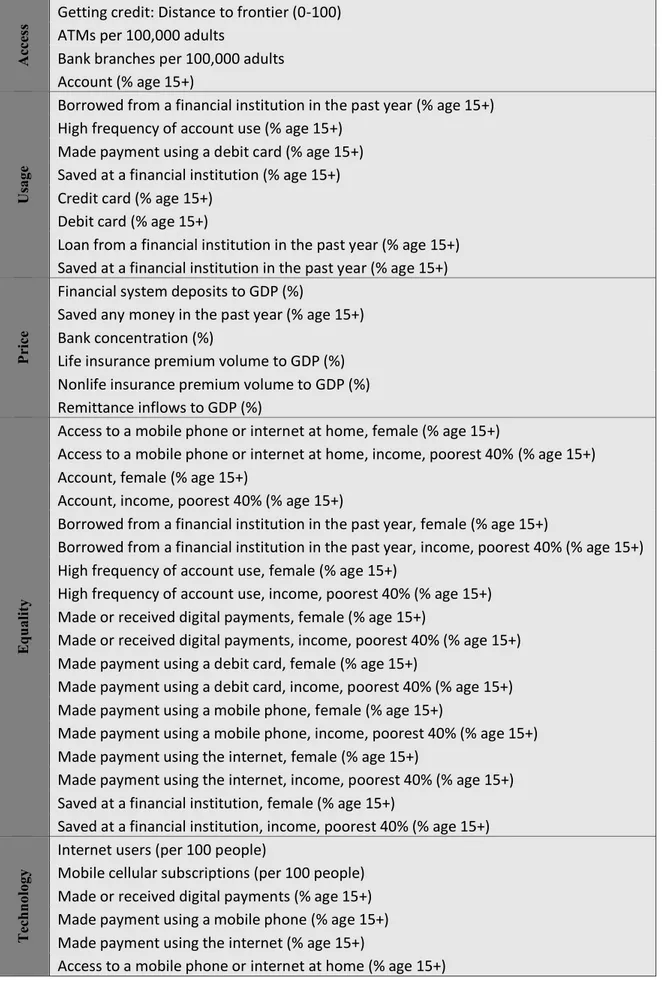
Figure 6 List of indicators used divided by dimension ... 43
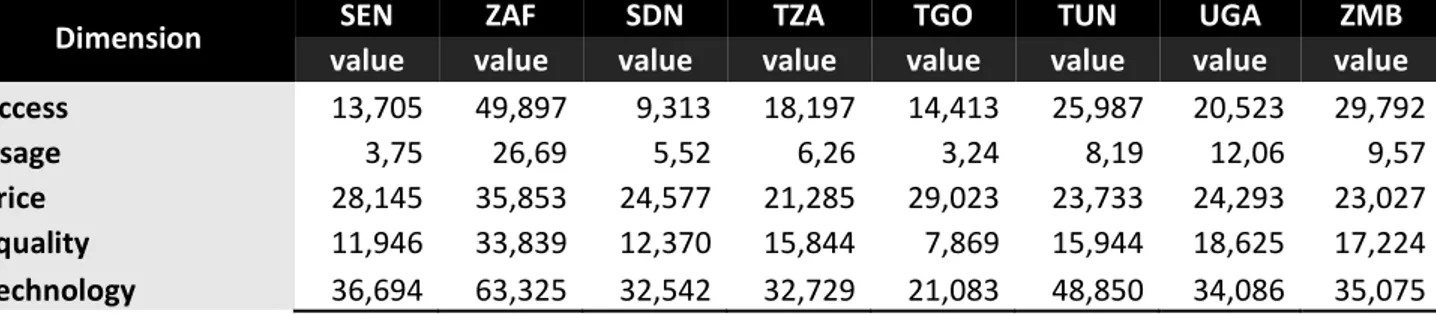
Figure 7 Value of each dimension after calculations for African countries ... 44
5 List of Abbreviations AGO – Angola AUS – Australia AUT – Austria BEN – Benin
BFA – Burkina Faso BDI – Burundi BWA – Botswana CHE - Switzerland CIV – Cote d’Ivoire CMR – Cameroon
COD – Democratic Republic of Congo DNK – Denmark
DZA – Algeria
EGY – Arab Republic of Egypt FII – Financial inclusion index FIN - Finland
GAB – Gabon
GDP – Gross domestic product GHA – Ghana
GIN – Guinea
IMF – International Monetary Fund IRL – Ireland KEN – Kenya LUX - Luxembourg MDG – Madagascar MLI – Mali MUS – Mauritius MWI – Malawi NAM – Namibia NER – Niger NGA – Nigeria NLD – Netherlands NOR - Norway RWA – Rwanda
PPD – Public Private Dialogue SDN – Sudan SEN – Senegal SWE – Sweden TGO – Togo TUN – Tunisia TZA – Tanzania UGA – Uganda
WBG – World Bank Group WEF – World Economic Forum ZAF – South Africa
6
01. Introduction
In order for human development to reach every single individual and be a spread-out phenomenon worldwide, progress needs to be all inclusive. The United Nations have identified four equally supporting pillars of human development: formulating an employment-led growth strategy, enhancing financial inclusion, investing in human development priorities and undertaking high-impact multidimensional interventions (win-win strategies). In this paper we will focus on the second, enhancing financial inclusion. By focusing on investments in human development in order to enhance financial inclusion, we will be able to provide to disadvantage and marginalized groups higher-quality services, products and infrastructures at a lower cost.
Financial inclusion is one of the most important and complex problems of today’s society. This issue is not only widely addressed academically, but its importance has also been recognized in the policy circle, making the goal of financial inclusion a priority in many economies. This has even become a primary point of interest for multifaceted corporations like the International Monetary Fund (IMF), the World Bank (WBG) and the World Economic Forum (WEF). They focus on policy prescriptions, guidelines and gathering more data about this topic to better address it, creating databases and data sources such as the Financial Access Survey (IMF) and the Global Findex database (WBG). The enlarged prominence on the matter echoes a growing consciousness of its potentially transformative power to accelerate development gains. The developing world is one of the most suffering from financial exclusion, but also the one with endless opportunities to create a change. If we look at African countries, in the most recent decades they have experienced positive developments in their financial system overall. However, in many countries it still remains underdeveloped when compared to the rest of the world. This makes it one of the main areas where to address this issue and focus our attention.
Often the problem of financial inclusion is aimed to be solved by Fintech. In this regard, there are six important pillars to boost financial inclusion: financial access and literacy, financial identity, mobile banking, microfinancing for individual and micro-, small- and medium-sized businesses, and consumer security (Medici, 2016). Focusing on those, there are many measures and actions that can be taken. This being said, it is important to know in which dimension should we concentrate the most and find a way to see the results attained.
7
Before starting to properly address this subject and propose solutions for it, one first needs to properly measure it and quantify it. To find a robust and comprehensive measure in order to make an overall assessment of the current state of affairs in what relates to financial inclusion in an economy and also to check the progress of the policy initiatives tackled.
This paper tries to analyze the relationship between growing financial inclusion and investments on the basis of fintechs in Africa, by empirically finding specific dimensions that distinguish the African countries from more financially included economies. To do so, we will first find and empirical model that allow us to measure financial inclusion based on some chosen dimensions that characterize the concept of financial inclusion. Then, we will use it to define the importance of each one of the dimensions in African countries and compare it with its importance in the most financially included countries. With that, we hope to find which are the dimensions in Africa that are mostly lacking from investment and development. In the end, the paper will focus on the dimensions chosen and how they can be improved through fintech. We will give recommendations and look real life examples of what some countries are already doing to solve this problem.
In summary, this paper tries to answer the following research questions: • How can we measure financial inclusion?
• Which dimensions make some countries more inclusive than others? • How can fintech be used to increase levels of financial inclusion in Africa?
8
02. Literature Review
A main concern that every individual, business and government has is of financial stability. When we talk about individuals, the key to achieve financial stability can be divided into three particular points of interest: financial inclusion, financial literacy and consumer protection (Chakrabarty, 2012). In this case, whilst financial inclusion is related with the actions of the supply side that are providing the financial services and products, financial literacy and consumer protection are more related with demand and making people aware of what people they should and can request and be entitled to. In this particular paper, we will focus on the demand side and, therefore, on financial inclusion.
The global financial crisis was one of the events that made financial inclusion a topic of great focus, since there is a belief that one of the factors that aided and helped spread the crisis was the increased levels of financial exclusion. This being said, financial
inclusion continues today being a very important and hot topic worldwide. All over the globe, people have been struggling to address the issue of growing inequality, not only but especially in what concerns financial and economic inequality. One example of this fact is the 2016 World Economic Forum conference in Davos focused on “Mastering the Fourth Industrial Revolution”, were some of the top business leaders, international political leaders, economists, celebrities and journalists got together to debate about the Fourth Industrial Revolution, more known as the cyber-bio-physical revolution. This revolution, unlike others, is not only about economic growth and new technology, but mainly about the need to enhance the well-being of the population and achieve equal rights and opportunities for all. As Amira Yahyaoui, Founder and Chair of Al Bawsala, and Co-Chair of the Annual Meeting 2016, stated “The Fourth Industrial Revolution is also a values revolution”. There is a clear need for both businesses and governments to come together and work in a way that technologies spread while at the same time reduce inequality, taking into consideration not only values of growth and value, but also of empathy and tolerance (WEF, 2016). “We now have the tools, the strategy, and the data we need to achieve global financial inclusion,” Queen Máxima of the Netherlands said. But even if we do not look at financial inclusion as an objective in itself, it can also be considered a goal for countries in the sense that aids them in improving both individual and aggregate welfare (Beck, 2006). The Boston Consulting Group estimated that, with currently over 2.5 billion people who do not have access to formal financial services, a
9
simple increase of 1% in financial inclusion could help increase real GDP per capita growth by over 3.6%. This numbers alone show the importance and value of investing
on the increase of financial inclusion.Financial services can be used as a bridge out of
poverty and vulnerability to growth and sustainability.
There is a lot of literature around the topic of financial inclusion, especially after the crisis of 2012, but there seems to be a recurrent topic around it, that is ‘how can we measure financial inclusion?’. There is a lot of methods and theories about the best way to do so, but to analyze it better we first need to know how to define it, and about this there is also different concepts accepted and used. It can be defined as a process that guarantees the access, availability and usage of formal financial services and products in an easy way, for all members of the economy (Sarma, 2012). Or even as a process to make sure that the vulnerable groups of a society, such as low-income groups and the weaker sections, get access to the financial system and are able to get timely and adequate credit, always at an affordable cost (Rangarajan Committee, 2008).
Nevertheless, no matter which definition is used, is clear that financial inclusion is a multidimensional concept and it needs to be looked at that way. However, there are many challenges by narrowing it down to only one definition, even if a
multidimensional one. For example, the institutional set up of the countries can make them look at financial inclusion in very different ways, and value some targeted variables or indicators differently. That is way that it needs to be very careful when defining financial inclusion and choosing the dimensions that can be applied to the different realities of several countries. Given this multidimensionality, it is important to define which dimensions to use and study when applying the mathematical model. We decided to focus on five dimensions that we believe, based on the literature review and on the data found, that characterize the concept of financial inclusion:
1. Access: This dimension helps us measure the size of the banked population, this
is,the ability to use available financial services and products from formal
organizations. It reflects the depth of outreach of financial services and products of an economy, both on penetration (bank branches and points of sale – POS – for example) and on demand side barriers (high costs or lack of information). In this particular case, we will focus on penetration of services, products and infrastructures in the country (ATM’s, bank branches/outlets, bank agents).
10
The first step towards financial inclusion is making sure that every single individual has access to a transaction account, allowing them to make simple actions like store money, make payments and receive transfers. Taking this first step might also serve as a gateway to other more complex financial services and products. By being an accountholder, people are more willing to then user other financial services such as credit and insurance, to start and expand businesses, invest in education or health, manage risk, and weather financial shocks, which can improve the overall quality of their lives. It can help them not only in their day-to-day life, but also planning for long term goals or through unexpected emergencies.
2. Usage: Ideally, an inclusive financial system should penetrate widely amongst its users. This dimension focus on the study of the underbanked or marginally banked (Chattopadhyay, 2011) which are the one that, despite having a bank account, make very little use of it and its products and services. This happens for various reasons such as remoteness, having negative experiences with the bank itself, not having the necessary conditions to use it, and many others. That is why is not enough to just study the ones who have a bank account, we need to also look closely into how individuals are using it and how often.
Usage can be looked at in different ways, taken into consideration different forms of use, but we tried to focus on the main forms of use and what can we measure (deposit and credit). Bearing in mind the data available, we tried to find data that would provide information about the products and services, study the patterns of use and the overall behaviors of individual towards financial institutions.
3. Price: This dimension is related to the fact that many times, financial products and services are just too costly for many people to be able to use them. This is a very recurrent form of financial exclusion, especially among less developed economies.
Affordability is today still seen as one of the biggest barriers in what concerns access to financial services. Affordability relates to the expenses related with using services, including not only the basis price but also both interest rates and extra fees. As a broader concept, it relates not only to the costs that individual
11
will have by acquiring the service or product, but also to having a positive value for the service/product, this is, to gaining value from it. This applies to not only credit (usually related with interest rates) but also savings (e.g. what we gain from putting money in the bank, versus keeping it in cash), insurance (e.g. premium paid and gains in case of an accident) and payments (e.g. fees from paying using card). For example, if the rate of return on savings is inferior to the inflation, the savings account does not hold the real value of the customer’s savings.
4. Equality: In this dimension, we tried to focus on the weight that the more marginalized groups and how they compare to the rest of the population in terms of financial inclusion. We looked into two distinctive groups: females and the poorest 40% of the population.
In terms of women and girls, even though they make up a little over half of the world’s entire population, their contribution to economic activity, growth and well-being is far from it true potential, which leads to substantial socio-economic consequences. Worldwide, only half of the women are part of the labor force (compared with three quarters of men) and if we look at the developing world that numbers drops substantially (in underdeveloped areas, over 90% of women’s employment is informal). All those numbers result in lack of access to financial services, reduce the chances of climbing out of poverty or even worse, increase the risk of going into poverty, contributes to women’s marginalization to the informal sector, and diminishes their opportunities to completely participate in quantifiable and productive economic activities.
Financial inclusion of females can produce gender equality by empowering them and allowing them to take charge over their financial lives, not having to depend on others. Savings accounts can offer them a proper and secure platform where they can store their earnings in order to use them in forthcoming investments, in possible business procedures and also create their own credit history. Digital payments allow females to take charge of their own finances and reinforce their control over household budgets which, in turn, frequently outcomes in larger expenditures on necessities, for example education and health.
Similar things occur with the poorest part of the population. A majority of the poor households’ function almost entirely in a cash-based economy, especially if
12
we focus on the less developed countries. This means they use cash, physical assets (such as jewelry and livestock), or informal providers (such as money lenders and payment couriers) to meet their financial requirements, all the way from receiving salaries to savings. Nevertheless, those informal instruments may not be very secure, affordable, are much more difficult to use, and they represent only a limited alternative when a major unexpected problem arises, such as a poor harvest or a serious illness in the household. By helping this part of the population, not only the country’s economy will grow, we will take a gigantic step in decreasing financial problems worldwide.
5. Technology: Financial inclusion includes and is about much more that just payments, transactions and bank accounts. It also includes savings, insurance, credit and loans, among others, which are far less explored than the previous ones. Is about having the right tools to aid us in our day-to-day lives, about short-term and long-term personal objectives, business goals and dealing with unexpected emergencies. Technology can help with addressing many of the issues imposed by traditional financial models and services. In here, is important to take in especial attention to fintech companies, which are able to leverage alternative credit assessments, reducing turnaround time and transaction costs in approving loans and credit lines. The co-founder of Microsoft, Bill Gates, said that banking is necessary, but banks are not. He stated that "Digital payment systems can do more for equality in poor countries than they can do anywhere else" adding that "We're not waiting for it to trickle down as we do for many advanced technologies. That's not good enough". That's a takeaway for the importance of technology when dealing with financial inclusion, especially when we are talking about less developed countries.
If we look at underdeveloped countries, this is especially important since there is a big need for viable alternatives to the traditional models. In this dimension, we will look at how people embrace technologies (internet and mobile) and how they use them in their day-to-day life.
In this paper, we will be focusing on the continent of Africa, which has a reality completely unique and different from the rest of the world, having its own assets and struggles to consider.
13
For a long time, Africa has been considered one of the least developed countries, struggling with economic and social growth. And for a long time, people and
governments looked at it in a narrowed way, focusing on the country as a whole and not on the needs of the majority of its population and the lower social groups. However, things are changing, with governments starting to focus on people, as was stated by Paul Kagame, President of Rwanda, “Development is about more than money, or machines, or good policies – it’s about real people and the lives they lead” (WEF, 2016). Right now, Africa is seen as the second fastest growing area in the globe, following Asia. When we talk about financial services and products, historically Africa has been having a considerate deficit, especially among the more vulnerable groups. Its
underdevelopment and its limited outreach is very well documented over the years. The low and volatile revenue levels, the inflationary settings, large illiteracy rates,
inadequate infrastructure, governance challenges, the limited competition within the banking industry, as well as high cost of banking are just some of the factors that help explain this deficit in the African financial system (African Development Bank, 2013). And another of the problems was also that, while still increasing, data available about African countries is very limited, covering only part of the continent. Some countries do not have any nationally-led surveys of financial inclusion or about the financial state of the population, making it harder to find the problems and decide on the right measures. This being said, despite all of the issues, with the rise of fintech and of the new
technologies, there has been a glimpse for a dramatic change in the world, especially amongst the least developments areas like Africa. Its path is and will continue to be unique, because the starting conditions are also unique.
Fintech stands for Financial Technology, and its related to companies whose main business is financial services or products that base their business model in a technological platform to innovate, increase efficiency and give to its consumers a better user experience at a lower cost. This type of companies is growing in the economy and are mostly star-ups that are trying to challenge the traditional business models and offer a better alternative for the existent options such as mobile payments, money transfers, loans, fundraising and even asset management (Truong, 2016). The year of 2000 marked a turning point in the development of the Internet (Desai, 2015), being available and used by a massive part of the population around the world, which obviously helped the development of the fintech market. Today, fintech is evolving as a core disruptor of each aspects of today’s world, and its innovations
14
promise a more effective, reachable and more secure financial system (UNEP, 2016). The Governor of Bank of England and Chairman of G20’s Financial Stability Board Mark Carney, stated that “fintech’s potential to deliver a great unbundling of banking’s core functions, highlighting that the outcomes could be ‘bucketed’ into one of three potential scenarios – revolution, restoration and reformation”. Fintech offers the possibility of advamce and expedite the integration of the financial economy, to increase and boost possibilities for shaping greater decentralization in the transition to sustainable development. But what type of variations can be anticipated from the fintech current disruption and what influences will it have on possible sustainable development consequences and outcomes?
Given its lower costs and overall better service and user experience, fintech’s can rapidly overgrow traditional banks, lenders and insurance companies. They can reach those parts of the population that are more isolated, sometimes even through means that do not require internet such as mobile phones, and that are just too expensive for the most traditional business models, even bringing some new financial services that are targeted specifically for different social groups that were not being target previously. Fintech allows for everyone with a smartphone to have access to financial services and products, losing the middleman and therefore allowing the prices to decrease and become more affordable. Through technologies, like insuretech, we are able to better see what the risks and advantages of each person are and create the best conditions for everyone. Through new tools, like gamification, we are able to teach and ease in people into the idea of financial services and products.
With the use of tools like blockchain, will be possible for economy assets and procedures to interrelate with the financial system in foreseeable ways and with
disruptive business models that were unheard years ago. Also, will help with the goal of decreasing the level of financial exclusion around the globe, especially around less developed countries that actually are more willing to new changes. Factors like mobile services and products, higher competition, less intermediaries, transparency and
collaboration, efficiency, speed and automation are factor that show the true potential of fintech and how they should be used and looked into not only by companies and
leaders, but also by regulators (Beck, 2016 and UNEP, 2016). But usually, regulators of financial systems focus their efforts on financial stability and not on fintech’s potential and its unintentional consequences.
15
Meanwhile, in Africa, those changes are creating an unprecedented opportunity in order to achieve higher levels of financial inclusion across the entire continent. Fintech models like mobile banking, big data credit scoring, branchless distribution and machine-to-machine lending help reduce both the costs and risk, especially in more remote areas where the costs of building a branch network are much higher (Africinvest, 2016).
There is not a hint of doubt that the African financial sector is accelerating in growth, creating substantial value to customers and institutions. Although underdeveloped, the African population is still connected through internet, mobile phones and in some cases even the internet of things, and this is a growing trend that we are seeing happening right now.
By creating fintech actions to specific dimensions and areas with the objective of attaining higher levels financial inclusion in undeveloped places like Africa, not only we are aiding in the overall growth and development of the globe, but also helping the individual in having an equal, more sustainable and better-quality life. The
transformative power of technology lies at the core of the vision of a Fourth Industrial Revolution, however, it should be understood that technology is not a “magic bullet” in itself, but a tool for wisely tackling the challenges faced by Africa (WEF, 2016).
16
03. Methodology
The use of indexes is widely spread in the Human Development context. Being financial inclusion a component of human development, it makes sense to try and use the same approach to quantify it. A comprehensive measure of financial
inclusion/exclusion should be able to incorporate information on several dimensions, preferably in one single number. Many authors employed econometric approaches to come up with a measure of financial inclusion (Honohan, 2008; Ardic et al., 2011; Sarma, 2012; Chakravarty et al., 2010), whilst policy makers and regulators usually prefer to use a variety of indicators and surveys to take stock of the status of financial inclusion. For start, and regardless of the approach chosen – econometric or use of a variety of indicators – is important to analyze some of the IFI (indicators of financial inclusion). Now, because the inclusiveness/exclusiveness should be evaluated along several dimensions, a multi-dimensional econometric approach, aligned with the study of the financial indicators mentioned before, is the best approach to create a proper financial inclusion index (FII).
If we look at international academical level, there are two main well known FII
approaches: Sarma (2008) and Chakravarty and Pal (2010). In this paper, we looked at both this approaches to see which one would better fit its purpose. To do so, we looked at the mains mathematical properties and how each of the approaches relates to each one of them:
1. Boundedness/Normalization: With both approaches we can define and pinpoint the bounds of the FII, both the lower and upper bound.
2. Monotonicity: In both cases, the FII is a monotonous function of the dimension indexes. This means that higher values of at least one of the dimension will lead to higher values of the FII (higher levels of financial inclusion), keeping all the remain unchanged. And the contrary is also true (lower levels of one dimension worsen the value of the FII).
3. Proximity: A higher value for the FII means that the value is closer to the desired (best practice) and vice versa. This is only true for the Sarma (2008) approach.
4. Uniformity: In both methods, a lesser (larger) scattering across the dimensions used, implies a larger (lesser) FII.
17
5. Signaling: In both approaches there is a unique optimal path that lead us to reach the optimal (higher) value for the FII.
6. Homogeneity: This property means that if all the arguments of a dimension index are changed by the same constant, the FII remains the same. This means that the dimension indicators are independent to scaling, which is true for both the methods.
For this paper, and considering the mathematical properties detailed before, we decided to use the Sarma (2008) approach, because it has the ‘proximity’ characteristic that lacks in the alternative and also is more intuitive. With this method we can measure financial inclusion in several points in time and at different economic levels (region, country, continent). For this particular paper, we will use it to quantify financial
inclusion on a country level basis, because is what better fits the objectives, and only in one point in time, more precisely using data from 2014, mainly because of data
availability constraints.
Following an approach similar to that used by UNDP for computing some well-known indexes like HDI (human development index), HPI (human poverty index) and the GDI (general development index), among many others, we need to start by computing a dimension index for each of the dimensions, and with that finding what is the country’s accomplishments in the dimension i. This is done using the following formula:
(1) 𝑑𝑖 = 𝑤𝑖
𝐴𝑖 − 𝑚𝑖
𝑀𝑖 − 𝑚𝑖
being,
di: index for dimension i
wi: weight attached to the dimension i, where 0 ≤ wi ≤ 1
Ai = actual value of dimension i
mi = lower bound on the value of dimension i, defined by some prespecified rule.
Mi = upper bound on the value of dimension i, defined by some prespecified rule.
In this case wi represents the relative weight given to the respective dimension analyzed
and its importance to the overall index. If we consider n possible dimensions used, the
value of our index will be characterized by the point X = (d1, d2, …, dn) represented
18
would be for the actual value of every dimension being equal to its maximum value
which is represented by the point W = (w1, w2, …, wn). On the other hand, the worst
possible scenario would be for the actual value of every dimension being equal to the minimum value possible, positioning it in point O = (0, 0, …, 0). This means that we can analyze the performance of our point X by looking into the distances between both point X and W and the point X and O. A bigger distance between X and O would imply a higher value of the FII. At the same time, a minor distance between points X and W would also indicate bigger values for the FII. Being in the n-dimensional space it is then
possible, for example, to have two points (X1 and X2) which have the same distance
from point W, but have very different distances from O. Thus, while developing the FII both those distances need to be taken into consideration. To reduce problems an issue might happen from two countries having the same distance between their point and point W but different distances with point O, is necessary to give more positive weight to a smaller distance from point W (more financial inclusive) and give a more negative weight to smaller distances from point O (less financial inclusive).
The solution presented is to measure the Euclidian distance between X and O and the inverse distance between point X and W. To make sure that the FII is normalized and only has values between 0 and 1 (i.e., the index has well defined bounds), both those distances were normalized by the distance between O and W. Then, by computing the simple average between both the distances mentioned, we ensure once again that the index remains a value between 0 and 1 (the final value of the index has well defined bounds – normalization) and also that higher level on the dimensions indicates higher value of the financial inclusion index (monotonical). In summary, in order to compute
the FII we first compute X1 (the distance between X and O) and also X2 (the inverse
distance between X and W). This is demonstrated by the following formulae:
(2) 𝑋1 = √𝑑12+ 𝑑22+ ⋯ + 𝑑𝑛2 √𝑤12+ 𝑤22 + ⋯ + 𝑤𝑛2 (3) 𝑋2 = 1 −√(𝑤1− 𝑑1) 2+ (𝑤 2− 𝑑2)2+ ⋯ + (𝑤𝑛− 𝑑𝑛)2 √𝑤12+ 𝑤 22 + ⋯ + 𝑤𝑛2 being,
19
di: index for dimension i
wi: weight attached to the dimension i, where 0 ≤ wi ≤ 1
Then, the financial inclusion index (FII) will be calculated through the simple average between the two previous distances, thus integrating both distances from the worst point and the ideal point:
(4) 𝐹𝐼𝐼 = 1
2[𝑋1+ 𝑋2]
Simplifying, we have the following formula for the financial inclusion index:
(5) 𝐹𝐼𝐼 = 1 2 [ √𝑑12 + 𝑑22+ ⋯ + 𝑑𝑛2 √𝑤12+ 𝑤22+ ⋯ + 𝑤𝑛2 + 1 −√(𝑤1− 𝑑1) 2+ (𝑤 2− 𝑑2)2+ ⋯ + (𝑤𝑛− 𝑑𝑛)2 √𝑤12+ 𝑤22 + ⋯ + 𝑤𝑛2 ]
So now that we have a proper financial inclusion measure, is possible to find out which are the dimensions in which the countries with the lowest scores are worst on and conjugate it with possible Fintech solutions to enhance those said dimensions. The idea is to study different African countries that are at different stages in terms of
implementing Fintech within the economy and financial industry and see if is possible to find a trend or some kind of proof that through the use of Fintech a country can become more financial inclusion and improve its overall economic and financial performance.
20
04. Data
Now that we have a model to properly study financial inclusion and a set of dimensions to base this model on, we need to start looking at data.
To measure each one of the dimensions previously detailed, we will use a set of indicators of financial inclusion that we believe mirror the reality of that said
dimension. Since this study is about African countries, we first need to make sure that we get the necessary data to follow through with the model. It was used the World Bank data bank to find all the data necessary. Using the databases from “G20 Financial Inclusion Indicators”, “Millennium Development Goals” and “Global Financial Development” we were able to find indicators to measure each one of the dimensions chosen. Both the indicators and countries chosen were biased by the data availability, nevertheless it was always taken into consideration the final purpose of this paper for every decision made.
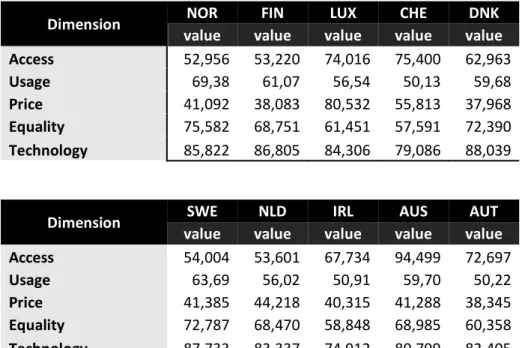
We ended up with 30 African countries to study: Algeria, Angola, Benin, Botswana, Burkina Faso, Burundi, Cameroon, Dem. Rep. Congo, Cote d'Ivoire, Arab Rep. Egypt, Gabon, Ghana, Guinea, Kenya, Madagascar, Malawi, Mali, Mauritius, Namibia, Niger, Nigeria, Rwanda, Senegal, South Africa, Sudan, Tanzania, Togo, Tunisia, Uganda and Zambia. After finding all the data about the African countries, the same data was collected for the top 10 countries in terms of financial inclusion according to the World Economic Forum: Norway, Luxembourg, Switzerland, Denmark, Sweden, Netherlands, Ireland, Australia, Austria and Finland. Being more developed countries, it was easier to find data about those countries, of course always using the same databases as reference. About the indicators, we have the following data across the dimensions chosen: 4 indicators for the access dimension, 8 indicators for the usage dimension, 6 indicators for the price dimension, 18 indicators for the equality dimension, and 6 indicators for the technology dimension (more information about the indicators used on figure 6). All the data is from 2014, since it was the most recent date we could find enough data to construct the desired model. Since we will be comparing the different countries among each other, most of the indicators chosen are percentages of the all population, to avoid scaling problems among all the countries which have very different levels of population. Since each dimension has more than one indicator associated, the final value of each dimension was chosen by following a simple average, giving the same weights to every single indicator.
21
Then, for each dimension we had to choose the upper and lower bound in order to properly use the first step of the methodology previously explained. Computation of the
FII involves a-priori fixating the value of the upper limit (Mi) and the lower limit (mi)
for each one of the dimensions chosen, so that the dimension indexes are normalized to
have values between 0 and wi. About the lower bound, one can easily choose 0 as its
value for all of the dimensions previously mentioned. About the upper bound, is not as straight forward. Since most of the indicators chosen were percentages, made it easier to choose 100 as the upper limit for some dimensions. However, in those dimensions which also included indicators that are not percentages, we decided to use the maximum value found for that indicator and see how that would affect the overall value of the dimension. That might cause a problem in the sense that it might be an outlier that can then distort the scale of the index. Looking at the data collected, and looking at the non-percentage indicators, we were able to find that 100 would be a good upper bound for all the dimensions chosen.
Finally, it was also necessary to choose the weight given to each one of the dimensions for the calculations. For simplification, we considered all dimensions to be equally
important in measuring the inclusiveness of a financial system, therefore having wi = 1
for all i (dimensions). In this case, the ideal situation will then be represented by the point W = (1, 1, 1, …, 1) in the n-dimensional space and the final formula for FII will be: (6) 𝐹𝐼𝐼 = 1 2 [ √𝑑12 + 𝑑22+ ⋯ + 𝑑𝑛2 √𝑛 + 1 − √(1 − 𝑑1)2+ (1 − 𝑑2)2+ ⋯ + (1 − 𝑑𝑛)2 √𝑛 ] After finding the FII for each country (the 30 African countries plus the 10 most
financially included countries), we tried to find the relative weights necessary in each dimension to always get and optimal value for the FII, this is, to find the optimal
weights of the dimensions in order to get FII equal to 1 (optimal weights analysis). This was made to every single one of the countries in order to find a trend about the relative importance of each dimensions in different tiers of financially included countries.
22
05. Results’ Analysis
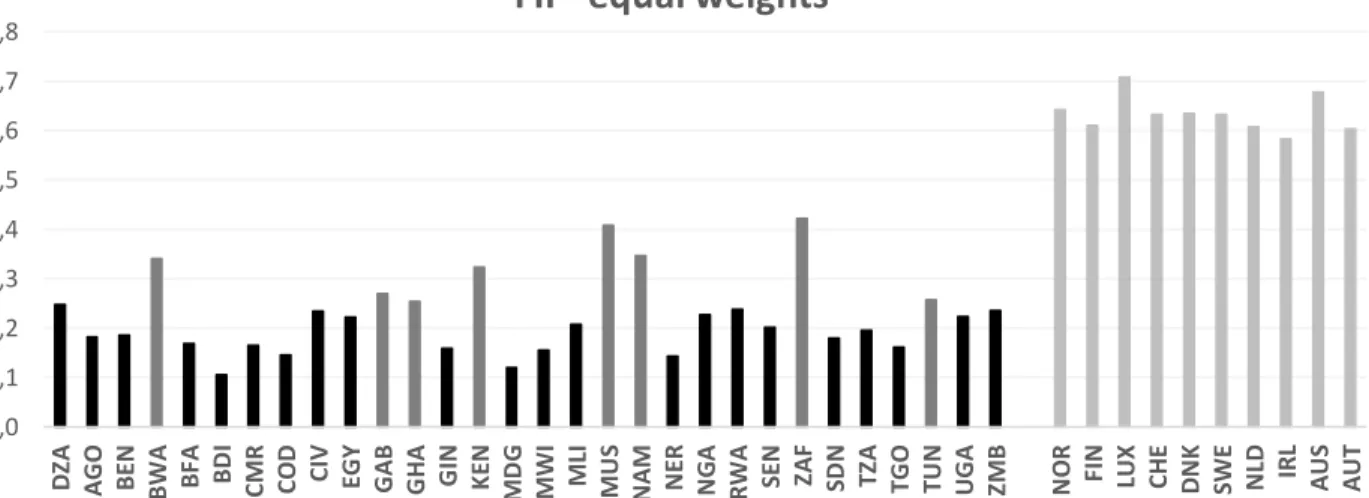
Now that we have been through the methodology and seen in detail the model to the calculation of the FII, we have to use the data collected to apply it to the several countries selected. In figure 1 (more detail in figure 3) we can see the value of the financial inclusion index (FII) for each one of the countries selected.
As expected, the most financially included countries present a much higher value than the remaining of the countries. Among them, the lowest value is for Ireland, with a FII of 0.583, and the highest is Luxembourg, with a value of 0.708. The average FII for this group of countries is around 0.633, with a standard deviation of 0.037. This shows that there is not a lot of dispersion around the mean value of the FII.
As for the African countries, they present different levels of financial inclusion. Although most of them have much lower levels for the FII, we can find some outliers that have the value of their FII in the middle of the scale. The highest value for the FII is from South Africa with 0.422, whilst the lowest value is 0.106 belonging to Burundi. The average FII in this case is 0.224, having a standard deviation of 0.079. In this case there are more dispersion among the values of the FII. For this reason, maybe there is value in subdividing the African countries into two tiers of countries, the lower FII countries (values between 0.1 and 0.25) and the medium FII countries (value between 0.25 and 0.45) – the division can be seen in figure 1 by the different tones of color and was done based on the average results obtained. By doing this we decrease the standard deviation of both groups and can possible take more conclusions later on about those countries.
Figure 1 Values for the FII using equal weights for the dimensions
0,0 0,1 0,2 0,3 0,4 0,5 0,6 0,7 0,8 D ZA A G O B EN B W A B FA BDI C M R C O D C IV EG Y G A B G H A G IN K EN M D G M W I M LI M U S N A M N ER N G A R W A SEN ZA F SD N TZ A TG O TU N U G A ZM B N O R FIN LUX CHE DNK SW E N LD IRL A U S A U T
23
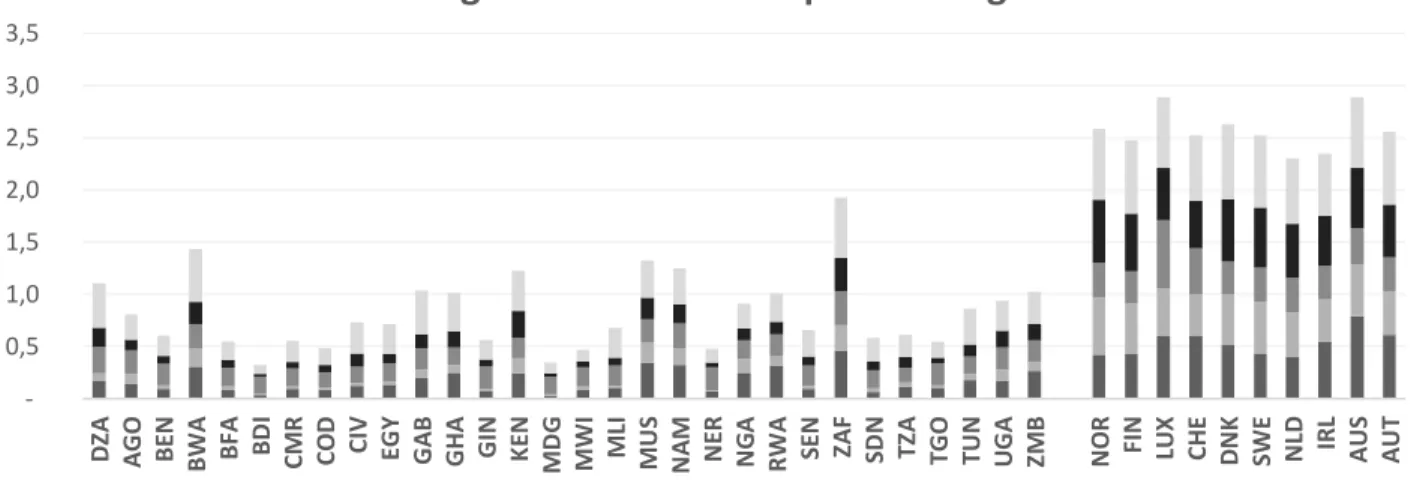
After looking at the simple FII values, we then looked at the optimal weights. For each country selected, we tried to see what would be the optimal weights, in order to have an FII equal to 1. The results are demonstrated in figure 2 below (more detail in figure 4):
Figure 2 Distribution of weights to achieve optimal FII
The biggest difference that we can see between the African countries weight distribution and the top financially included countries, is the overall value of the weights. The more financially included not only present higher values for the weights, but also have the values for all the dimensions more similar to each other. On the other hand, the African countries not only have much lower values for each one of the weights, but also have a bigger dispersion among them. This being said, there are some trends that we can see in both groups. In both cases that are a clear ranking for the five dimensions studied.
In the case of the more financially included countries, the bigger weight is for the Technology dimension and the lowest weight is for the Price dimension. The remaining dimensions do not follow a particular rank. All of the weights have a value between 0.3 and 0.8, being mostly around the mean. This shows that in those cases, the dimensions all have a bigger impact and a higher weight on the FII.
For the African countries, all the dimensions present weights between 0.01 and 0.6, being the big majority of them below 0.25. This shows that for them the dimensions do not present such higher values and therefore need to be more diluted by the weights to reach the optimal FII. In this group the ranking of the dimensions is even more clear, being the following: Technology, Price, Access, Equality and Usage. Although the technology
0,5 1,0 1,5 2,0 2,5 3,0 3,5 D ZA A G O B EN B W A B FA BDI CM R C O D C IV EG Y G A B G H A G IN K EN M D G M W I M LI M U S N A M N ER N G A R W A SEN ZA F SD N TZ A TG O TU N U G A ZM B N O R FIN LUX CHE DNK SWE NLD IRL AUS A U T
Weights distribution - optimal weights
24
dimension happens to be the most important on, as in the case of the most financially included countries, the remaining of the dimensions have a very different rank. In the case of the African countries, if we look at the two tiers created during the calculation of the FII with equal weights (the lower FII countries and the medium FII countries) there is not much significant difference between them. The biggest difference is that those countries have higher weights, especially among the Technology dimension, where they all have weights above 0.35.
Considering this information, we can see that there is a clear need for the African countries to increase their values in all dimensions, but with especially attention to the Equality and Usage dimensions.
Now that we have some trends that we can look to, it is time to see how we can use this knowledge to create some measures and give recommendations to improve the levels of financial inclusion amongst African countries.
25
06. Limitations and Further investigation
No matter what the methodology chosen there will always be some limitations on the model. In here, we can find some tight from the start, when we define what is financial inclusion. By narrowing it down to only one definition, even if a multidimensional one like is the case, we may be narrowing it down too much for such a complex issue. For example, the institutional set up of the countries can make them look at financial inclusion in very different ways, and value some targeted variables or indicators differently, but to compare it we are always using the same approach, regardless of the country in question.
The methodology proposed, although it is very comprehensive, simple to compute and multidimensional also has its limitations. Mathematically it satisfies very important properties, as detailed before, however it is very dependent on the availability of data. Also, there is a lot of room for interpretation of values, especially when choosing the dimensions and then choosing the indicators that better portray those said dimensions. Then there is also the chosen of the weights, which in this case was minimized by using a simplified approach of equal weights, however there might be other approaches that show results closer to reality.
If we look deeper into the model chosen, we can see that it works better with fewer dimensions, which in our case it was not a problem since we only wanted to study six dimensions. However, if we wanted to expand our model and look at it based on each one of the indicators chosen, the model would not perform as well. There is a evident tradeoff between adding more dimensions and their importance for the model. Due to the concavity of the FII, additional dimensions have a decreasing effect. If the country we are studying has a lower (higher) level for the FII, the impact of adding another dimension will be greater (smaller).
The model is also very sensitive to the upper and lower bound defined, since having slight changes have a big impact on the overall value of the FII. There is why it
becomes a risk to choose the bounds for each dimension. However, in this paper, since there were mostly used percentage-based indicators, the choosing of the limits was more straight forward than it would be otherwise.
About our approach for the optimal weights, since we are only looking into a single point in time, the results might not lead to strong conclusions, since it is possible that those values have great changes overtime. Also, although significant, the sample of
26
countries chosen might not be representative of the entire reality, distorting the results and the conclusions reached.
Then there are clear limitations in terms of the decisions made on how to calculate the values of each dimension. Firstly, because we only used data from 2014, which probably is already somewhat outdated considering several actions and measures that were taken by some of the countries analyzed (as it will be shown in chapter 09. Real examples). Second, the decision of, in each dimension, giving the same weight to every single indicator may not be the most accurate.
Looking further into the future, if we were to continue this study, would first try to use more recent data for the study. Also, look into more dimensions and how different indicators could be used to show them. Basically, focus more on which indicators are the best to use, what is the right weight that should be given to each one of the
indicators to find the most accurate value for each dimension, and compare this values overtime, seeing the evolution on the countries situation whilst they invest more in financial inclusion actions and in fintech.
27
07. Recommendations
As it was seen previously, there is a need for African countries to improve in all dimensions of financial inclusion, giving especial attention to the dimensions of Usage and Equality. A positive thing that they already have is their over performance in the dimension of Technology in comparison with the other, which might serve as a tool to increase the overall levels of financial inclusion. Regarding this, one of the best tools
that can help in this issue is investment in fintechs.As the digital revolution prevails,
with internet and smartphones on the front of the change, we should expect a stronger role from the tech giants and social media in all dimension across the entire globe. To raise the levels of every dimension, there are a few measures that can be taken by those countries. They must build new capabilities and enter into new business partnerships in the area where they are unable to develop the capabilities in-house. These companies need to start early and target a broader spectrum of the population, gaining also from the first-mover advantage. Disruptors such as mobile phone operators and technology companies need to create new infrastructures within the financial system or, alternatively, enter in partnerships with traditional banks and insurance
companies for both economic and regulatory reasons.A key factor will be the degree of
interoperability of systems across banking, telecom and internet.
Mobile network operators will lead the dematerialization of financial services and products in Africa. They have an advantage in acquiring users and creating a sustainable strategy not only for the company but also for the country’s financial system. Especially when compared with other types of companies more based on e-commerce and social media for example. Also, there has been a significant increase in the smartphone penetration (more prominent within the Android market), which might increase the importance of mobile networks, but switching from the more traditional one to
smartphones and more advanced technologies.This dematerialization will occur much
faster in Africa than it would in more developed economies because traditional banks are in a much weaker position and still do not have widespread branches that reached the population. This being said, banks will need to adjust through dematerialized channels if they want to be able to reach both their existing clients and especially the new ones. Nevertheless, as a cost analysis showed by Genesis Analytics shows, in many areas mobile payments are still expensive for small transactions, which characterize the majority of population and businesses. And with digital payments, tax authorities will
28
also more easily track traders and businesses, making them more reluctant to its use. For those reasons, cash is still likely to continue to prevail in daily transactions.
Convergence of products, services and infrastructures will also be a focal point in leading change for financial inclusion. Convergence is also likely because of regulation. Convergence will take many different forms: create their own bank, acquire existing banks, enter in joint ventures or contractual partnerships, integrate products from fintech companies. For example, we can already see it across all major banks that now offer bank-insurance products, and on large insurers that have their bank affiliate. This trend will certainly continue, trickling down to smaller banks and insurance companies. In the future, we expect to see even more business to converge, especially among digital business (social media, e-commerce, education, entertainment, insurance, banking, health, etc.) and also public services.
Regulation varies a lot from country to country, so it makes it very hard to talk about regulation across all African countries as a whole. This being said, there are a number of observations that can be applied to this entire area of study. By leveraging digital
financial services in pursuit of financial inclusion objectives, we need to beware of a whole new set of risks, such as those coming from unfair lending practices, analysis of big data and increasing systemic vulnerabilities due to threats of cybersecurity. The regulatory task needs to consider these issues, in view not only of the financial side of the situations but also the digital side of it, becoming with that more complex and challenging. But if the digital side is also heavily regulated, there are less space for innovation and to discover what might work or not for each economy. There are a few key elements that we can consider to balance innovation with regulation, with still pursuing the final goal of financial inclusion: build a knowledge repository for regulators, enable test-and-learn approaches, provide additional regulatory guidance, facilitate peer learning knowledge sharing, enhance Public Private Dialogue (PPD) and global dialogue and incorporate fintech into National Financial Inclusion Strategies. Finance is often labeled as boring and hard for most people, especially for those who do not have access to higher levels of education, and with that positive financial decisions remain difficult to take and to incorporate into day-to-day life. Gamification is a process of integrating dame-like actions into tasks, and this might be an important tool in increasing financial literacy and therefore an important step towards higher levels of financial inclusion. By including gamification processes into financial services (in a
29
moderate and properly thought way) it can be used as an educational tool to inform people about the financial products and services they are using or may use in the future. In here, we were able to show a set of important measures and concepts that need to be kept in mind when defining the actions to deal with the problem of financial inclusion: interoperability, dematerialization (starting with mobile and then possibly expanding it to other technologies), convergence (of products, services and infrastructures),
regulation and gamification (as a tool for financial literacy).
We believe that these points will mostly help with increasing the usage of financial services and products across the population and also making them more approachable across all tiers of the population, especially for the most marginalized groups (women, poorest people, etc.). With this we are addressing the two dimensions that were
identified as more problematic in previous chapters, but also helping increasing overall financial inclusion levels on all dimensions.
In the end, we believe that is important to keep gathering data overtime and keep analyzing these countries in the five selected dimensions to see if they are improving and if the measures taken are working or not. It would also be interesting to relate the FII with other information like GDP or a Human Development Index. For internal policy decisions, countries could focus on regional FII as it complements the national wide one and helps them see where to focus their attention in each action taken. Although changes are happening and are very visible, it will still take time for a meaningful change to occur. We need to remember that business models that today fundamentally rely on internet access, availability of data, smartphones, platforms such as Android or iOS, the rise of social media, e-commerce, and the broad usage of digital currencies and transactions will have a harder time succeeding in Africa than in
developing countries. More than that, scaling up in Africa is far more difficult than it is in more developed economies. Rapidly achieving scale is not easy in Africa because markets are fragmented and small. Many other problems also accumulate to that such as limited purchasing power, mostly small addressable market, poor access to internet, and many others.
30
08. Real examples
Many countries have been introducing financial inclusion measures and actions within their economy and have been scaling and growing due to that. A big majority of those actions have their basis in Fintech, taking advantage of the concepts mentioned in the previous chapter. In here we will be exploring some good examples of countries who have taken action in terms of financial inclusion and taken advantage of their resources, mostly on a basis of fintech.
Kenya
Kenya is today considered one of the best in terms of improving financial inclusion. According to a survey from InterMedia Financial Inclusion Insights in September 2015, we find many points that support that financial inclusion in expanding and deepening, especially in what relates with digital products. And if we look at more recent findings, we get a FinAccess of 2016, this country has experienced an increase of 50 percent in financial inclusion, only in the last decade. A big part of this success is attributed to its mobile money network, which presents remarkably high adoption rates, being even considered one of the most mature mobile money market in the entire globe, mostly thanks to the Safaricom’s M-Pesa service.
For a long time, Kenya has been making high-level commitments in what regards financial inclusion: the Maya Declaration in 2011, the foundation of the Better Than Cash Alliance, the Retirement Benefits Authority of Kenya, the Financial Sector
Deepening Trust (FSD Kenya) and the FinMark Trust. TheKenya’s Vision 2030
National Development Strategy set a target to decrease the percentage of population that does not have access to finance, expecting with that take a big step in reducing the levels of financial exclusion in the country. Additionally, and with the same objective, some key priorities of the Central Bank of Kenya were defined, such as lowering the risk of fraud and promote competition and interoperability.
The government launched in 2014 a Government Digital Payments program which allows individuals to pay for public services, like the passport or the driver’s licence, through a digital payment online.
In order to minimize service unavailability, lower quality and enhance the speed of its mobile services, Kenya made an investment on infrastructure in 2015 to migrate M-Pesa server from Germany to Kenya.
31
Many more partnerships and actions were taken by the Kenya government and entities, such as the partnership between Safaricom and Kenya Commercial Bank (KCB) in March 2015 (led to a gradual reach of the “KCB M-PESA” mobile phone-based savings and loan account), the order from the Competition Authority of Kenya in August 2015 to promote more transparency on it payment platform (allows customers to buy
products at commercial outlets and pay their bills through M-PESA accounts) and creation of guidelines on consumer protection in January 2013. All of those show the great commitment within Kenya to improve financial inclusion level and reach it entire population through digital platforms and services.
South Africa
South Africa stands out by being one of the countries that shows a string performance, as it can be seen in the FDIP (Financial and Digital Inclusion Project) scorecard from 2016. This is mainly due to its high levels of account ownership and levels of mobile subscription and capacity.
South Africa, unlike many of the other countries here described, does not have a clear strategy in what regards financial exclusion, not even being part of the Maya
Declaration. Despite that, it still has financial inclusion as a crucial objective. In 2015, South Africa government proposed to create a national-wide financial inclusion policy, a forum to discuss financial inclusion actions and situation, and a financial inclusion strategy to put in practice nationally. All those initiatives are supposedly being build upon financial access themes established in policy documents previously used (such as the Financial Sector Code and the National Development Plan).
Related to infrastructures, unlike many other FDIP countries, South Africa actually possesses a robust banking infrastructure, therefore having a significant amount of opportunities to expand it and with that improve financial inclusion levels.
Uganda
To date, Uganda mobile money networks were very well received by the population, being even in 2014 the second highest in terms of mobile money account ownership among FDIP countries. There was however a problem during the 2016 presidential elections which led to a total shutdown of the mobile money services on those days,
32
leading to a decrease of confidence in those services. This decrease in confidence can also be related to recent occurrences of fraud.
In Uganda, have been done several regulatory efforts in order to promote the use of financial systems and expand them, aiding then in the proliferation of mobile money. The government also created joint working group on Mobile Money Financial Services between the Bank of Uganda and the Uganda Communications Commission and developed a set of guidelines on mobile money services, which shows its commitment on the matter. In 2012, they launched a Financial Inclusion Project to increase the access to financial services and empower the its users to think rationally and make considerate decisions in what concerns their personal finances, not only to grow
individually but also to boost economic growth of the nation. This last initiative is based on fours crucial pillars of financial inclusion: financial literacy, financial consumer protection, financial innovations, and financial services data and measurement. Malawi
In Malawi, they face many challenges in what regards increasing levels of financial inclusion, such as its highly agricultural population and limited digital infrastructure. This being said, the government has made considerate efforts to help in this issue by developing its payment system infrastructure, even though adoption of electronic payments still remains low. They are highly committed to promote mobile payment solutions, but they need to first address their main issues in order for individual can truly engage with formal financial services: low penetration of physical banking infrastructure, limited mobile capacity levels and a lack of interoperability.
The Reserve Bank of Malawi, as part of its commitment to the goal of higher financial inclusion, assembled a group of quantifiable goals and targets to mainly increase the percentage of banked adults. In this regard, Malawi has been especially recognized for having a strategy that revolves around increasing financial inclusion levels for women, having specific goals in this matter.
Malawi strategy also focus many of its objectives in increasing financial literacy. In this regard, they created a baseline survey on financial literacy to assess this specific issue, developed a financial literacy strategy and established a national financial literacy network. Its financial literacy strategy also focuses on the importance of having
consumer protection showing related goals such as creating public awareness campaigns and writing and endorsing a bill of rights for consumers.
33
Zambia
Zambia faces a lot of challenges being a mostly rural economy with a lot of poverty and lacking the necessary infrastructures, but their investment on developing their mobile money environment, also through government support, has made them increase the
levels of adoption of formal financial services. The amount of mobile money agents in
this economy has already exceeded significantly the number of bank branches
Even though it is clear that has been made progress on the goal of financial inclusion, there are still many disparities across demographics, such as female inequality. Factors like cultural customs, legal barriers and lower levels of education (especially in what concerns financial literacy) help these disparities. This being said, government authorities, such as the Bank of Zambia, are making efforts and creating measures to reduce this problem.
In 2015 was launched the World Bank Financial Inclusion Support Framework
program, which recognized a set of actions to promote a more inclusive finance system: developing a dedicated national financial inclusion strategy, building financial
capability, and improving financial infrastructure. In that regard, a group of authorities (Bank of Zambia, Pensions and Insurance Authority, Securities and Exchange
Commission, the Ministry of Finance and the World Bank) are together being
coordinated in hopes to define a new financial inclusion strategy and adapting it along the way.
The Zambia government has also gain recognition for their efforts to promote financial inclusion to women, through a set of targets and the formation of a Women’s Financial Inclusion Taskforce.
Rwanda
Rwanda has been making a lot of developments in its country, with especially attention in this case to its mobile sector. They implemented mobile money platforms and
expanded their community savings and credit cooperatives, agent banking locations, and mobile money outlets. The country made a big commitment in digital systems, even stating that they wanted to “digitize everything” by June 2016. But even though there has been great progress, there is still a lot of room for improvement and take advantage of opportunities.
34
In 2006 was launched the Rwandan Financial Sector Development Program as a key constituent of the enactment of the Vision 2020 Economic Development and Poverty Reduction Strategy of Rwanda. This program created action plans to solidify three basis pillars: financial inclusion, financial education and financial literacy. Among its goals we have the enhancing of access and affordability of financial services and the
development of a proper policy, legal, and regulatory framework for nonbank financial organizations. Later on, in 2014, but still as a part of its internal strategy, they
introduced a national financial inclusion task force to organize all financial inclusion actions and initiatives.
Rwanda’s regulatory environment is also very recognized by enhancing digital financial inclusion, being enables several entities (bank and nonbank providers) to offer mobile financial services. The country showed incredible levels of growth in the usage of electronic and mobile payments. They did it by focusing their regulatory approach more on the nature of the products and services and less on the institutions itself.
In 2015 Rwanda became the second country in Africa to implement mobile money platform interoperability, through a partnership between Airtel Rwanda and Tigo Rwanda that test interoperability between its money and services. Then, in 2016, during the World Economic Forum on Africa, Rwanda’s Ministry of Finance and Economic Planning signed an agreement with the Ericsson Group for the introduction of a nationwide interoperability switch. This solution, grounded on the Ericsson
M-Commerce Interconnect platform, will connect many financial service providers within the country and also allow users to engage in a range of digital payments across all financial platforms and service providers, all in real time.
And these are just some among many more examples of measures and actions that are being made by African countries through digital systems and fintech to enhance financial inclusions across their entire economy and population.
35
09. Conclusion
This paper had as its main objective to identify the main areas regarding financial inclusion that needed more improvement within African countries and offer some solutions to that said problem. Improving financial inclusion requires, first of all, measuring it and in that regard, the society has made an enormous progress over the past few years in this endeavor. In this paper, we propose a Financial Inclusion Index (FII) that is easily understandable and to compute, all from a multidimensional
perspective, much like other development indexes more well-known. Through the use of the FII one can study and compare the extent of financial inclusion across different areas and to monitor its progress within the economy overtime. In this paper, especially due to data availability constraints, we only used it to look at financial inclusion at a specific point in time and to compare various economies on a country level, but it could also be used to look at other levels of economic aggregation (for example continent, city, region) and to look at a progress through time.
It is always to keep in mind that there is often a serious lack of data, especially amongst less developed areas where is more difficult to ensure the quality and accuracy of the data, and while there is a big temptation to simplify and summarize the information available and the dimensions studied into one single main indicator, that does not provide a full picture of the situation. A better option is to include a set of several indicators that are able to capture different parts of the dimension, which was what we tried to do by creating dimensions each one completed by a set of chosen indicators. This paper is only a small step with the objective of properly measuring financial inclusion in Africa, and there is still much more that can be done. Improvements and technical innovations to the index are always possible and recommended, but bear in mind that there is a big constraint related to the availability of data, as mentioned before.
It is also important to look beyond absolute values of indicators and of financial
inclusion and benchmark them properly in order to assess the progress made and gauge the effect of policy reforms. The FII can be then used as a communication tool like many other development indexes and beware the public of the achievements and outcomes of the policies taken place, showing them what has been the progress