1
A Work Project, presented as part of the requirements for the Award of a Master Degree in Management from the NOVA – School of Business and Economics.
Determinants of Banking Profitability:
Explaining the Nordic-Southern European Divide
Pedro Miguel Amaral Patrício
Student #3787
A Project carried out on the Master’s in Management Program, under the supervision of: Professor Leonor Ferreira
Professor Fernando Cardoso
2
Abstract
This paper explains the profitability gap between the better performing Nordic banks and their Southern European counterparts. The research, focused on the 2010-2017 period, ascertains that there are substantial differences in corporate governance mechanisms between the groups’ largest banks, but these either are non-significant or show mixed results when correlated with profitability. Additionally, the gap is partially explained by the higher Southern effective tax rates coupled with an increased focus on retail banking activity in the Nordics, but liquidity, proxied by total deposits over total assets, was found to positively influence profitability and to be higher in the South.
Key words: Banks, Financial Sector, Europe, Profitability, Corporate Governance, Liquidity.
1. Introduction
Measuring profitability, that is, the degree to which a business or activity yields return, is vital when assessing both a company’s current performance and its prospects. Eleven years after the 2007 financial crisis the European financial system has bounced back rather successfully. Still, recently there have been growing concerns regarding its health as governmental deficits and debts reach harmful levels, non-performing loans pile up in some major European banking institutions and the European Union’s unity is tested by Brexit. Upon a closer analysis, however, there is a clear divide between the Nordic and Southern European banking institutions. This difference has not yet been fully explained, with the Nordic banks consistently faring generally much better than their Southern counterparts. This divide is very noticeable when analyzing European banks’ profitability ratios1, as it is shown in Figure 1.
1 Several ratios offer different measures of profitability and this paper utilizes the ROA ratio, Return on Assets, given by equation: 𝑁𝑒𝑡 𝐼𝑛𝑐𝑜𝑚𝑒 𝑇𝑜𝑡𝑎𝑙 𝐴𝑠𝑠𝑒𝑡𝑠⁄ , with Net Income being the company’s total earnings net of costs of doing business, depreciation, interest, taxes and other expenses, and Total Assets being the total economic value of all the resources owned by the business.
3 Figure 1 – European banking sector average profitability (ROA %), Nordic vs Southern countries comparison (2007 S2-2018 S1), source: Bloomberg terminal, IMF FSI indicators
Explaining this difference and finding it’s causes is essential to mend the performance gap between Nordic and Southern European banks which is crucial for the stability and health of the Southern European economies and for the European Union at large due to the inter-connectiveness of its member states’ markets. Further integration in the Union would also be greatly eased with increased economic homogeneity.
Past research into this issue focused on macroeconomic differences as explanatory variables (Sinn; D'Acunto & Oldrini, 2013), along with balance sheet vulnerabilities, with a special emphasis on non-performing loans, and business model differences (Soares; 2017, Detragiache; Tressel & Turk-Ariss, 2018), but, so far, the corporate governance differences have been neglected despite the fact that decisions which impact operating profitability are taken by managers and other members of corporate governing bodies. When in place and complying with the core principles for banking supervision, effective corporate governance mechanisms aid in creating value by granting stability, operational efficiency and sustainable growth (OECD, 2015). With large cultural differences between the Nordic and Southern European countries, it is reasonable to assume that there are significant differences in the corporate governance mechanisms in use between both groups. As such, this paper is concerned with building a sturdier model that explains the existing performance gap between Nordic and
-0,5 0 0,5 1 1,5 2010 S1 2010 S2 2011 S1 2011 S2 2012 S1 2012 S2 2013 S1 2013 S2 2014 S1 2014 S2 2015 S1 2015 S2 2016 S1 2016 S2 2017 S1 2017 S2 2018 S1 RO A (%) Timeline (2010 S1 - 2018 S1)
European Banking Average Profitability (ROA %)
Nordic vs Southern
Avg of the Southern Median ROAs (Portugal, Spain, France, Italy) Avg of the Nordic Median ROAs (Norway, Denmark, Sweden, Finland)
4
Southern European banks by incorporating corporate governance mechanisms as explanatory variables.
The paper proceeds as follow: Section 2 introduces the key concepts used along the paper and the theoretical background behind it. Section 3 reviews the literature about determinants of profitability in the banking sector. Section 4 describes the methodology employed, sources of the data used along with variables and their proxies, the sample and it outlines the development of the research questions. Section 5 discusses the statistical analysis’ results along with obtained insights regarding the research questions while Section 6 presents concluding remarks and provides suggestions for future research.
2. Theoretical and Contextual Background
2.1. Key Concepts: Profitability, Corporate Governance and Liquidity
Profitability is commonly defined as the degree to which a business or activity yields returns
that surpass its expenses in a given period of time and in relation to the size of the business. Several ratios offer different measures of profitability, some more appropriate than others varying with the purpose of the analysis, to whom it addresses and the specificities of the sector. This paper utilizes the ROA, Return on Assets, ratio, given by equation [1]:
𝑅𝑂𝐴 = 𝑁𝑒𝑡 𝐼𝑛𝑐𝑜𝑚𝑒 𝑇𝑜𝑡𝑎𝑙 𝐴𝑠𝑠𝑒𝑡𝑠
[1]
With Net Income being the company’s total earnings net of costs of doing business, depreciation, interest, taxes and other expenses, and Total Assets being the total economic value of all the resources owned by the business. In the banking industry, the use of Net Income in detriment of the Earnings Before Interest & Taxes is justified by the difficulty in separating the debt interest from the interest contained in the Total Interest Expense account that is part of the
5
Financial Margin. For this reason, the ROA with Net Income in its numerator is the preferred method of measuring asset profitability.
Corporate Governance encompasses the mechanisms, processes and relations through
which firms are controlled and directed (Shailer, 2004) and it involves striking a balance between the interests of the companies’ various stakeholders, which range from their shareholders, management and employees to the communities they operate in and their respective governments. These mechanisms reach the various components of management, including action planning, the decision-making process, internal controls, performance measurement and corporate disclosure. It is noteworthy that while the concepts of management and corporate governance are sometimes, and incorrectly, used interchangeably, the latter puts an emphasis on the examination of underlying purpose and legitimacy (McRitchie, 1999).
Effective Corporate Governance is tied to business integrity and market confidence, and it requires “a sound legal, regulatory and institutional framework that market participants can rely on when they establish their private contractual obligations” (OECD, 2015: 13). To foster successful Corporate Governance, in 1999 the OECD developed a series of principles intended to guide policy makers, and it kept updating them up until 2015. Still, there are several different
Corporate Governance models in use that vary in power concentration and rigidness, from the
strict Japanese model to the decentralized Anglo-Saxon one. In Europe, three distinct models are dominant: the Anglo-Saxon model, the Continental model, and the Nordic one which differs from both in some respects.
Liquidity is a concept applied to assets which describes the easiness with which they can
be bought or sold without affecting their prices. However, it is important to distinguish solvency from liquidity. A solvent firm effectively owns more than it owes, implying its total assets have
6
a positive net worth, i.e. in case of liquidation2 there would be shareholders that receive back at least a portion of their investments in the business. Despite their difference, both liquidity and
solvency are important indicators of a firm’s overall financial health and measuring both
requires the use of distinct ratios.
To see how both corporate governance and liquidity can, in theory, change ROA’s value, we can further break down the ratio through the Dupont method3 as shown in equations [2] and [3]: 𝑅𝑂𝐴 =𝑁𝑒𝑡 𝐼𝑛𝑐𝑜𝑚𝑒 𝐸𝐵𝑇4 × 𝐸𝐵𝑇 𝑂𝑝𝑒𝑟𝑎𝑡𝑖𝑜𝑛𝑎𝑙 𝑅𝑒𝑣𝑒𝑛𝑢𝑒5× 𝑂𝑝𝑒𝑟𝑎𝑡𝑖𝑜𝑛𝑎𝑙 𝑅𝑒𝑣𝑒𝑛𝑢𝑒 𝑁𝑒𝑡 𝐼𝑛𝑡𝑒𝑟𝑒𝑠𝑡 𝐼𝑛𝑐𝑜𝑚𝑒6× 𝑁𝑒𝑡 𝐼𝑛𝑡𝑒𝑟𝑒𝑠𝑡 𝐼𝑛𝑐𝑜𝑚𝑒 𝑇𝑜𝑡𝑎𝑙 𝐴𝑠𝑠𝑒𝑡𝑠 [2] 𝑅𝑂𝐴 = 𝐹𝑖𝑠𝑐𝑎𝑙 𝐸𝑓𝑓𝑒𝑐𝑡 × 𝐹𝑖𝑥𝑒𝑑 𝐶𝑜𝑠𝑡𝑠 𝐸𝑓𝑓𝑒𝑐𝑡 × 𝑅𝑖𝑠𝑘 𝑀𝑎𝑛𝑎𝑔𝑒𝑚𝑒𝑛𝑡 & 𝑃𝑟𝑜𝑣𝑖𝑠𝑖𝑜𝑛 𝑜𝑓 𝑆𝑒𝑟𝑣𝑖𝑐𝑒𝑠 𝐸𝑓𝑓𝑒𝑐𝑡 × 𝐼𝑛𝑡𝑒𝑟𝑚𝑒𝑑𝑖𝑎𝑡𝑖𝑜𝑛 𝐴𝑠𝑠𝑒𝑡 𝐸𝑓𝑓𝑖𝑐𝑖𝑒𝑛𝑐𝑦 [3]
Differences in liquidity should pose a two-sided effect on profitability. On one hand, less liquid assets have higher yields while on the other having a higher liquidity lowers debt interest rates for leveraged firms, in accordance to the expected bankruptcy hypothesis (Berger, 1995) which will be further elaborated upon in section 3. As such, all ratios of the decomposed ROA, excluding the Fixed Costs Effect, should be altered by liquidity. As for how corporate governance may impact profitability, for instance, bigger boards and more numerous committees increase personnel expenses and directly increase the Fixed Costs Effect, but these may also imply a larger knowledge pool and better managerial decisions which could increase
2 In finance, liquidation is a process through which a business is ended by dismantling itself and distributing the assets to claimants. Whoever has invested assets in the firm holds a claim to them, but its priority varies according to the investors’ status. Debtholders are first in line, with more senior claims who have collateral on loans to the business taking precedence followed by unsecured creditors, and shareholders follow second, where preferred stockholders take precedence over the remaining ones.
3 Developed in the 1920s, it decomposes the ROE into several components that determine its value: the net margin, asset turnover ratio and the equity multiplier. Through basic calculus, it showed how closely related ROE and ROA are by concluding that ROE = (1 – effective tax rate) ROA x Equity Multiplier (total assets / shareholder’s equity). The final part of the equation is often designated by the term financial leverage.
4 EBT stands for Earnings Before Taxes.
5 Operational Revenue is the sum of interest and financial activity revenues net of interest expenses, fees and commissions.
7
revenues and positively alter Risk Management & Provision of Services Effect and the Asset Intermediation Efficiency.
2.2. Contextual Framework: Corporate Governance in Europe
Europe has a very developed financial sector7 with many European cities acting as important financial hubs and it contains some of the largest banks in the world, counting 8 in the top 20 biggest asset holding banks worldwide list in 20188. The European corporate landscape uses three main governance models. The Continental and Anglo-Saxon models dominate in Southern Europe. In Portugal and Italy, listed companies overwhelmingly use one of the two. Spanish limited companies are lawfully obligated to utilize the Anglo-Saxon model while in France the law allows for either, but the Anglo-Saxon model is by far the most adopted among listed firms. As for the Nordic countries, the Nordic model is dominant, as the name would suggest (Gerner-Beuerle, Paech, Schuster, 2013). While these designations of corporate governance models encompass various groups of countries, there are still differences in the practiced governance within these groups as a consequence of legal, cultural and historical differences among the member countries, so these model groups should not be interpreted as uniform agglomerates but rather as groupings of firms with similar governance structures in place. Since no banks utilizing the Two-tiered model were included in the sample9, a detailed description of it was excluded from the paper’s main body and included as an appendix (refer to appendix 2).
The Anglo-Saxon model, sometimes referred to as Anglo-American model, is also designated as the One-tier Board System since firms operating under it do so under unitary boards consisting of both executive and non-executive directors who, as a group, are
7 For a more detailed description of the banking industry and its European segment refer to appendix 1.
8 Source: FXSSI website, TOP 20 Largest World Banks in 2018 by Total Assets page, available at https://fxssi.com/top-20-largest-world-banks-in-current-year [Accessed 23 October 2018].
9 The decision to exclude these banks from the sample resulted from there only being one of them that dodged all the exclusion criteria. Including only one two-tiered bank in the sample would not constitute a sufficient representation of the governance model to draw conclusions from.
8
responsible for the entirety of the firms’ activities, while non-executives should outnumber executives and hold posts of greater importance like the audit and compensation committees to avoid conflicts of interest as they are independent from the CEO. The risk of conflicts of interest arising is usually mitigated through the creation of committees which effectively separates the board’s various functions. Directors are elected by the shareholders at the annual general meeting and an executive director may be appointed by the board when the term of office of another director terminates which prevents the board from becoming paralyzed, but the co-optation of a director needs to be confirmed at the following shareholders general meeting. The directors’ term durations usually vary from three to six years (ecoDa; International Finance Corporation, 2015).
As for the Nordic model, it resembles the aforementioned model while differing in some respects. It’s structure is defined by four main pillars:”(i) Supremacy of the general meeting to decide any matters that do not expressly fall within the exclusive competence of any other company organ; (ii) A non-executive board of directors appointed by, and fully subordinated to, the shareholders in general meeting; (iii) An executive management function appointed by, and fully subordinate to, the board; and (iv) A statutory auditor appointed by, and reporting back primarily to, the shareholders in general meeting.” (Lekvall, 2014: 53). Therefore, the model’s structure resembles the Two-Tiered one in that the oversight and the executive functions are performed by separated boards in which participation in one automatically excludes one from the other while incorporating the executive and non-executive board member distinction from the one-tier model (see appendix 3 for a graphical representation). It also differs from both by granting the board with extended powers by granting it the responsibility for the firm’s strategy, organization, financial structure, risk management oversight and internal controls, leaving the day-to-day management to the CEO. Most of the board members are obligated to be independent of the company, while it is common for employees to appoint a
9
limited number of board members, and the CEO-chairman of the board duality is strictly forbidden. The standard mandate period for Nordic boards is one year while in Norway it is two, although effective total service time tends to be much longer (Danish Corporate Governance Committee; Finnish Securities Market Association; Icelandic Committee on Corporate Governance; Norwegian Corporate Governance Board; Swedish Corporate Governance Board, 2009).
In summary, there are substantial governance mechanism differences between the Nordic and Southern European firms, particularly in board term durations, board sizes, number of executive directors and their allowed roles in the governance structure.
3. Literature Review
The literature about the determinants of banking profitability can be divided into two segments: firstly, there is the research regarding liquidity (and solvency’s) impact on profitability, and secondly, there is the literature about corporate governance’s influence on profitability.
Influence of Liquidity on Profitability
Prior to 2008, research that tied liquidity and profitability in the banking industry is scarce. Berger (1995) analyzed the association between bank earnings and capital for North American banks over the period of 1983-1989. The author found a significantly positive correlation between capital-to-asset ratio and return on equity, which is consistent with the expected
bankruptcy cost hypothesis, which suggests that having a “higher capital reduces the probability
that uninsured debt holders will have to bear the administrative, legal and asset devaluation costs of bank failure, and therefore lowers the required premium on uninsured debt.” (Berger, 1995: p.454).
10
More recently, Morris and Shin (2009) decomposed the total credit risk of a bank into asset
insolvency risk, the conditional probability of default due to deterioration of asset quality if
there is no run by short term creditors, and illiquidity risk, the probability of a default due to a run when the institution would otherwise have been solvent.
Past literature shows a two-sided influence on a bank’s profitability. On one hand, holding liquid assets decreases the institution’s probability of default, reducing financing costs and increasing profitability, while on the other, liquid assets have lower returns than their less liquid counterparts, representing an opportunity cost for the bank.
As of late, Sahyouni and Wang (2018) extensively analyzed the impact of liquidity creation10 on profitability based on data from 4995 banks across 11 developed and emerging
countries over the periods from 2011 to 2015. They concluded banks with a higher equity to assets ratio are relatively more profitable while banks with higher liquidity creation incur in higher levels of illiquidity risk and hence they obtain lower profitability. Moreover, the authors found that the effect of credit risk on bank profitability is negative and statistically significant, which corroborates the expected bankruptcy cost hypothesis. In addition, they also concluded that GDP growth and inflation are impactful as well (Sahyouni & Wang, 2018).
Regarding solvency, Biraj Kumar Mohanty and Raveesh Krishnankutty (2018) studied the profitability of 46 indian banks over a 17 year period, finding that profitability, measured by ROA, had a significant positive correlation with solvency, while liquidity, proxied by loan-to-deposits ratio, had a positive influence as well. Similarly, Petria, Capraru and Ihnatov (2015) found that solvency had a positive, yet small, effect on profitability on the studied European banks, while liquidity was, as expected, positively correlated.
10 Liquidity creation is the process described by Diamond (2007) through which banks provide consumers with more liquid assets than the ones they hold.
11 Influence of Corporate Governance on Profitability
The relationship between corporate governance and profitability has been extensively studied, especially since 2008. However, results have not been consensual. Assessing the individual impacts of components and mechanisms of corporate governance on the overall performance of banks has been the preferred methodology for the statistical analysis of papers regarding the topic.
Erhardt (2003) found a significantly positive correlation between the demographic diversity of the board of directors and financial performance in 127 large US firms. Kyereboah-Coleman (2007) examined 103 listed firms from several African countries in the the five-year period of 1997-2001, and found that large and independent boards increase firm valuation, combined positions of CEO and board chair along with board activity intensity negatively impact performance while the CEO’s tenure in office and audit size committees positively impacts it, although these findings go against Handa’s (2018) which concluded that the effect of chairman-CEO duality is positive and Stephen et al.’s (2015) who noticed a negative correlation between profitability and audit committee size instead. Perhaps more comparable to a European study sample is Salim, Arjomandi and Seufert’s (2016) study into 11 Australian banks between 1999 and 2013, since Australia is also a developed country with increased cultural proximity, and they found significantly positive relations between performance and bank size, board size and committee meetings, along with insignificant effects by the number of independent board members and number of board meetings (Salim et al., 2016).
From the literature review, it can be concluded that banks with higher liquidity and solvency are generally expected to have increased profitability relative to ones holding less liquid
12
assets. Differences in corporate governance mechanisms are, generally, impactful as well, although there is still little consensus on how they impact profits exactly. Thus, this Work Project contributes to the literature by adding inputs to both topics which are of special value to the discussion on governance and profitability in the banking industry
.4. Methodology and Research Questions
4.1. Research Questions
This purpose of this paper is to provide insight into the profitability gap between Nordic and Southern banks. From here, this paper’s main research question can be derived:
RQ 1.: What causes the profitability differences between the Nordic and Southern European
banks?
Differences in liquidity levels and diverse corporate governance mechanisms in use by banks have been added as explanatory variables to the analysis of the observed profitability divide between Northern and Southern European banks.
Past research focused on macroeconomic differences as explanatory variables (Sinn, D'Acunto; Oldrini; 2013), along with balance sheet vulnerabilities, with a special emphasis on non-performing loans, and business model differences (Soares, 2017; Detragiache, Tressel; Turk-Ariss; 2018). However, so far the corporate governance differences have been neglected, despite managers and members of the corporate governing bodies do take decisions which impact the operating profitability. From the relevant literature, it can be concluded that profitability is influenced by corporate governance, liquidity and macroeconomic factors. As such, the following secondary research questions emerge:
RQ 1.1.: Are there relevant corporate governance differences between the Nordic and Southern
European banks and how impactful are they?
RQ 1.2.: Are there relevant liquidity differences between the Nordic and Southern European
banks and how impactful are they?
13 4.2. Sample and Data Collection
The sampling process considered four criteria for inclusion of banks, as follows: (i) banks included in the sample should be from Nordic (Denmark, Finland, Norway and Sweden) and Southern European countries (France, Italy Portugal and Spain); (ii) banks included should have positive Net Income during in the years of analysis the great majority; (iii) size criteria, based on the Total Assets of the banks, which at the end year of 2017, should be over 225 bn euros; (iv) banks should be listed in an EU based stock exchange.
The criterion (i) for including banks in the sample is straightforward, as the purpose of the paper is to specifically address the Nordic-Southern European banking performance gap. Criterion (ii) is a requirement for positive ROAs, and the consequent meaningful analysis. Criterion (iii) intends to focus the study on the biggest banking institutions, under the assumption that macroeconomic impacts. Finally, criterion (iv) is due to the availability of data, since the Bloomberg terminal has very few corporate governance data from unlisted banks.
As a result of the combination of the four criteria above, the sample for this research is composed by 12 banks: six of them from the Nordic countries of Denmark, Sweden, Norway and Finland and another six settled in the Southern European countries of France and Spain (refer to appendix 4 for the detailed list). The combined total assets of all the banks in the sample, together amounts to €9,537 billion, that is, circa 22% of the EU-28’s financial sector total assets, which valued at over €42,889 billion as of the end year of 201711.
The period of analysis are the years from 2010 to 2017. One constraints of this paper is the need for ROA to be positive, in order to assure meaningful analysis. The year 2010 was
11 Source: European Banking Federation website, Statistical Annex page, available at https://www.ebf.eu/facts-and-figures/statistical-annex/ [Accessed 9th of December 2018]
14
chosen to avoid the 2007 financial crisis’ effects and during the following years the operation of the European financial sector are of relative normal (still it could be argued that issues like
Brexit and the migrant crisis could have significant impacts).
Data was gathered from the Bloomberg databases, which at the date of retrieval still did not contain corporate governance data for 2018. Thus, the most recent period of analysis in this research is the year-end of 2017, being this the most recent date with available data in the source database.
Data collected include both end of the year and semi-annual observations. This procedure permits to monitor for mid-year and end of the period accounting manipulations. Two limitations regarding the data collection exist. One is the non-availability of mid-year, quarterly or monthly values for the corporate governance variables. Limiting the study to yearly values would effectively cut in half the gathered data points, provide a less continuous analysis by only accounting for end year values and ignore possible accounting manipulations the firms may employ to, for instance, present better end-year results in detriment of mid-year ones. As such, an assumption was made which considers the corporate governance variable of semi-annual values to be equal to the end of the year ones. Another limitation concerns instances of missing data, a total of 199 cells out of 5,760 cells of data, that were replaced by estimates based on the existing values’ trends and averages.
4.3. Model of Research
To properly asses the corporate governance’s impact on profitability the following proxies are used: Board size, Number of employee representatives on board, Percentage of non-executive directors on board, Percentage of independent directors on board, Board duration,
15
Number of board meetings, Percentage of board meeting attendance, Audit committee size and Number of audit committee meetings.12
Liquidity is represented by the three ratios: Net loans13 over total assets, Total deposits over total assets and Total interbank assets over total assets. All the three accounts in the numerators are cash, or near-cash items and the combination of these three ratios should provide a clear picture of the institutions’ liquidity values. Solvency will also be incorporated in the model through the Capital Adequacy Ratio under Basel II standards, as in the earliest studied periods of this paper, from 2010 until 2015, the banks estimated their capital adequacy through this method and the Basel III standards14 were only recently implemented.
Based on past literature, macroeconomic variables are explanatory and impactful on profitability and, therefore, the model to test includes them, namely Gross Domestic Product (GDP) growth, inflation rate, taxation and long-term interest rates. Taxation is measured by the Effective tax rate15 while the proxy for long-term interest rates is the Ten year government bond yield.
It is worth noticing that implementation of the International Financial Reporting Standard (IFRS) 9 in 2018 is expected to negatively impact profits as far as impairments’ recognition increase. The implementation coincides to a sharp drop in the ROA of the Nordic banks, as
12 In addition, the following dummy variables were initially included but ultimately excluded due to their rarity within the sampled banks: CEO Duality, and Sustainability Committee.
13 Total Loans net of Reserves for Loan Losses
14 Under Basel III, the Capital Adequacy Ratio was to be replaced by the Common Equity Tier 1 Ratio, calculated through the division of Common Equity Tier 1 Capital, which encompasses common shares, retained earnings, stock surpluses resulting from the issue of common shares and common shares issued by subsidiaries and held by third parties, over Risk-Weighted Assets.
15 Calculated by dividing the period’s income tax expenses by the pre-tax income and multiplying it by 100 to express the value as a percentage.
16
shown in figure 1, although some banks already applied IFRS 9 in financial reporting before 2018.16
The statistical analysis starts with a univariate analysis of the descriptive statistics of the variables in order to get feeling of the data, namely the minimum, maximum, mean and standard deviation. Afterwards, a k-means clustering was employed to study sample clustering. Finally, an ordinary least squares multilinear regression was tested, with a 95% confidence level. Equation [4] is the model of research:
𝑌𝑡 = 𝑎 + 𝛽1𝑋1𝑡+ ⋯ + 𝛽𝑛𝑋𝑛𝑡+ 𝜀𝑛 [4]
Where the dependent variable,𝑌𝑡, is given as a function of 𝑋𝑛𝑡, the n explanatory variables
studied during period t. Each β coefficient represents how much and in what way, positive or negative, each corresponding variable impacts 𝑌𝑡. The 𝑎 parameter - the intercept - measures how much 𝑌𝑡 is affected by variables exogenous to the model and 𝜀𝑛 is the irreducible error
component. Computed variables may not significantly impact the considered value and such issue is addressed through a null hypothesis test17.
After excluding some of the initially considered variables due to low correlations with the dependent variable and multicollinearity issues, the final regression accounts for the following variables: Inflation Rate; GDP Growth; 10Yr Govt Bond Yield; Effective Tax Rate; Board Size; Percentage Non-Exec Directors on Board; Percentage Independent Directors; Board Duration Years; Size of Audit Committee; Audit Committee Meetings; Total Deposits over Total Assets; CAR and Bank Type (refer to Annex 1 for their detailed definitions).
16 Consequently, IFRS 9 implementation and its impact on profitability was initially taken into consideration as a dummy variable and an additional research question, but these were ultimately abandoned due to the scarcity of early adopters within the studied sample.
17 This is a significance testing approach where the null hypothesis, a mathematical statement generally assumed to be true, is rejected in detriment of an alternative hypothesis if the observed data are significantly unlikely to have occurred should the null hypothesis be true. In this case, this testing will be applied to each variable where the null hypothesis is 𝛽𝑛= 0 (n explanatory variable does not impact the dependent variable), and 𝛽𝑛≠ 0 is the
17
5. Data Analysis and Results
5.1. Univariate Analysis
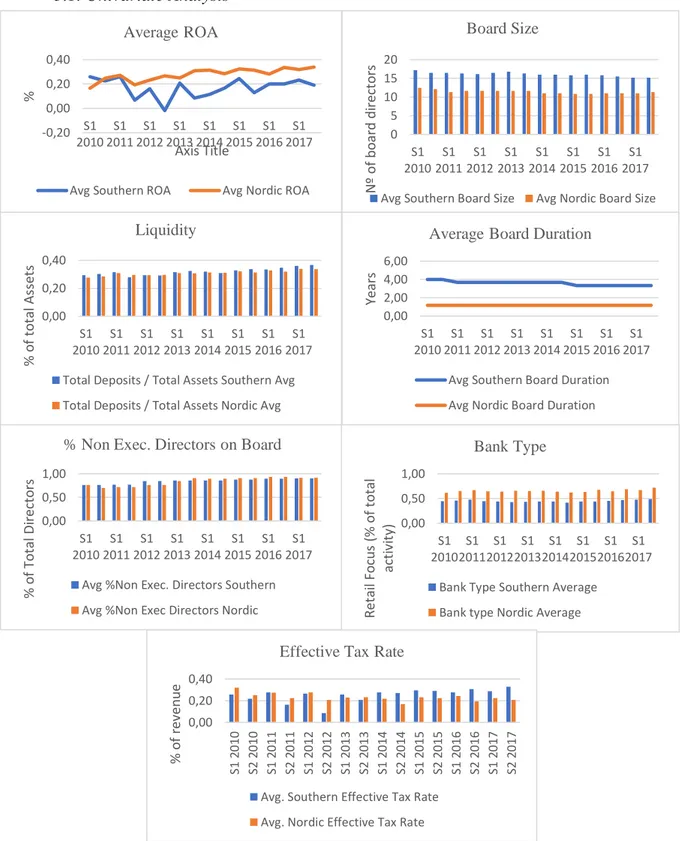
Figure 2 – Univariate statistical analysis, graphical comparison of the Southern and Nordic clusters’ average variable values, source: Excel
Similarly to the macroeconomic trend, the sampled Nordic banks show bigger ROAs than the EU Southern banks during the majority of the studied period. The former banks are also
0 5 10 15 20 S1 2010 S1 2011 S1 2012 S1 2013 S1 2014 S1 2015 S1 2016 S1 2017 N º o f b o ar d d ir ect o rs Board Size
Avg Southern Board Size Avg Nordic Board Size
0,00 0,20 0,40 S1 2010 S1 2011 S1 2012 S1 2013 S1 2014 S1 2015 S1 2016 S1 2017 % o f to tal As set s Liquidity
Total Deposits / Total Assets Southern Avg Total Deposits / Total Assets Nordic Avg
0,00 2,00 4,00 6,00 S1 2010 S1 2011 S1 2012 S1 2013 S1 2014 S1 2015 S1 2016 S1 2017 Yea rs
Average Board Duration
Avg Southern Board Duration Avg Nordic Board Duration -0,20 0,00 0,20 0,40 S1 2010 S1 2011 S1 2012 S1 2013 S1 2014 S1 2015 S1 2016 S1 2017 % Axis Title Average ROA
Avg Southern ROA Avg Nordic ROA
0,00 0,50 1,00 S1 2010 S1 2011 S1 2012 S1 2013 S1 2014 S1 2015 S1 2016 S1 2017 Ret ai l Fo cu s (% o f to tal act iv it y) Bank Type
Bank Type Southern Average Bank type Nordic Average 0,00 0,50 1,00 S1 2010 S1 2011 S1 2012 S1 2013 S1 2014 S1 2015 S1 2016 S1 2017 % o f To tal D ir ect o rs
% Non Exec. Directors on Board
Avg %Non Exec. Directors Southern Avg %Non Exec Directors Nordic
0,00 0,20 0,40 S1 2 0 1 0 S2 2 0 1 0 S1 2 0 1 1 S2 2 0 1 1 S1 2 0 1 2 S2 2 01 2 S1 2 0 1 3 S2 2 0 1 3 S1 2 0 1 4 S2 2 0 1 4 S1 2 01 5 S2 2 0 1 5 S1 2 0 1 6 S2 2 0 1 6 S1 2 0 1 7 S2 2 0 1 7 % o f rev en u e
Effective Tax Rate
Avg. Southern Effective Tax Rate Avg. Nordic Effective Tax Rate
18
considerably more retail focused. More than 60% of their banking activities focuses on retail banking while the Southern banks show values over 40% and tend to be slightly less liquid when measuring liquidity with the Total Deposits over Total Assets ratio. Regarding corporate governance, the sampled Nordic boards of directors have around half the sampled Southern board durations, show bigger board sizes of about five additional directors and have similar percentages of non-executive board directors with slight, fluctuating differences between the two clusters over the seven-year period. As for the effective tax rates, it is important to take into consideration that during semesters with negative profitability the effective tax rate is equal to zero. As such, since the sampled Southern banks showed many more periods with losses, particularly during the first three years of the studied period, it is concluded that Southern banks effectively operate under higher taxes than the Nordic ones.
5.2. K-Means Cluster Analysis
To mathematically verify the paper’s premise regarding the existence of Nordic and Southern clusters a k-means cluster analysis was conducted, this being the preferred method of conducting a clustering analysis since the existing number of clusters was already hypothesized. After defining the number of centroids18, this clustering method assigns each data point in the sample to the nearest cluster. Country-specific control variables were excluded, and the used variables were standardized according to their z-scores19 to place them in the same scale. As a result, all Nordic banks plus Banco Bilbao during its five more recent semesters were grouped in cluster one and all other banks were included in cluster two. Therefore, it is concluded that,
18 Centroids are geometrical centers of plane figures that correspond to the arithmetic mean position of all the points in the figure. In this case, it corresponds to the number of cluster averages (two).
19 Z-scores correspond to the number of standard deviations by which the values of data points are above or below the mean value of the studied sample. Mathematically, they are given by: 𝑧 = (𝑥 − 𝑥̅) 𝑆⁄ , where x is the data point’s value, 𝑥̅ is the studied sample’s mean and S is the sample’s standard deviation.
19
by and large, the sampled banks are clustered into Nordic and Southern European groups regarding the study’s considered variables.
5.3. Multiple Regression Assumptions and Requirements
To validly infer from the regression, its residuals20 must be normally distributed such that the observed values do not deviate excessively from the normality line in the probability plots. Consequently, the variables GDP Growth, Percentage Board Meeting Attendance and Total Interbank Assets over Total Assets were excluded (see Appendix 5). First order autocorrelation must be absent from the model and with a Durbin-Watson test value of 1,665 (see Figure 3 ahead) that falls between the two critical values of one point five and two point five this condition is verified. The residuals must be equally distributed i.e. the data must be homoscedastic, and normally distributed, and such is confirmed by the dispersed residuals scatter plot and normal P-P plot (see Appendix 6). Finally, multicollinearity, that is, the predictor variables being highly correlated among themselves, must be absent from the model as well, and this was verified by analyzing each variable’s variance inflation factor21 and guaranteeing that their values were between the critical values of one and ten. This requirement was verified after dropping the Net Loans over Total Assets independent variable and the country-specific control variables (see Annex 2 for the values).
5.4. Multiple Regression Results
RQ 1.: What causes the profitability differences between the Nordic and Southern European
banking institutions?
Model Summary
Model R R Square Adjusted R Square Std. Error of the Estimate Durbin-Watson 1 ,768a ,590 ,555 ,076297649900 000 1,66520 Residuals, or error terms, are the differences between the observed value and the predicted value of a variable. 21 VIF is a model with multiple terms’ ratio of variance over the variance of the model with one term alone and it measures the degree of multicollinearity within the model.
20 Figure 3 – Multiple regression model summary, source: SPSS
With a R-squared22 of 0.590, the paper’s multiple regression model shows to be a reasonable predictor of banking profitability, given the field’s inherent significant amount of unexplainable variation. It shows how the different corporate governance models adopted by the two clusters have mixed results on profitability, with no model being strictly superior to the other. In addition, it shows how the higher liquidity of the Southern banks is shrinking the profitability gap between the two groups, while the higher Southern tax rates are widening it.
RQ 1.1.: Are there relevant corporate governance differences and how impactful are they? With a β coefficient23 of 0.023 (see Annex 2 for the β values), board duration positively affects profitability. The Nordic corporate governance model mandates board terms to be one year (two years in Norway), while the Southern banks show longer mandates, an average almost four years in the period of analysis. Board size’s coefficient stands at -0.016 and the Nordic banks’ have boards with less members, around five fewer board members than the Southern ones. The percentage of non-executive directors on the board is also significant and shows a β of 0.110, but during the studied period there were only small, alternating differences between the two clusters. Percentage of independent directors, number of board meetings, audit committee size and number of audit committee meetings are non-significant with p-values24 greater than 0.05. As such and in accordance to the hypothesis, there are indeed major differences in the corporate governance mechanisms employed by the biggest Nordic and
22 The R-square statistic, also depicted as 𝑅2, measures the percentage of variance in a regression’s dependent
variable that is explained by its independent variables as a collective. In this case, 59% of the variance in the ROA is given by the included variables.
23 The beta coefficients, in multiple regressions, measures the degree of change in the dependent variable for every unitary change in the independent variables associated with the coefficients. In this case, the model indicates that an increase in a bank’s board of directors’ term duration by one year leads to an increase in that bank’s ROA, expressed as a percentage of total assets, by 0.023%.
24 The mentioned p-values are related to the null hypothesis that the variables’ coefficients are likely equal to zero, i.e. the variables are likely non-significant. Given the study considers a 95% confidence interval, for a variable to be considered significant its associated p-value must be lower than 0.05.
21
Southern European banks, but no model is strictly superior to the other in terms of profitability impacts.
RQ 1.2.: Are there relevant liquidity or solvency differences and how impactful are they? The Southern banks show higher levels of liquidity, which, given the positive coefficient, seems to be pulling the clusters’ profitability ratios closer together. Liquidity, proxied by the total deposits over total assets ratio, is significant (p-value =0.002) and shows a β of 0.395, in line with past literature on the topic. As for solvency, proxied by the CAR, it is non-significant (p-value=0.359).
RQ 1.3.: How impactful are the macroeconomic differences?
The effective tax rate is significant (p-value=0.00) and its coefficient assumes a value of -0.291. That being said, excluding the first three years of the studied period where the Southern banks had the most negative results, they consistently show higger effective tax rates by a five to ten percent margin over the Nordic banks, so it is clear that they are subject to higher tax rates that ultimately hinder profitability. Notably, inflation rate and the government bond yields do not show significant impacts on ROA (p-values of 0.776 and 0.573 respectively).
Regarding business models, the increased focus on retail banking by the biggest Nordic banks is having a positive impact on profitability (β=0.182; p-value=0.047) compared to their more investment focused Southern counterparts.
Besides these results, a small, albeit significant (β=-0.023; p-value=0.046), relationship was found for the semi-annual control variable. This implies that profitability ratios on the second semester of the year tends to be smaller than in the first one. This adds to the debate that risk management models in the banking industry, usually set for a 12-month period, possible focuses more on the short-term results.
22
6. Conclusions
The purpose of this paper was to provide insight into the Nordic-Southern European banking profitability divide while contributing to the literature on banking profitability. Previous studies disregarded the corporate governance differences that exist between the two, so this Work Project sought to build a sturdier explanatory model by incorporating these, while simultaneously accounting for liquidity, solvency, macroeconomic, business model and time period variables. The conducted statistical analysis showed that the existing governance differences between the two bank groups have mixed impacts on profitability, with no governance model being strictly superior to the other and excluding corporate governance as one of the causes for the profitability divide in the biggest banks. In addition, the higher liquidity levels shown in the biggest Southern banks are pulling the two groups closer together while the increased focus on retail banking by the biggest Nordics and higher Southern tax rates are driving them apart. Besides these results, the studied bank sample showed a tendency for profitability to be smaller during the second semester of each studied year which translates as a short-term focus.
Nevertheless, to fully interpret this paper’s conclusions one should be aware of its limitations. Having focused exclusively on banks with total asset values larger than €225 bn as of 2017, this study fails to provide a complete, comprehensive picture of the profitability divide by excluding smaller banks and any impact that firm size may have on profitability remained unaccounted for as well. Also, all sampled Southern banks operated under the one-tier governance model, while a substantial number of Southern European institutions, particularly in Portugal and Italy, utilize the two-tier model instead. Despite these, another limitation was the study’s focus on the governance mechanisms themselves in detriment of the governing directors’ qualifications, demographics and compensations. Future research could elaborate on these topics and offer complementary conclusions to this paper’s.
23
7. References
Berger, A., 1995. The Relationship Between Capital and Earnings in Banking. Journal of Money, Credit and Banking, 27(2), pp. 432-456.
Carsten, G.-B., Philipp, P. & Edmund Philipp, S., 2013. Study on Director's Duties and Liability, London: The London School of Economics and Political Science.
Danish Corporate Governance Committee; Finnish Securities Market Association; Icelandic Committee on Corporate Governance; Norwegian Corporate Governance Board; Swedish Corporate Governance Board, 2009. Corporate Governance in the Nordic Countries, s.l.: Danish Corporate Governance Committee; Finnish Securities Market Association; Icelandic Committee on Corporate Governance; Norwegian Corporate Governance Board; Swedish Corporate Governance Board.
Detragiache, E., Tressel, T. & Turk-Ariss, R., 2018. Where Have All the Profits Gone? European Bank Profitability Over the Financial Cycle, Washington, D.C.: International Monetary Fund.
Deutsche Bank Research, 2017. Where do European banks stand?, Frankfurt am Main: Deutsche Bank AG.
Diamond, D. W., 2007. Banks and Liquidity Creation: A Simple Exposition of the Diamond-Dybvig Model. Economic Quarterly, 93(2), pp. 189-200.
ecoDa; International Finance Corporation, 2015. A Guide to Corporate Governance Practices in the European Union, Washington, D.C.: International Finance Corporation.
Erhardt, N. L., 2003. Board of Director Diversity and Firm Financial Performance, Iowa: Iowa State University.
FXSSI, 2018. TOP 20 Largest World Banks in 2018 by Total Assets. [Online] Available at: https://fxssi.com/top-20-largest-world-banks-in-current-year [Accessed 23 October 2018].
Greg, S., 2004. An Introduction to Corporate Governance in Australia. 1st ed. Sydney: Pearson Education.
Handa, R., 2018. Does Corporate Governance Affect Financial Performance: A Study of Select Indian Banks. Asian Economic and Financial Review, 8(4), pp. 478-486.
Heidrick & Struggles International Inc., 2014. Towards Dynamic Governance, Chicago: Heidrick & Struggles International Inc..
James, M., 2018. Corporate Governance Defined: Not So Easily. [Online] Available at: https://www.corpgov.net/library/corporate-governance-defined/ [Accessed 14 October 2018].
Kyereboah-Coleman, A., 2007. Corporate Governance and Firm Performance in Africa: A Dynamic Panel Data Analysis, Legon: University of Ghana Business School.
Lekvall, P., 2014. The Nordic Corporate Governance Model, Stockholm: SNS Förlag.
Mohanty, B. K. & Krishnankutty, R., 2018. Determinants of Profitability in Indian Banks in the Changing, Kerala: International Journal of Economics and Financial.
24 Petria, N., Capraru, B. & Ihnatov, I., 2015. Determinants of banks’ profitability: evidence from EU 27 banking, Amsterdam: Elsevier B.V..
Sahyouni, A. & Wang, M., 2018. The Determinants of Bank Profitability: Does Liquidity Creation Matter?. Journal of Economics and Financial Analysis, 2(2), pp. 61-85.
Salim, R., Arjomandi, A. & Seufert, J. H., 2016. Does Corporate Governance Affect Australian Banks' Performance?. Journal of International Financial Markets, Institutions & Money, 43(1), pp. 113-125. Sinn, W., D'Acunto, R. & Oldrini, A., 2013. European banking: Striking the right balance between risk and return, Frankfurt: Bain & Company.
Soares, J., 2017. Battle of the Banks: The Fight for Profitable Business Models in Europe, London: Bain & Company.
Standard Bank Group, 2018. IFRS 9 – Financial Instruments Transition Report, Johannesburg: Standard Bank Group.
Stephen, F. et al., 2015. Impact of Corporate Governance Mechanisms and Banks Performance: Ghana's Position. International Journal of Empirical Finance, 4(5), pp. 324-335.
8. Annexes
Annex 1 – Multiple regression variables’ description table.
Inflation Rate It is calculated through the semesterly growth rates of national consumer prices25.
GDP Growth The Gross Domestic Product (GDP) is a measure of the final market value of all goods and services produced/provided within a country. An expenditure approach was utilized, measuring total final expenditures at purchaser’s prices, including exports less imports and adjusted for inflation, and this variable represents this indicator’s semesterly growth rate.
10Yr Govt Bond Yields
It represents the yields of the banks’ respective countries’ government bonds with a ten year maturity, these being debt securities issued by the governments to support governmental spending. These usually represent safer alternative investments for the banks.
Effective Tax Rate
It is a measure of a bank’s total tax paid as a percentage of its accounting income, calculated as: 𝐼𝑛𝑐𝑜𝑚𝑒 𝑇𝑎𝑥 𝐸𝑥𝑝𝑒𝑛𝑠𝑒𝑠 × 100 𝑃𝑟𝑒𝑡𝑎𝑥 𝐼𝑛𝑐𝑜𝑚𝑒⁄ .
Board Size Is the number of full-time directors on a bank’s board excluding deputy members. For firms with supervisory and management boards, this is the number of directors on the supervisory board.
Percentage Non-Exec Directors on Board
Is comprised of non-executive directors, as of the fiscal year end when available, otherwise as of the date of the latest filing. It includes outside directors when applicable and is represented as a percentage of the total number of board members.
Percentage Independent Directors
It is the percentage of board members who do not have vested interests in the firm or persons related to it.
Board Duration Years
Is the length of a board member’s term, in years, prior to renewals for boards which allow terms.
Size of Audit Committee
Number of fulltime directors who are members of the bank’s audit committee, excluding deputy members.
25
Audit Committee Meetings
Number audit committee meetings during the reporting period.
Total Deposits over Total Assets
Liquidity ratio comprised by the total deposits received from customers over the total of all short and long-term assets as reported on the balance sheet.
CAR Short for Capital Adequacy Ratio, it measures the solvency of the bank through Basel II standards, dividing the sum of the tier one and two capital values by the risk-weighted assets.
Bank Type Is a ratio that quantifies a bank’s focus on retail or investment banking activities through
the following equation
𝐵𝑎𝑛𝑘 𝑇𝑦𝑝𝑒
= 𝑇𝑜𝑡𝑎𝑙 𝐿𝑜𝑎𝑛𝑠 (𝑇𝑜𝑡𝑎𝑙 𝐿𝑜𝑎𝑛𝑠 + 𝑆𝑇 𝑎𝑛𝑑 𝐿𝑇 𝐼𝑛𝑣𝑒𝑠𝑡𝑚𝑒𝑛𝑡𝑠 +⁄ 𝑇𝑜𝑡𝑎𝑙 𝐷𝑒𝑟𝑖𝑣𝑎𝑡𝑖𝑣𝑒 𝐴𝑠𝑠𝑒𝑡𝑠 + 𝐼𝑛𝑡𝑒𝑟𝑏𝑎𝑛𝑘𝑖𝑛𝑔 𝐴𝑠𝑠𝑒𝑡𝑠)
As such, the closer this value is to 1 the more retail focused the bank will be while a value closer to 0 indicates an investment banking focus.
ROA 1 Is the standard Return on Assets ratio used in the banking industry composed by net income over total assets but expressed in percentage to show bigger, more easily interpreted regression coefficients.
Annex 2 – Multiple regression coefficients’ table, source: SPSS
Coefficientsa Model Unstandardized Coefficients Standardized Coefficients t Sig. Collinearity Statistics B Std. Error Beta Toleranc e VIF 1 (Constant) ,236 ,079 2,975 ,003 Inflation_Rate ,196 ,689 ,018 ,285 ,776 ,611 1,638 10Yr_Govt_Bond_Yields -,612 1,084 -,070 -,565 ,573 ,154 6,512 Effective_Tax_Rate -,291 ,071 -,221 -4,096 ,000 ,799 1,251 Board_Size -,016 ,003 -,478 -5,182 ,000 ,273 3,659 Percentage_Non_Exec_Directors _on_Board ,110 ,047 ,153 2,328 ,021 ,537 1,863 Percentage_Independent_Directo rs -,033 ,053 -,045 -,629 ,530 ,463 2,158 Board_Duration_Years ,023 ,009 ,286 2,740 ,007 ,214 4,683 Number_Board_Meetings ,001 ,002 ,032 ,522 ,602 ,604 1,656 Size_of_Audit_Committee -,007 ,009 -,056 -,701 ,484 ,363 2,756 Audit_Committee_Meetings -,003 ,003 -,076 -1,191 ,235 ,573 1,745 Total_Deposits_over_Total_Asse ts ,395 ,125 ,363 3,167 ,002 ,178 5,624 CAR ,217 ,236 ,092 ,919 ,359 ,233 4,300 Bank_Type ,182 ,091 ,278 1,998 ,047 ,120 8,325 Time_Period -,002 ,003 -,085 -,743 ,458 ,177 5,661 Semester -,023 ,012 -,101 -2,009 ,046 ,915 1,093 a. Dependent Variable: ROA_1
26
9. Appendices
Contextual Framework: The EU Banking Industry and country/region specificities
The banking sector is made up from all the financial institutions that are licensed by the governments to supply banking services. These services consist of storing and transferring wealth, granting credit or providing risk management when acquiring and holding various forms and portfolios of wealth. From a macroeconomic point of view, this industry is of particular importance as it is responsible for the transferal of funds from the saver entities to the credit users. Firms within this sector can be further divided according to the finality of the bank deposits each receives and the tradable claims each issue against itself. Should these support the extension of credit to the household consumers it consists of retail banking, while providing credit to nonfinancial businesses consists of commercial banking. These may also take the form of underwritten debt and equity securities26 for all kinds of companies, consisting, in this case, of investment banking. These institutions also provide services in aiding with mergers and acquisitions and in providing guidance to issuers regarding the issuance and placement of stock. Lending against real estate is designated as mortgage banking, while extending credit internationally can be defined as merchant banking27. For research purposes, all lending activity within banks will be labeled as retail banking, be it business to business or business to consumer, and all other operational revenue will be designated as investment banking to effectively separate and study how focusing on each may alter banks’ profitabilities.
26 Securities are negotiable financial assets that hold monetary value, being considered equity should they represent an ownership position in a firm, or debt when a creditor relationship is in place instead.
27 Providing credit to other financial institutions in times of external pressure on liquidity and being in charge of the production of money is designated as central banking. These types of banks fall out of the scope of this paper and are not considered in the sample.
27 Figure 4 – European Banking Industry SWOT Analysis
Despite it being home to many independent countries, the adoption of the Euro as the official currency by a great number of these (19 out of the 28 European Union (EU) member states) has greatly facilitated cash flow transactions within the European Union and increased the connectedness of their economies while largely decreasing exchange rate fluctuations in benefit to the financial sector. Also benefitting to the industry is the high economic development of the region, creating an overall benign economic environment after having gone through the Great Recession of 2007 and the Eurozone crisis of 2010-2015. Still, Brexit is an ongoing issue that plagues the sector with uncertainty and the Euro and British Pound currencies have severely devalued. This may have contributed to the shrinking of the industry’s total assets since 2010 (refer to appendix 7 for a detailed graph), but, remarkably, total equity levels have steadily increased during the same period (refer to appendix 8 for a detailed graph). Some of the main drivers of this tendency must have been the shrinking business volumes and an asset de-risking process, as the International Monetary Fund (IMF) noted a steady increase in the European
Strengths: - High overall solvency
- Overall benign economic environment - Safer business model
Weaknesses: - Low overall profitability
- Nordic-Southern performance gap - Shrinking total assets
Opportunities:
- Potential in digital business model innovation
Threats:
- Upcoming regulation is expected to negatively impact profits
- Huge non-performing loan ammounts in some Southern banks
- Brexit uncertainty European Banking
Industry SWOT Analysis
28
Bank System Regulatory Capital to Risk-Weighted Assets ratio28 over the period (refer to Appendix 9 for a detailed graph). This, combined with an increasing Common Equity Tier 1 ratio29 among these institutions whose median now amounts to almost 17% (refer to ppendix 10 for a detailed graph), a value well above the recommended minimum of 8%, grants European banks a generally high solvency. This de-risking process is also reflected in the revenues side. The trading income, which also encompasses income derived from foreign exchange and hedging transactions, and the other income accounts, the two less reliable sources of income, together accounted for less than 20% of total revenues in the top 20 biggest European banks as of 2017, a value well below the 37% registered pre 2007 crisis, so European banks are assuming a safer and more sustainable business model. As a whole though, revenues have shrunk over the past decade by about 23% while net income after tax was halved, conferring these institutions an overall low profitability, especially when compared to their American counterparts (Deutsche Bank Research; 2017). On an additional note, the implementation of the IFRS 930 norm resulted in an earlier recognition of credit impairment provisions which increases the impairment provisions account, negatively impacting profits. The extent to which this standard increases expenses, however, is still being assessed, with the Standard Bank Group, for example, having registered an increase in the impairment provisions account by approximately 32% (Standard Bank Group, 2018).
Disregarding aggregate indicators, the existence of clusters within the European banking industry becomes very noticeable, being of note the previously mentioned Nordic and Southern
28 Regulatory capital to risk-weighted assets ratio is calculated using total regulatory capital as the numerator and risk-weighted assets as the denominator. It measures the capital adequacy of deposit takers and the degree to which financial institutions can withstand shocks to their balance sheets.
29 Common Equity Tier 1 is a ratio introduced in 2014 by the Basel Committee that is calculated through the division of Common Equity Tier 1 Capital (common shares, stock surpluses resulting from the issue of common shares, retained earnings, common shares issued by subsidiaries and held by third parties, and accumulated other comprehensive income) by the institution’s total Risk-Weighted Assets.
30 International Financial Reporting Standard (IFRS) 9 Financial Instruments was issued by the International Accounting Standards Board (IASB) on the 24th of July, 2014. This standard replaced International Accounting Standard (IAS) 39 Financial Instruments: Recognition and Measurement.
29
clusters. Not only does the Nordic one show a consistently better performance, as depicted in the figure 1, but the differences extend to nearly all other accounting indicators. Nordic banks are more solvent, showing an average Common Equity Tier 1 (CET1) ratio 5% bigger than the Southern one (see appendix 11 for a plot of the comparison’s progression) and have increased capital adequacy31 with a capital adequacy ratio (CAR)32 around 6% bigger than the Southern
one (see appendix 12 for a graphed progression of the comparison). But perhaps more worrying is the difference in non-performing loans to total loans ratios. The Southern banks show much larger numbers here having a difference of over 8% for the majority of the accounted period since 2010 with the Italian and Portuguese ones being the main culprits (Italians showed a 14.38% ratio while the Portuguese presented a 13.29%) (see appendix 13).
Appendix 1 – Contextual Framework: The EU Banking Industry and country/region specificities.
The Continental Corporate Governance Model
Regarding the Continental Model, it is commonly referred to as the Two-tier Board System or even by the German word Aktiengesellschaft in German speaking countries. The “two-tier” in its name comes from firms employing two boards in their structures: a supervisory board, generally controlled by the shareholders while employees may hold seats as well, and a management board, that effectively runs the firm. Supervisory board members are appointed by the shareholders at the general meeting and are usually independent of the firm. These may be dismissed by the shareholders at any general meeting. They are in charge of monitoring the management board’s performance, the latter being made up entirely of executive directors, while also loosely guiding it through involvement in long term strategic planning. The members
31 The extent to which depositor are protected and the institution is able to withstand financial shocks.
32 This ratio is calculated by dividing the sum of tier 1 capital, which can absorb losses without a bank being required to cease trading, and of tier 2 capital, which can absorb losses but requires the winding up of the bank, by the bank’s risk-weighted credit exposure.
30
of the latter may be removed by the supervisory board who also defines the management board’s remuneration. In some cases, management boards assign their own compensations, but these are relatively rare. Being a member of one board excludes you from the other, effectively separating management from control (ecoDa; International Finance Corporation, 2015).
Appendix 2 – The Continental corporate governance model description.
Appendix 3 – Two-tier vs Nordic vs One-tier corporate governance models source: Lekvall, P., 2014. The Nordic Corporate Governance Model, Stockholm: SNS Förlag, p.60.
Nordic Cluster Swedbank AB Skandinaviska Banken Svenska Handelsbanken AB Danske Bank Nordea Bank Abp Den Norske Bank Southern Cluster Crédit Agricole S.A. BNP Paribas Société Générale S.A.
Natixis S.A. Banco Santander S.A. Banco Bilbao Vizcaya Argentaria
31 Appendix 5 – Probability plots of the excluded non-normally distributed variables, source: SPSS
32 Appendix 7 – European banking sector total assets (bn €), 2010 S1 – 2018 S1, sum of U.K., Germany, France, Spain, Netherlands, Italy, Ireland, Sweden, Belgium, Denmark, Luxembourg, Portugal, Greece, Austria, Finland and Slovenia’s sectors, source: Bloomberg terminal, ECB
Appendix 8 – European banking sector total equity (bn €), 2010 S1- 2018 S1, sum of U.K., Germany, France, Spain, Netherlands, Italy, Ireland, Sweden, Belgium, Denmark, Luxembourg, Portugal, Greece, Austria, Finland and Slovenia’s sectors, source: Bloomberg terminal, ECB
34000 36000 38000 40000 42000 44000 46000 2010 S1 2010 S2 2011 S1 2011 S2 2012 S1 2012 S2 2013 S1 2013 S2 2014 S1 2014 S2 2015 S1 2015 S2 2016 S1 2016 S2 2017 S1 2017 S2 2018 S1
EUR Banking Industry Total Assets (bn €)
0 500 1000 1500 2000 2500 3000 2010 S1 2010 S2 2011 S1 2011 S2 2012 S1 2012 S2 2013 S1 2013 S2 2014 S1 2014 S2 2015 S1 2015 S2 2016 S1 2016 S2 2017 S1 2017 S2 2018 S1
33 Appendix 9 – European median banking system regulatory capital to RWAs ratio, 2010 S1 – 2018 S2, median of Germany, U.K., France, Spain, Italy, Portugal, Greece, Ireland, Belgium, Netherlands, Austria, Sweden, Denmark, Finland, Norway and Slovenia, source: Bloomberg terminal, IMF FSI indicator.
Appendix 10 – Average of the European Banking industry median CET1 ratios, 2010 S1 – 2018 S2, median of U.K., Germany, France, Spain, Netherlands, Italy, Ireland, Sweden, Belgium, Denmark, Portugal, Greece, Austria, Finland, Slovenia and Luxembourg, source: Bloomberg terminal, ECB.
0 5 10 15 20 25 2010 S1 2010 S2 2011 S1 2011 S2 2012 S1 2012 S2 2013 S1 2013 S2 2014 S1 2014 S2 2015 S1 2015 S2 2016 S1 2016 S2 2017 S1 2017 S2 2018 S1 %
Bank System Regulatory Capital to RWAs (%)
EU (Median)
0 2 4 6 8 10 12 14 16 18 2010 S1 2010 S2 2011 S1 2011 S2 2012 S1 2012 S2 2013 S1 2013 S2 2014 S1 2014 S2 2015 S1 2015 S2 2016 S1 2016 S2 2017 S1 2017 S2 2018 S1 %34 Appendix 11 – Average of the Nordic and Southern banking sectors median CET1 ratios, 2010 S1 – 2018 S1, source: Bloomberg terminal, ECB
Appendix 12 – Average of the Nordic and Southern banking sectors median bank system regulatory capital to risk-weighted assets ratios, 2010 S1 – 2018 S1, source: Bloomberg terminal, IMF
0 5 10 15 20 25 2010 S1 2010 S2 2011 S1 2011 S2 2012 S1 2012 S2 2013 S1 2013 S2 2014 S1 2014 S2 2015 S1 2015 S2 2016 S1 2016 S2 2017 S1 2017 S2 2018 S1 %
Avg of the Median CET1 Ratios
Nordic vs Southern
Avg of the Nordic Median CET1 Ratios (Denmark, Sweden, Finland) Avg of the Southern Median CET1 Ratios (Portugal, Spain, France, Italy)
0 5 10 15 20 25 2010 S1 2010 S2 2011 S1 2011 S2 2012 S1 2012 S2 2013 S1 2013 S2 2014 S1 2014 S2 2015 S1 2015 S2 2016 S1 2016 S2 2017 S1 2017 S2 2018 S1 %
European Bank System Regulatory Capital to RWAs (%)
Nordic vs Southern
Avg of the Median Nordic Capital to RWAs Ratios (%) (Norway, Sweden, Denmark, Finland) Avg of the Median Southern Capital to RWAs Ratios (%) (Portugal, Spain, France, Italy)
35 Appendix 13 – Average of the Nordic and Southern banking sectors median non-performing loans to total loans ratios, 2010 S1 – 2018 S1, source: Bloomberg terminal, IMF (note that the 2018 S1 period results do not account for Italian, Portuguese, Finnish or Norwegian inputs due to the lack of data).
0 2 4 6 8 10 12 2010 S1 2010 S2 2011 S1 2011 S2 2012 S1 2012 S2 2013 S1 2013 S2 2014 S1 2014 S2 2015 S1 2015 S2 2016 S1 2016 S2 2017 S1 2017 S2 2018 S1 %
Avg of the Median NPLs to Total Loans Ratios (%)
Nordic vs Southern
Avg of the Nordic Banking System Median NPLs to Total Loans (Norway, Sweden, Denmark, Finland) Avg of the Southern Banking System Median NPLs to Total Loans (Portugal, Spain, France, Italy)