A Work Project, presented as part of the requirements for the Award of a Master’s Degree in Management from the NOVA – School of Business and Economics.
Management Accounting Change in BSH Group Slovenia- BSH Hišni aparati d.o.o.
Ana Vidrih, 2463
A Project carried out on the Master in Management Program, under the supervision of: Associate Professor Maria João Major
2
Abstract: In order for an organization to be successful in the current complex and fast changing
environment, organizations need to develop performance measurement systems (PMS) that helps them to measure and monitor performance. PMS should be complete, integrated and at the same time, simple and easy to understand. As new strategies were developed alongside, measurement of success evolved too. The purpose of this Work Project is to describe and analyse PMS change of the BSH Group Slovenia - BSH Hišni aparati d.o.o. In this change, BSH Group Slovenia has replaced the Performance Pyramid (PP) by the Balanced Scorecard (BSC). Findings revealed that the company created a new framework, Reversed Performance Pyramid (RPP) in order to facilitate complex change to BSC.
Keywords: Performance Measurement System, Performance Pyramid, Balanced Scorecard,
Management Accounting Change
Table of Contents:
I. Purpose of the Work Project II. Literature review
(i) Substantive examination of the PMS field (ii) SMART PP
(iii) BSC
(iv) Change of PMS in an organization III. Methodology
IV. The field study
(i) Company Presentation
(ii) Description of the PP used in the company (iii) Management Accounting Change
V. Conclusions VI. Bibliography
3 I. Purpose of the Work Project
The purpose of the Work Project is to describe and analyse the performance measurement system (PMS) change of the BSH Group Slovenia. In this transformation, BSH Group Slovenia is replacing the Performance Pyramid (PP) by the Balanced Scorecard (BSC). There is literature regarding the change from Total Quality Management (TQM) to BSC (Pimentel and Major, 2014) or the integration of suppliers, inputs, processes, outputs, customers (SIPOC) diagram to BSC (Cao et al., 2015). However, there is little or no literature concerning the management accounting change from PP to BSC. This gap in literature has motivated this research.
The first BSC framework was created by Kaplan and Norton in 1992. Despite that it has been over 20 years since the framework was created, it remains one of the top-performing frameworks in use today (Darell, K.R., 2015). Kaplan and Norton (1996) outlined, that BSC is not an evaluation method, but rather a strategic planning and communication device to improve the strategic guidance to divisional managers and to relate links among lagging and leading measures of financial and non-financial performance. Another PMS tool is the PP. Werner (2000, p.455) and Wefers (2000) identified that PP and BSC are both strategic measurement systems, but PP is a static observation system while BSC is a dynamic sampling system. PP is able to make improvements in cost, time and quality. On the other hand, BSC can identify the potential innovation and places a larger emphasis on the extent of the customer perspective. As so, BSC can be considered as an independent management approach due to the overcome of the lag indicators (Bokmann and Gotta, 2000). Some of the reasons for firms to embark on management accounting change can be the desire to: (i) to improve the monitoring of the performance; (ii) improve communication; (iii) enhance motivation; (iv) recognize the areas that need attention; and (v) to strengthen accountability. Furthermore, management accounting change is unpredictable, non-linear, uncontrollable and it involves much more than simple technical change (Wanderley and Culleb, 2013; Quattrone and Hopper, 2005). In order to
4
analyse management accounting change and BSC adoption in BSH Group Slovenia, the researcher has adopted a case study as the research method and posed the following research question: Why has the BSH moved from the PP to the BSC?
This paper is structured in four additional sections. Section 2 discusses previous research on the PMS, PP and the BSC, as well as the reasons for change of PMS in organizations. Research methods and methodology followed in the research is presented in section 3. In section 4, the field study is described, and discussed how management accounting changed in BSH Group Slovenia. The paper ends with the presentation of conclusion in section 5.
II. Literature Review
(i) Performance Measurement System (PMS)
Business environment is changing rapidly and it has become important that organizations develop performance measurement systems (PMS) in order to help managers monitoring their strategic response. It is now widely accepted that the use of appropriately defined measures can ensure the strategic alignment of the organization and communication of the strategy throughout the business. The measurement of the performance of business organizations has long been of central interest to both managers and management accounting researchers (Otley, 1999). However, performance measurement is a complex issue that requires multidisciplinary approach and normally incorporates at least accounting, economics, management and information technology (Tagen, 2004); academics from the fields of accounting, business strategy, operations management, marketing, and organizational behaviour have all discussed and contributed to this topic at length (Neely, 1999; Marr and Schuima, 2003). Several performance measurements were developed, in order to support different accounting management techniques. Great part of criticism on traditional accounting has focused on the historic nature of accounting systems, as these reveal companies’ past actions but nothing about its future vigilance (Merchant, 1985; Chakravarthy, 1986; Schoenfeld, 1986; Dearden, 1987;
5
AICPA, 1994; Kaplan and Norton, 1996). Another criticisms base on the argument that traditional accounting ignores a company’s intangible assets and pursues short-term financial results rather than long-term goals of an organization (Dearden, 1969; Hopwood, 1972, 1973; Vancil, 1979; Kaplan, 1984; Merchant, 1985; Johnson and Kaplan, 1087; Demirag, 1998); critics claim that this results in management refusal of investments in growth and innovation potential, low efficiency and loss of customer loyalty and satisfaction. Some critics pointed out that there is a risk that strategic plan remains distant from the organization’s daily actions (Kiechel, 1984; Mintzberg, 1994; Simons, 1995). Another common criticism of PMS was that these measures persuade managers to make myopic, short-run decisions. Financial measures tend to focus on the current impacts of decisions, without any linkage between short and long-run strategy (McKenzie and Schilling, 1998; Luft and Shields, 1999). Lynch and Cross (1995) state that PM should motivate behaviour that leads to continuous improvement in key areas of competition (e.g. customer satisfaction, flexibility and productivity). Just the sum of financial measures of an organization is not enough to ensure goal harmony and compatibility between staff decisions and actions (Parker, 1979; Merchant, 1985; Kirby, 1994). At different levels, various relevant strategic measures have to be implemented to coordinate and control staff decisions and actions (Norreklit, 2000). As a result of insufficient strategy implementation and inadequacy of solely financial measures, many scholars developed strategic measurement tools, which consist of financial and non-financial measures. Non-financial measures are not a new phenomenon as a number of theorists have apprised its relevance for managing performance (Hopwood, 1973; Argyris, 1997; Parker, 1979; Anthony et al., 1984; Merchant, 1985; Schoenfeld, 1986; Eccles, 1991; Maciariello and Kirby, 1994).
(ii) Performance Pyramid (PP)
The Strategic Measurement Analysis and Reporting Technique (SMART) system was developed by Wang Laboratories to overcome the limitation of traditional performance
6
measurement, with objectives to integrate both financial and non-financial performance indicators (Cross & Lynch, 1989). It is designed as a four-step performance pyramid to integrate organization objectives with operational performance indicators but that excludes continuous improvement (Ghalayini, 1997). The primary aim of the PP is to through organization`s strategy connect operations by translating objectives from a top-down perspective (based on priorities of the customers) and measures from a bottom-up process (Tangen, 2004). The PP has to set four key indicators of performance measures: Quality, Delivery, Cycle time and Waste. SMART Performance Pyramid considers layers between the business units and individual business units and integrates the corporate objectives with the operational performance indicators. Besides that, the measurement also combines financial and non-financial indicators with operational and strategic indicators. The problem is, that it does not provide any mechanisms to identify the Key Performance Indicators (KPIs), nor does absolutely integrate the concept of continuous improvement (Ghalayini et al., 1997). Main criticisms can be summarised as it follows: (i) it does not include customers or human resources as dimensions of the performance; (ii) it cannot give a truly balanced view of performance; (iii) fails to provide an explicit process for developing the PM mode; and (iv) it comprises several different tools and as so, it is potentially complicated to understand and to use. On the other side, SMART Performance Measurement provides a useful development process and specifies, in reasonable detail, how the measures should look like (Striteska and Spickova, 2012).
(iii) Balanced Scorecard (BSC)
The BSC (Kaplan and Norton, 1996) is another model, which integrates financial and non-financial measures. What separates the BSC from any other strategic measurement system is its structure. It contains outcome measures (also called lagging measures) and the performance drivers of outcomes (leading measures), linked together in cause-and-effect relationships. De Haas and Kleingeld (1999) denoted the BSC measurement system a feed-forward control
7
system. Additionally, the BSC should align departmental and personal goals to overall strategy (Kaplan and Norton, 1996a, p. 10). BSC is a tool that systematically amplify the measurement areas that are traditionally involved in accounting. The authors - Kaplan and Norton - claim that the BSC offers two important improvements compared to traditional financial and even non-financial performance measurements. Firstly, the BSC identifies four associated areas of activity that can be critical to practically all organizations and all levels within the organizations: (i) Investing and learning and growth capabilities; (ii) Improving efficiency of internal processes; (iii) Providing customer value; and (iv) Increasing financial success. And secondly, BSC seeks to link the performance measures into a model that accurately reflects cause and effect relations among categories and individual measures. It is said that the model developed in such way, can support operational decisions, given the decision and environmental conditions, as well as, make predictions of the outcomes and provide reliable feedback for learning and performance evaluation. The set of BSC measures should entirely describe the organization’s critical performance but should be limited in number to keep the measurement system administratively and cognitively simple. Firms that adopt the BSC usually increase the number of performance measures they use and identify much broader group of measures than those they have traditionally used (Lipe and Salterio, 2002). Research in cognitive psychology shows that people are usually unable to process more than 7-9 items of information at the same time (Baddeley, 1994; Miller, 1956). As BSC contains many more measures than this limit it is reasonable to question whether managers find it difficult to utilize information in the scorecard. However, Lipe and Salterio (2000) in their experimental study of BSC, did not find any evidence of information overload from multiple measures. Furthermore, analysed subjects with BSC format find performance measures to be more logically organized and usefully categorized compared to those with no-form format (Lipe and Salterio, 2002). Marr (2001, p. 30) reports that “The latest data suggest that over 50% of the largest US firms had adopted a measurement
8
framework, such as Balanced Scorecard, by the end of 2000”. Furthermore, one study estimates that more than 40% of all Fortune 500 US companies use BSC (Williams, 2001). These adoption rates appear to be high in many countries (Silk, 1998; Ittner et al., 2003; Speckbacher et al., 2003, Chenhall, 2004). However, it is still unclear what qualifies a PMS or a business model to be classified as a BSC, and how the BSC is actually used. Kaplan and Norton (2001b, p. 94) wrote that many companies “claim to have a Balanced Scorecard because they use a mixture of financial and non-financial measures”. Authors argue that their idea of BSC concept goes far beyond this definition. The problem might lay in imperfect or unclear initial concept created by Kaplan and Norton (1996). As outlined by many authors (Ittner and Larcker, 1998; Norreklit, 2000,2003; Malmi, 2001) BSC is far from being a clearly defined concept. Furthermore, even thought that the BSC is widely used, only limited systematic research has been done on BSC applications (Atkinson et al., 1997; Otley, 1999; Ittner and Larcker, 1998,2001; Norreklit, 2000, 2003; Selto, 2001). Speckbacher et al. (2003) study showed that only 26% of firms use BSC and most of these use only a limited or incomplete version. Atkinson et al. (1997) state that BSC is significant evolution in management accounting and that it deserves intense research attention. Tayler’s (2007) result of an experiment highlight the importance of causal-chain framing of the scorecard, that BSC proponents emphasize, but practitioners often fail to implement. Moreover, the results indicate that managers’ motivated reasoning can be mitigated by giving managers responsibility for measure selection. Norreklit (2000) is questioning whether is it a valid model for obtaining the results promised. Invalid assumptions in a feed-forward control system will provoke anticipation of performance indicators that are faulty, resulting in dysfunctional behaviour in the organization and sub-optimal performance (De Haas and Kleingeld, 1994, p. 244). Norreklit (2003, 2010) has identified problems with key assumptions and relationships in the BSC. In the BSC all measures are linked together in a causal chain that passes through the entire company. Accordingly, there
9
is a logical relationship among the areas analysed rather than a causal relationship; for instance, customer satisfaction does not necessarily generate good financial results. Rather than perceiving the relationship as a causal one, it may be useful to establish coherence between measurements (Edwards, 1972; Norreklit and Schoenfeld, 1996; Collis and Montgomery, 1997; de Haas and Kleingeld, 1999). If properties of different areas of strategic focus (internal business process, market requirements, finance, technology, etc.) are harmonized and integrated, allowing the planned ends to be achieved through the working together of the properties of different areas of focus, the strategy is coherent (Norreklit, 2010). If the evaluation system does not integrate all relevant variables it cannot be expected to show valid results. The causal relationship suggested by Kaplan and Norton (1996a) is clearly not valid (Norreklit, 2000). Norreklit (2000) states that the evaluation will always be partly subjective and relatively dependent on the intuition of the top managers. The performance picture should be composed not only from past results but also from the impact of the future opportunities and as the future is uncertain, top managers will have to make subjective assumptions. For example, Ittner et al. (2000) found that subjectivity in BSC implemented in a bank led to having small beneficial impact and the bank’s reversion to short-term financial measures of performance. Therefore, even if the organization’s BSC reflects its critical performance variables and links to valued outcomes, it may fail as an effective management control. Bukh and Malmi (2005) outlined that even thinking of cause-and-effect relationship can help in adapting the BSC to any organization. Moreover, the relationships in the BSC should be specific to the organization and should not be perceived as generic. The relationships should be defined between measures itself and not between measurement areas. Furthermore, by following cause-and-effect logic, management can create measures that reflect organization’s unique strategy and establish measures believed to leas to desired outcomes. Norreklit (2003) argues that BSC literature developed by Kaplan and Norton belongs to the genre of the management guru text. The audience associates them
10
with prestigious academia, but the text has little to do with scholarly work. Such texts are, due to their impressionistic style that allows managers to select the elements, which they believe to be sensible, open to interpretation. When the text is open to interpretation, it does not necessarily lead to tolerance but it may be used for manipulation. To gain employees cooperativeness and agreement to obey, the managers need to promote an organisational ideology (Selznick, 1957; Alvarez, 1998). As so, the BSC may be a strong persuasive instrument to justify top-down control. Besides that, as Business Process Reengineering (BPR) may be used as a justification to fire employees (Boje et al, 1997), BSC may be useful to justify cost reduction and make employees increase their level of customer service (Norreklit, 2003). If the intention of the managers is to re-story and to provide justification, then the lack of clarity, undefined content and superficiality may be an advantage. Furthermore, Norreklit (2003) state that the BSC is a performance art. The author appeal to the readers’ irrationality and emotions, aided by text being full of metaphors, analogies and drama. In such way, BSC theory being very open to interpretation and therefore giving the readers an opportunity to construct their own theories simultaneously. Norreklit (2003) concludes that more argumentative and empirically valid theories should be combined with entertaining rhetoric and that both, managers and managers have to improve at selling models and theories in a way that it is still persuasive but at the same time convincing. Speckbacher et al. (2003) study shows that larger companies are more likely to implement a BSC and that “consumer and retail” industry is associated with significantly lower usage of BSC. Furthermore, only 8% of the firms expect the benefits of the BSC to be less than its costs. The most important reason for not implementing BSC is that the firm feels that the BSC could not offer benefits beyond the existing PMS. Analysed companies do not view BSC as a concept to integrate shareholders and their intangible investments into the existing management process in a better way, but as a concept to improve shareholder value management. But if the BSC is perceived as a “managerial equivalent of
11
stakeholder theory”, then the concept lacks in shareholder orientation (Jensen, 2001). To sum up, BSC has some weak points outlined by Striteska and Spickova (2012); (i) too many/ few metrics- development of metric that are unattainable; (ii) constructed as a controlling tool rather than as an improvement tool; (iii) lack of employee awareness or failure to communicate information to all employees; (iv) lack of long-term commitment and leadership for the managers; and (v) it does not express the interests of all stakeholders. Although there are many critics on the BSC concept, the research shows that BSC has impeccably some strong points; Those are: (i) the ability to create a clear vision and adopted strategy; (ii) consistent monitoring of the strategy; (iii) concentration on strategically critical business objectives; (iv) integration of performance measures for operational objectives at an appropriate level; and (v) cross-disciplinary and hierarchy communication process (Striteska and Spickova, 2012).
(iv) Management Accounting Change
Johnson and Kaplan (1987) started questioning the applicability of contemporary management accounting practices. The main argument was that the organisational environment was changing and developing fast and management accounting did not follow. Since then, in 1990’s, new “advanced” management accounting techniques were developed: activity-based costing (ABC); activity based management (ABM); life-cycle costing; quality costing; target costing; economics value added (EVA); supply chain management (SCM); and the balanced scorecard (BSC), among others (Ax and Bjornenak, 2007). Management accounting change involves much more than just simple technical change. It is uncontrollable, unpredictable and non-linear. (Wanderley and Cullen, 2013; Quattrone and Hopper, 2005). According to Modell (2007), management accounting research can be classified into two categories; (i) Factor studies and (ii) Process oriented approaches. When conducting factor studies, researchers seek to identify the drivers and barriers for a successful implementation of management accounting techniques. On the other hand, in process-oriented approach the research concerns with socio-political
12
dynamics of new management accounting approaches of management accounting change implementation. Many researchers (namely, Innes and Mitchell, 1990; Scapens et al., 2003; Yazdifar and Tsamenyi, 2005, just to mention a few) dedicated their studies to identify the causes for the change in management accounting. From these studies it can be observed that the change can occur as a response to external sources (ex. Government laws, consumer expectations, market pressures, social and political change and technology), internal pressures (eg. behaviour problems, change in the size and complexity of the organization and change in the power dynamics in the organisation) and as a pursuit of organisational strategies to achieve efficiency (Lawrence and Sharma, 2002; Tsamenyi et al., 2006). Cobb et al. (1995) found that several change initiatives in management accounting that failed encountered severe implementation problems due to internal barriers (eg. changing priorities during the change process, accounting stuff turnover and resistant attitudes to change). With this research, it has been observed the extreme influence of individuals as change agents. Kasurinen (2002) further developed Innes and Mitchell (1990) and Cobb et al. (1995) frameworks, by specifying the types of barriers that may hinder, delay or prevent management accounting change in practice. Barriers to change were divided into three categories: (i) confusers; (ii) frustrators; and (iii) delayers.
III. Methodology
Bromley (1986, p.1) states that all case study research starts from the same thrilling feature: The desire to derive a(n) (up-)close or otherwise in-depth understanding of a single or small number of “cases”, set in their real-world contexts. The case study is defined as: An empirical inquiry about a contemporary phenomenon, set within its real-world context, especially when the boundaries between the context are not clearly evident (Yin, 2009a, p. 18). The choices among different research methods, including the case study method, can be determined by the kind of research question that a study is trying to address (e.g., Shavelson & Towne, 2002). In
13
this WP it is executed a single case study in BSH Slovenia to address the following research question: Why has the BSH moved from the PP to the BSC approach?
As defined by Yin (2009, 2014), case study research method should be used when: (i) the object of a study is a contemporary phenomenon; (ii) the researcher has no control over the phenomenon object of the investigation; (iii) the objective of the research is to obtain a deep understanding of the phenomenon within its context. In this WP, the outlined research fulfils all three conditions. By emphasizing the study of a phenomenon within its real-world context, the case study method advises the collection of data in natural settings, rather than relying on “derived” data (Bromley, 1986, p.23). Moreover, to allow data triangulation, mix sources of evidence has been used. As so, semi- structured interview, direct observation and the collection of documents from the company has been executed. Secondary data was collected and created by the company, with a purpose to serve as a: (i) starting point for further concept development; (ii) as a presentation documentation (e.g. power point) for different groups of people (e.g. employee, divisional leaders, parent company or public); and (iii) as a part of an obligatory financial reporting (e.g. Annual financial reports). As a primary data, eight semi-structured interviews were conducted in the time period from middle of January to middle of June (See Appendix 1). The interviews gave the researcher the possibility to focus directly on the WP topic and to understand the internal processes and systems of the company (Yin, 2009, 2014). Each interview took on average 70 minutes. In the research, we have used the ‘top/senior-manager’ designation for those employees with high degree of responsibility or that are in a high hierarchy of the company’s organizational structure. Those with a middle to high degree of responsibility and are obligated to report to top managers were identified as ‘middle-managers’. Based on the literature review it has been identified a strong need for diversity of the interviewees in the WP research in order to get different views on the phenomenon under study. The interviews followed a general to particular approach, starting with a general and
14
open question about the PP in the company, its characteristics, implementation procedures, informatics systems, and criteria for goal determination. These questions were followed by specific questions regarding managers’ perception on practical application of PP, its weak and strong points and cost-benefit analysis. The same procedure was followed when conducting data about the BSC. Hence the second part of the interview was focused more on the expectations that interviewees have on the implementation and adoption of the BSC (See Appendix 2). Two main interviews were tape-recorded and later on transformed into interview transcript. The remaining interviews were not recorded; yet the researcher took notes whenever possible during and immediately after the interview. Additionally, information was also obtained from the interviewees via email and later on all of the information was converted into a “Interviews summary” (see Appendix 3). To cover events in real time, understand the context of the event and to acquire profound insight into interpersonal behaviour and motives (Yin, 2009, 2014), direct observation was also performed. The researcher had the possibility to observe how different business areas variously perform its tasks and responsibilities, be a part of a KPI creation for the next business year and communicate with people that work directly at BSC creation and also those that are not directly involved into BSC creation and implementation. Following Miles and Huberman (1994) suggestions the qualitative data analysis was consisted of three procedures: (i) Data reduction, where the mass qualitative data (interview transcripts, field notes, observations etc.) was reduced, organised in form of writing summaries and the procedure of disposing irrelevant data; (ii) Data display in form of tables, networks and other graphical formats was created to draw conclusions from the mass of data; (iii) Based on past steps of analysis, conclusions were developed and later on verified.
IV. The Field Study
15
BSH Hišni aparati, d.o.o. operates as a subsidiary of BSH Hausgeräte GmbH. The BSH family is composed out of around 80 companies in 50 countries, with a total workforce of about 53,000 people. Product portfolio of the company spans the entire spectrum of modern household appliances, from coffee machines, electric kettles, irons, hairdryers and vacuum cleaners to dishwashers, dryers, washers, refrigerators, freezers and stoves. The appliances are divided into 3 groups: (i) Main brands (Bosch and Siemens); (ii) Special brands (Zelmer,Junker, Ufesa,etc.); and (iii) Regional brands (Pitsos, Coldex, Balay, etc.). All of the actions and developments of BSH are determined by strong strategic orientation towards quality and innovation. BSH products are known for their strong performance, user-friendliness and convenience. Corporate responsibility is an essential part of the company as so all of the household appliances make a significant contribution toward conserving resources with energy-and water-saving design. BSH bought the Nazarje plant in 1993 as it took over production of small electric appliances from the Slovenian household appliance manufacturer Gorenje. In 1995, the trust of BSH parent company was confirmed as the development of small motor driven household appliances was moved from Germany to Slovenia. BSH Hišni aparati has developed into the biggest plant for the manufacture of small household appliances in Europe. In the last couple of years, the plant has become a modern centre for the development and production of all motor-powered home appliances for food preparation and technologically more advanced thermal appliances for beverage preparation with a higher added value. The company is involved in development and production network of the BSH Group, and it maintains the same guidelines and standards that apply to all other BSH production locations. As a consequence of Robert Bosch GmbH acquisition of Siemens Hausgeräte GmbHs 50% stake in 2014, there was a change in the ownership structure. Leaders detected that the biggest problem that the whole BSH Group is facing is the fast growing companies in Turkey and China (Interview, HR top manager, 2016). In order to maintain a competitive advantage, the BSH Group had to change its strategy. The
16
main focus of the strategy was to create frameworks and goals to increase the growth. The BSH Hišni aparati holds strong strategic importance within the concern and as so, they are included into a program “Fit for Growth”, where the BSH Group has set itself a goal to double the sales of small household appliances until year 2025. The program was a part of a long-term strategy change as the leaders of the BSH Group recognized the need for strong competitive advantage and the importance of company’s growth. In order to be aligned with BSH Group new strategy, BSH Hišni aparati created a new PMS of which main goals is to lead to fulfillment of all the predetermined BSH Group goals in order to increase growth of the BSH Group. The company has already transformed the PP into a Reverse Performance Pyramid (RPP) as an intermediate step in a change from PP into BSC in 2015. In 2016, the company started the management accounting change to BSC.
(ii) Description of the PP used in the company
Due to the fast development and growth of the company during the last decade of the 20th century, its leaders identified a need for a more complex PMS to monitor and control the implementation of company goals. As a result, the first PP was created, in year 2000 (HR manager, “PP Transformation.”, 90 minutes, Nazarje, 2016). The PP creators were just top-managers and they were invited to participate at a 3 days’ workshop where they analysed company’s performance, activities, operations and developments in the past year. They identified what was realized during the year before and what were the plans for the future, company’s main problems and how to solve them. As a result, company’s goals and their measures were elaborated. Despite the fact that the PP was created just by the top-managers, the PP was always exposed in different offices within the company. The PP was a monitoring tool and guidance for the next year, but there was no long-term strategy incorporated into the PP. Besides that, the communication in the company was not improving nor did the employee motivation. Slowly managers realised that developing PMS without the employees input would
17
not give the best results. Gradually they started to include the divisional leaders into the PP creation. Furthermore, other employees became slowly involved as the divisional leaders sought their view on problematic areas. More workers were substantially involved once they started creating Divisional Target Pyramids to supplement and support company’s PP but still as a top down process. Over the past 15 years one of the main company’s goals was to systematically connect and actively involve employees as extensively as possible in the process of PP creation and implementation. To assess how successful are the managers with the PP/RPP incorporation the HR department performs every two years an employee satisfaction survey. In the survey they raise question about the work-life balance, sustainability, leadership, etc. (see Appendix 4). Relating to the PMS, they evaluate how well do the employees know the vision, strategy and target goals with raising questions like “Do you know what are the goals of the company?”, “Do you know what are the goals of your department?”. All of the results are outlined with a comparison to previous years in order to see where managers and the company as a whole have improved, expanded their strengths, which are the areas that need to improve and where did the managers and a company as a whole had the highest decrease. Based on the results from employee survey 2015 (see Appendix 4), the highest decreases were identified in the recognition and awareness of the company’s vision, mission and targets. It was a sign to the company leaders that many employees did not know what is the company trying to do, what is the company striving to achieve end what is their strategy to achieve that. Managers of the company know that in order for employees to be motivated and determined to fulfil the target goals of the company, employees have to perceive company goals as their own. As one senior manager stated during its interview: “We saw that we have problems in communicating our strategy and goals to our employees who has with their outstanding work made our company a success story and that it is time for action.”
18
(iii) Management Accounting Change
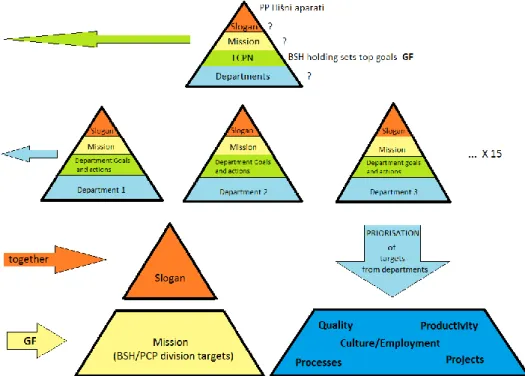
In 2015 managers wanted to deepen the understanding of the processes within the company and through this to examine individual projects and procedures. Managers evaluated the components of the PP and the outcomes, trying to determine the weak points where PP doesn’t give the results desired. After the analysis, managers acknowledged that RPP they used does not provide satisfactory clarification of vision and strategy. Furthermore, there are no mechanisms to identify what are the KPIs. One of the managers’ main goals was to create a PMS that would improve employees’ awareness of company’s strategy, mission, vision and divisional and corporate goals. After outlining all of the weak points that need to be improved, the managers felt that these problems could be solved, if they started using BSC. In the first step of management accounting change managers hired an external consultant to present the concept of BSC in great detail to help clarify open questions amongst internal stakeholders. As one senior manager claimed “To convince all or at least the most important members in the company that a change was needed, it was not an easy task. It brings an extra work and disruption into structured processes. The external expert convinced the top managers that their support for change of PMS was crucial. The energetic and enthusiastic leadership latter helped to persuade doubters and opponents”. The main advantages the company identified with the BSC adoption were the possibilities to improve employees’ recognition and identification of vision and strategy, boost communication processes in the company and create new ways of consistent monitoring of strategy. Furthermore, managers identified that with BSC company would have the possibility to better link short-term and long-term goals and the required inputs with required outputs. Once the company would form these links, the BSC gives the opportunity to identify KPIs. After the consultation with the external advisor, the second step of the demanding transformation process from PP to BSC was the formation of a “Reverse Performance Pyramid” (RPP) (see Figure 1). The RPP system is an upgrade crated by the
19
company as a middle step to the BSC adoption. The difference between the PP and RPP is that the PP translates the objectives from top down and measures from bottom up while the RPP does not translate the objectives just from top down. In the RPP the top down procedure is used just to set the top goals of the company while the rest of the goals are determined by bottom up. The process of the RPP creation starts when the company receives the main target goals from the subsidiary. In each section of the upper top of the RPP; i) Quality; (ii) Results; (iii) Environment; and (iv) Projects top managers decide on which goals needs to be achieved in order to fulfil the requirements from the subsidiary company. These top goals are then presented to the managers of different departments as a guidance for the creation of departmental PP. Each department creates an individual PP with the content divided between five supporting pillars:(i) Quality; (ii) Process; (iii) Productivity; (iv) Culture and Employees; and (v) Other projects.
Figure 1: "Reverse Performance Pyramid" Creation Process
20
Each department creates an individual PP with the content divided between five supporting pillars:(i) Quality; (ii) Process; (iii) Productivity; (iv) Culture and Employees; and (v) Other projects. Each section of the departmental PP and its actions and goals need to strive to achieve top goals predetermined by the top managers. After the departmental PP are formed, each department chooses three to five top goals as the potential goals to be included into the company’s RPP. These top goals of individual departments are then presented to the top managers. Departmental managers and top managers together decide on which goals are the most important and which goals should be included into the company’s RPP. This cross disciplinary and hierarchy communication process is called System “8” (see Appendix 5). With the RPP and System “8” the company has improved the communication and interaction in the company, the areas in need of attention are identified better and employees are more motivated. As a top-manager in HR department explained: “Employees perceive the pyramid as their own and the established goals are their own goals. As so, they are determined to fulfil them.” The whole process of RPP creation lasted for 7 months. The cycle of management accounting change to BSC (see Appendix 6) started in June, 2015 when they got the first feeling of what will be happening and changing in the market. Managers did the first review of target status and created the first draft of the next years’ business plan. In September/October managers reviewed the target status and improved any of the objects where adjustment was needed. Around that time also a Strategic Conference was convened. In October/November each department determined its mission, slogan and targets together with strategy maps (see Appendix 7). In December the mission, slogan, goals and actions of individual departments and of the whole company were confirmed and committed, by senior and middle managers. The managers that proposed the management accounting change to BSC perceived the change as cost-effective without performing any cost-benefit analysis. The interviewed managers stated, that the costs of the management accounting change were never calculated. Based on the
21
information given by the managers, they needed 450-500 days to perform a change. Together with the information available in the annual report 2014, the cost of management accounting change has been estimated to 49,647€ (see Appendix 8 for the calculation). This number does not take into account that managers that spend most of the time on PMS creation do not have an average wage of a retail company and there is no cost of external consultant included in this calculation. The management accounting change to BSC is not completed and it continues in year 2016.
(iv) Findings
The company has used PP as a PMS for over 15 years. Initial PP were created just by the top managers and the main reason for company to use PP as a PMS was the possibility of combining financial and non-financial indicators with operational and strategic indicators. Moreover, contrary with some critics (Ghalayini et al., 1997) managers perceived PP as easy to understand and as a good tool to specify how the measures should look like. What managers felt it was missing is (i) the possibility to have a balanced view of performance, (ii) the ability to create a clear vision and strategy, (iii) the concentration on strategically critical business objectives, (iv) the possibility to identify the KPIs and (v) the involvement of employees in the PMS creation. In order to address these issues, top managers embarked on management accounting change, and replaced PP by the BSC. As an intermediate step to the BSC the company in 2015 created a new framework as an improvement to the PP. The RPP does not establish the objectives from top down and measures from bottom up as it is executed in the PP. In the RPP the top down procedure is used just to position the top goals from the parent company while the rest of the target goals and actions are identified by bottom up. The parent company prescribed what are the target goals of BSH as a group. Based on those goals, senior managers identified top goals of the BSH Hišni aparati in each of the (i) quality, (ii) results, (iii) environment and (iv) projects
22
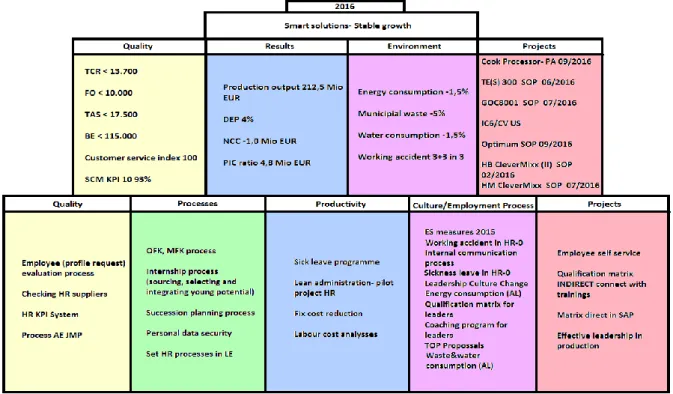
sections. Once the company goals were determined, each department created departmental PP and decided on the four to five most relevant goals that were carried bottom up to the top managers. The goals that can be seen in the RPP (Figure 2) are a result of cooperation between all of the departments and layers in the company. As a consequence of a change in the leadership and a change in the PMS interviewed managers stated that the whole company’s mindset has changed. As employees became involved in goals creation and departmental and personal goals were aligned, employees stopped working as an individual. Moreover, middle managers realized that a key to success lies in the people. Before the RPP, managers didn’t see people management as one of their core tasks. Furthermore, managers stated in one of the interviews, that with the new PMS it was easier to determine a clear vision and strategy. Consequently, company was able to concentrate on strategically critical business objectives.
Figure 2: "Reversed Performance Pyramid" BSH Hišni aparati d.o.o
Source: BSH Hišni aparati, 2016
As an intermediate step, RPP has shown beneficial results but in order to have (i) the possibility of a balanced view of performance (cause and effect relationship between the individual
23
measures, linked together in a balance) and (ii) the option of KPI identification, company has to finish the management accounting change to BSC. As mentioned earlier in this WP, the BSC identifies four connected areas of activity that the authors (Kaplan and Norton, 1996) recognized as critical in almost every company and level of organization: (i) Investing, learning and growth capabilities; (ii) improving the efficiency of internal processes; (iii) providing customer value and (iv) increasing financial success. Moreover, BSC links the performance measures into a model that precisely reflects cause and effect relations between categories and individual measures. With management accounting change to BSC, the company has the possibility to identify KPIs. The company perceives KPIs as a helpful device to define the measures towards company’s goals and objectives. It would assist the company to measure if it is going in the right direction.
V. Conclusions
The aim of this WP is to contribute to a deeper insight regarding the management accounting changes, more precisely on management accounting change from PP to BSC. Its purpose was to answer the following research question: Why has the BSH moved from the PP to the BSC approach? The evidence from this WP suggests that changed environment and companies’ strategic orientation, values, and mission forced BSH to perform evaluation of the PMS system in use, to clarify if it delivers the desired business results (Gregory 1993; Waggoner et al. 1999). The company found that management accounting change was needed in order to have a PMS, that could serve as a strategic planning and communication device (Kaplan and Norton, 1996) and at the same time that could contribute for enhancing motivation, communication, accountability (Neely et al., 1996), and furthermore for identifying the potential innovation and growth (Bokmann and Gotta, 2000). The company has identified five objectives with the replace of PP by BSC: (i) the possibility to develop a balanced view of performance; (ii) the
24
ability to create a clear vision and strategy; (iii) the emphasis on strategically critical business objectives; (iv) the possibility to identify KPIs; and (v) the involvement of employees in the PMS creation. As an intermediate step in the management accounting change from PP to BSC, company created a new PMS framework, RPP. After adopting the RPP PMS, managers concluded that once employees got involved into the PMS creation, the company’s mindset started to change. Employees have adopted company’s goals as their own goals and they were motivated and determined to fulfil them. Moreover, with RPP company created a clearer vision and strategy and has concentrated on strategically critical business objectives. Until now, the process of change was perceived as successful, attracting strong, continuous and enthusiastic support from the top leadership. The company managers did not identify any implementation problems due to internal barriers (e.g. resistant attitudes to change, accounting stuff turnover, changing priorities during the process, etc.) (Cobb et al., 1995). The process of management accounting change from PP to BSC has not yet finished: the company expects it should be completed by the end of year 2016 with the implementation of the third step of the management accounting change process. With the third step, the company aims: (i) to create a BSC company’s framework that links the performance measures into cause and effect relations between categories and individual measures; and (ii) to identify the KPIs. Furthermore, the change to BSC is considered to allow the company: (i) to measure better if it is going in the right direction; (ii) to work towards company growth, (iii) to attain beneficial outcome; and (iv) to improve communication in the company.
There are some limitations of this study. Firstly, the lack of time available for the empirical study. Results would be more representable and credible, if there would be a possibility to conduct more interviews along different levels in the organizational structure of the company. Furthermore, the data analysed is confidential and it is a part of company’s competitive advantage. Consequently, the researcher was not able to collect all the desired evidence to
25
present a more detailed analysis of the management accounting changes undertaken by BSH Slovenia, namely about how the BSC was implemented and operated by managers. Suggestions for further research concern the analysis of how the BSC was implemented and how it is used by managers and how this approach helped managers to overcome the limitations of PP and RPP.
VI. Bibliography
Alvarez, J. L. 1998. “The Diffusion and Consumption of Business Knowledge.” London: Macmillan Press. Alvarez, J.L. 1998b. “The sociological tradition and the spread and institutionalization of knowledge for action.” The Diffusion and Consumption of Business Knowledge: 13-57. London: Macmillan.
Anthony, R. N., Dearden, J. and Bedford, N. M., 1984. “Management Control Systems.” IL, Irwin.
Atkinson, A., J. Waterhouse and R. Wells. 1997. “A Stakeholder Approach to Strategic Performance Measurement.” Sloan Management Review, 38(3): 25-37
Argyris, C., 1977. “Organizational learning and management information systems, Accounting.” Organizations and Society, 11: 1-23.
Argyris, C. and Kaplan, R. S., 1994. “Implementing new knowledge: The case of activity-based costing.”
Accounting Horizons, 8(3): 83-1 05.
Ax, C., and T. Bjørnenak. 2005. “Bundling and diffusion of management accounting innovations – the case of the Balanced Scorecard in Sweden.” Management Accounting Research, 16: 1-20.
Baddeley, A. 1994. “The magical number seven: still magic after all these years? Psychological Review, April, 353–356.
Banker, R. D., H. Chang and M. J. Pizzini. 2004. “The Balanced Scorecard: judgmental effects of performance measures linked to strategy.” The Accounting Review, 79(1): 1-23.
Bessire, D., and C. R. Baker. 2005. “The french Tableau de Bord and the American Balanced Scorecard: a critical analysis.” Critical Perspectives on Accounting, 16: 645-664.
Boje, D. M., 1996. “We need to re-critique reengineering!” Journal of Organizational Change Management, Vol. 9: No. 2, pp. 3
Böckmann, D. and Gotta, A. 2000. “Balanced Scorecard” Handbuch Marketing-Controlling, Berlin p. 267-279. Bromwich, M. and Bhimani, A., 1989. “Management Accounting: Evolution not Revolution.” CIMA London. BSH Group, Annual report 2014 BSH Group, BSH Hausgeräte GmbH
BSH Group, Annual report 2015 BSH Group, BSH Hausgeräte GmbH BSH Group, presentation and publication documents, BSH Hausgeräte GmbH
BSH Hišni aparati d.o.o., presentation and publication documents, BSH Hišni aparati d.o.o. BSH Hišni aparati d.o.o., Annual Report 2014, BSH Hišni aparati d.o.o.
BSH Hišni aparati d.o.o., presentation and publication documents, BSH Hišni aparati d.o.o.
BSH Hišni aparati d.o.o., employees interviews, 14.1.2016, 24.2.2016, 22.4.2016 and 18.5.2016, Company headquarters, Nazarje, Slovenia
Bukh, N. and T. Malmi. 2005. “Re-examining the cause-and-effect principle of the Balanced Scorecard.”
Accounting in Scandinavia – The Northern Lights, Liber AB: Liber & Copenhagen Business School Press,
26
Cao, Y., Zhao K., Yang, J., and Xiong, W. 2015. “Constructing the integrated strategic performance indicator system for manufacturing companies.” International Journal of Production Research, Volume 53, pages 4102-4116.
Chakravarthy, S. B. 1986. “Measuring Strategic Performance.” Strategic Management Journal, Volume 7, Issue 5, pages 437-458.
Chenhall, H. R. 2004. “The Role of Cognitive and Affective Conflict in Early Implementation of Activity‐Based Cost Management.” Behavioural Research in Accounting: February 2004, Vol. 16, No. 1, pp. 19-44.
Collis, D. J. and Montgomery, C. A., 1997. “Corporate Strategy: Resources and the Scope of the Firm.” IL, Irwin. Cross, K.F. and Lynch, R.L. 1989. “The SMART way to define and sustain success.” National Productivity
Review, vol. 8, no. 1, pp. 23-33.
Darrell K. Rigby. 2015. “Bain and Company Management Tools 2015- An executive’s guide.” Bain and Company, p. 68
Davis, S. and T. Albright. 2004. “An investigation of the effect of Balanced Scorecard implementation on financial performance.” Management Accounting Research, 15: 135-153.
Dearden, J. 1969. “The case against ROI control.” Harvard Business Review. May-June: 124-135.
De Hass, M. and A. Kleingeld. 1999. “Multilevel design of performance measurement systems: Enhancing strategic dialogue throughout the organization.” Management Accounting Research 10: 233-261.
Demirag, I. S., 1998. “Short-Term Performance Pressures, Corporate Governance, and Accountability: An Overview in Demirag.” I. S. ed. Corporate Governance, Accountability, and Pressures to Perform an International
Study, Connecticut, JAI Press Inc., pp. 7-24
Eccles, R. G., 1991. “The performance measurement manifesto.” Harvard Business Review, January-February, 131-137.
Edwards, P., 1972. “The Encyclopedia of Philosophy.” Macmillan Publishing, Volumes 1-8.
Emmanuel, C. and Otley, D., 1995.” Readings in Accounting for Management Control.” Chapmann and Hall. Ghalayini, A.M., Noble, J.S. and Crowe, T.J. 1997. “An integrated dynamic performance measurement system for improving manufacturing competitiveness.” International Journal of Production Economics, vol. 48, pp. 207-225. Hopwood, A.G., 1987. “Archaeology of accounting systems.” Accounting, Organizations and Society, 12(4): 207– 234.
Hopwood, A. G., 1972. “An empirical study of the role of accounting data in performance
evaluation, empirical research in accounting” Supplement to Journal of Accounting Research, 10: 156-182. Hopwood, A. G., 1973.Accounting and Human Behavior, New Jersey, Prentice-Hall.
Hoque, Z. 2003. “Total Quality Management and the Balanced Scorecard approach: a critical analysis of their potential relationships and directions for research.” Critical Perspectives on Accounting, 14: 553-566.
Innes, J., and F. Mitchell. 1990. “The Process of Change in Management Accounting: Some Field Study Evidence.” Management Accounting Research 1, 3-19.
Ittner, C.D. and D.F. Larcker. 1997. “Quality strategy, strategic control systems, and organizational performance.”
Accounting Organizations and Society, 22(3/4): 293-314.
Ittner, C.D. and Larcher, D.F. 2003. “Coming up short on nonfinancial performance measurement.” Harvard
business Review, November.
Jensen, M. 2001. “Value Maximization, Stakeholder Theory, and the Corporate Objective Function.” Journal of
Applied Corporate Finance, (Fall): 8-21.
Johnson, H.T. and Kaplan, R., 1987. ‘Relevance Lost: The Rise and Fall of Management Accounting.” Harvard University Press, Boston Mass.
Kaplan, Robert S., and D. P. Norton. 1992. “The Balanced Scorecard: measures that drive performance.” Harvard
Business Review, 70(1): 71-79.
Kaplan, Robert S., and D.P. Norton. 1996a. “The Balanced Scorecard: Translating Strategy into action.” Boston:
Harvard Business School Press.
Kaplan, Robert S., and D. P. Norton. 1996b. “Using the Balanced Scorecard as a Strategic Management System.”
27
Kaplan, Robert S., and D. P. Norton. 2001a. “The Strategy-Focused Organization: how balanced scorecard companies thrive in the new business environment.” Boston, MA: Harvard Business School Press.
Kaplan, Robert S. and D. P. Norton. 2001b). “Transforming the Balanced Scorecard from performance measurement to strategic management: Part I.” Accounting Horizons, 15(1): 87-104.
Kaplan, Robert S., and D. P. Norton. 2004. “Strategy maps: converting intangible assets into tangible outcomes.”
Boston: Harvard Business School Press.
Kaplan, Robert S., and D. P. Norton. 2006. “Alignment: Using the Balanced Scorecard to Create Corporate Synergies.” Boston: Harvard Business School Press.
Kasurinen, T. 2002. “Exploring management accounting change: the case of Balanced Scorecard implementation.”
Management Accounting Research, 13: 323-343.
Kiechel, W., 1984. “Snipping at strategic planning’” Planning Review, May, 8-11.
Kraus, K. and J. Lind. 2010. “The impact of the corporate balanced scorecard on corporate control – A research note.” Management Accounting Research, 21(4): 265- 277.
Lawrence, S. and S. Sharma, 2002. “Commodification of Education and Academic labour - Using the Balanced Scorecard in a University Setting. “Critical Perspectives on Accounting, 13(5- 6):661-677
Lipe, M. G. and S. E. Salterio. 2000. “The Balanced Scorecard: judgmental effects of common and unique performance measures.” The Accounting Review, 75 (3): 283-298.
Lipe, M. G. and S. Salterio. 2002. “A note on the judgmental effects of the Balanced Scorecard’s information organization.” Accounting, Organizations and Society, 27: 531- 540.
Luft, J. and M. D. Shields. 1999. “Accounting classification of expenditures on intangibles: Cognitive causes of managerial myopia.” Working paper, Michigan State University.
Lynch, R. L. and K. F. Cross. 1995. “Measure Up! Yardsticks for Continuous Improvement.” Cambridge, MA:
Blackwell Business.
Maciariello, J. A. and Kirby, C. J., 1994. “Management Control Systems” N.J., Prentice Hall.
Malina, M. A. and F. H. Selto. 2001. “Communicating and controlling strategy: an empirical study of the effectiveness of the Balanced Scorecard.” Journal of Management Accounting Research, 13: 47-90.
Malmi, T. 2001. “Balanced Scorecards in Finnish companies: a research note.” Management Accounting Research, 12(2): 207-220.
Marr, B. and Schiuma, G. (2003). “Business Performance Measurement- Past, Present and Future.” Management
Decision, 41(8), 680-687.
McKenzie, F. C. and M. D. Schilling. 1998. “Avoiding performance measurement traps: Ensuring effective incentive designs and implementation.” Compensation and Benefits Review
30(4): 57-65.
Major, M., and T. Hopper. 2005. “Managers Divided: Implementing ABC in a Portuguese Telecommunications Company.” Management Accounting Research 16: 205-229.
Merchant, K. A. 1989. “Rewarding Results: Motivating Profit Center Managers.” Boston, MA: Harvard Business School Press.
Miller, G.1956. “The magical number seven, plus or minus two: Some limits on our capacity for information processing.” The Psychological Review, March, 81–96.
Mintzberg, H. 1994. “The fall and rise of strategic planning.” Harvard Business Review, January/Fabruary. Modell, S. 2007. “Management Accounting Change.” Issues in management accounting, Harlow, Financial Times
Prentice Hall, p. 335-356
Neely, A. 1999. “The Performance Measurement Revolution: Why Now and What next?” International Journal
of Operations & Production Management, 19(2): 205-228.
Nørreklit, L. and Schoenfeld, H. M., 1996. ‘Resources of the Firm, Creating, Controlling and Accounting.” DJØF
Publishing.
Nørreklit, H. 2000. “The balance on the Balanced Scorecard – a critical analysis of some of its assumptions.”
Management Accounting Research, 11(1): 65-88.
Nørreklit, H. 2003. “The Balanced Scorecard: what is the score? A rhetorical analysis of the Balanced Scorecard.”
28
Otley, D.1999. “Performance management: a framework for management control systems research.” Management
Accounting Research, 10(4): 363-382.
Parker, L. D., 1979. “Divisional performance measurement: beyond an exclusive profit test.” Accounting and
Business Research, Autumn, 309-3 19.
Pimentel, L. and M. J. Major. 2009. “Management Accounting Change: A Case Study of Balanced Scorecard Implementation in a Portuguese Service Company.” Portuguese Journal of Accounting and Management, 8: 89-109.
Quattrone, P. and Hopper, T. 2005. “A Time-Space Odyssey: Management Control Systems in Two Multinational Organizations.” Accounting, Organizations and Society, 30(7): 735-764.
Selznick, P. 1957. “Leadership in Administration.” New York: Harper & Row.
Schoenfeld, H. M., 1986. “The Present State of Performance Evaluation in Multinational.” Managerial Accounting
and Analysis in Multinational Enterprises, Berlin, Walter de Gruyter, pp. 217-252.
Shavelson, R. J., and Towne, L. 2002. “Scientific research in education.” Washington, DC: National Research
Council, National Academy Press.
Silk, S. 1998. “Automating the balanced scorecard.” Management Accounting 79(11): 38-42.
Simons, R. 2000. “Performance Measurement & Control Systems for Implementing Strategy.” Upper Saddle
River, NJ: Prentice Hall.
Speckbacher, G., J. Bischof and T. Pfeiffer. 2003. “A descriptive analysis on the implementation of Balanced Scorecards in German-speaking countries.” Management Accounting Research, 14(3): 361-387.
Striteska, M., and Spickova, M. 2012. “Review and Comparison of Performance Measurement Systems.” Journal
of Organizational Management Studies, Vol. 2012:13 pages.
Sundin, H., M. Granlund, and D. A. Brown. 2010. “Balancing multiple competing objectives with a Balanced Scorecard.” European Accounting Review, 19(2): 203-246.
Tangen, S. 2004. “Performance measurement: from philosophy to practice.” International Journal of Productivity and Performance Management, Vol. 53, pp. 726-737.
Tayler, W. B. 2010. “The Balanced Scorecard as a strategy-evaluation tool: the effects of implementation involvement and a causal-chain focus.” The Accounting Review, 85(3):1095-1117.
Tuomela, T. 2005. “The interplay of different levers of control: a case study of introducing a new performance measurement system.” Management Accounting Research, 16: 293-320.
Tsamenyi, M., Cullen, J., and Gonzales J.M.G, 2006. “Changes in accounting and financial information system in a Spanish electricity company: A new institutional theory analysis.” Management Accounting Research, 17(4):409-432
Vancil, R. F. 1979. “Decentralization: Managerial Ambiguity by Design.” Homewood, Ill.: Dow Jones-Irwin. Wanderley, C., Cullen, J., and Tsamenyi, M. 2013. “Diffusion and Variation in Management Accounting Practices:
The Balanced Scorecard adoption.” Paper presented at the 9th International Conference of the Management
Control Association.
Weber, C. and Hainz C. 2006. “Performance Measurement within CRM.” Seminar paper, At the Department of
Informatics; Information Systems Research Group, University of Fribourg/Switzerland.
Wefers, M. 2000. “Strategische Unternehmensführung mit der IV-gestützen Balanced Scorecard.”
Wirtschaftsinformatik, No. 2, p. 123-130.
Werner, H. 2000. “Die Balanced Scorecard – Hintergründe, Ziele und kritische Würdigung” WiSt, No. 8, p. 455-457.
Williams, S. (2001). “Drive Your Business Forward with the Balanced Scorecard.” Management Services, (45)6: 28-30.
Yazdifar, H. and Tsamenyi, M. 2005. “Management accounting change and the changing roles of management accountants: a comparative analysis between dependent and independent organizations.” Journal of Accounting &
Organizational Change 1,2: 180-198.
Yin, Robert K. 2009. Case Study Research: Design and Methods, 4th ed. Los Angeles: Sage Publications, Thousand Oaks.