CRITICAL APPLICATIONS OF SW 846 US EPA METHODS TO EVALUATION OF
MARINE SAMPLES QUALITY*
Patrícia Ferreira Silvério1**; Cristina Gonçalves1; Satie Taniguchi2 and Sylvia Niemeyer Pinheiro Lima1
1Consultoria Paulista de Estudos Ambientais Ltda EPP
(Rua Henrique Monteiro, 90 – 13º andar – 05423-020 São Paulo, SP, Brasil)
2Instituto Oceanográfico da Universidade de São Paulo
(Praça do Oceanográfico, 191, 05508-120 São Paulo, SP, Brasil)
**Correpoding author: [email protected]
A
B S T R A C TTechnical evaluation of analytical data is of extreme relevance considering it can be used for comparisons with environmental quality standards and decision-making as related to the management of disposal of dredged sediments and the evaluation of salt and brackish water quality in accordance with CONAMA 357/05 Resolution. It is, therefore, essential that the project manager discusses the environmental agency´s technical requirements with the laboratory contracted for the follow-up of the analysis underway and even with a view to possible re-analysis when anomalous data are identified. The main technical requirements are: (1) method quantitation limits (QLs) should fall below environmental standards; (2) analyses should be carried out in laboratories whose analytical scope is accredited by the National Institute of Metrology (INMETRO) or qualified or accepted by a licensing agency; (3) chain of custody should be provided in order to ensure sample traceability; (4) control charts should be provided to prove method performance; (5) certified reference material analysis or, if that is not available, matrix spike analysis, should be undertaken and (6) chromatograms should be included in the analytical report. Within this context and with a view to helping environmental managers in analytical report evaluation, this work has as objectives the discussion of the limitations of the application of SW 846 US EPA methods to marine samples, the consequences of having data based on method detection limits (MDL) and not sample quantitation limits (SQL), and present possible modifications of the principal method applied by laboratories in order to comply with environmental quality standards.
R
E S U M OAvaliação técnica do resultado analítico é de extrema relevância, pois o mesmo será utilizado para comparação com legislações e tomadas de decisão, tais como, disposição adequada de sedimento dragado e avaliação da qualidade de água superficial salobra e salina frente à classificação da Resolução CONAMA 357/05. É fundamental que o gestor ambiental discuta com o laboratório contratado as recomendações e exigências técnicas da legislação em questão e do órgão ambiental, acompanhe o andamento das análises e solicite re-análise, quando há suspeita de resultados anômalos. As principais recomendações técnicas são: (1) limites de quantificação do método (LQs) inferiores aos padrões ambientais; (2) análises realizadas em laboratórios cujo escopo analítico esteja acreditado pelo Instituto Nacional de Metrologia (INMETRO) ou qualificado ou aceito pelo órgão ambiental licenciador; (3) cadeia-de-custódia para rastreabilidade das amostras; (4) cartas-controle para evidência de desempenho do método analítico empregado pelo laboratório; (5) análise com material de referência certificado ou, em sua ausência, ensaios realizados por adição padrão ou adição de reforço e (6) apresentação de cromatogramas para as análises realizadas por cromatografia. Dentro deste contexto, visando auxiliar o gestor ambiental na avaliação dos relatórios de ensaio, este trabalho tem como objetivo discutir as aplicações dos métodos SW 846 da US EPA usados para as matrizes marinhas, as implicações de basear os estudos em limites de detecção (LDM) e não nos de quantificação da amostra (LQA) e discutir modificações de metodologia propostas para atendimento aos padrões de qualidade.
Descriptors: Sediment, SW 846 methods, Quantitation limit, Salt and brackish water, Interferences. Descritores: Sedimento, Métodos SW 846, Limite de quantificação, Água salgada e salobra, Interferências.
___________
I
NTRODUCTIONAnalytical chemistry has been used as a valuable tool in environmental studies, being one of the bases for decision-making. It is, therefore, applied in ecotoxicology, environmental investigations and monitoring, among others, representing up to 40% of a project´s total budget. Thus the data obtained should be reliable in order to avoid additional, unexpected expenditure on resampling and reanalysis.
Attaining the low levels established by environmental regulations is one of the main limitations for laboratories which work with analytical marine chemistry, i.e., practical quantitation limits obtained by SW 846 methods are generally higher than the reference values, thus making it difficult to use analytical data for environmental purposes.
SW 846 is a US EPA publication, entitled
Test Methods for Evaluating Solid Waste,
Physical/Chemical Methods. It is a free official compendium of analytical and sampling methods available on the internet. It has been largely used by Brazilian laboratories for chemical analyses of environmental matrices such as soil, sediment, waste, water and wastewater. The choice of the appropriate sequence of analytical methods depends on the information sought and on the experience of the analyst.
SW 846 methods always refer to practical quantitation limits; however, there is no consensus among the environmental experts about the meaning and applicability of detection limits (DL) and quantitation limits (QL). This study presents the most common analytical interferences that can increase marine sample quantitation limits (SQL) when applying SW 846 methods, making SQLs rise above the reference values, and discuss analytical alternatives to achieve lower limits.
Definitions of Analytical Limits
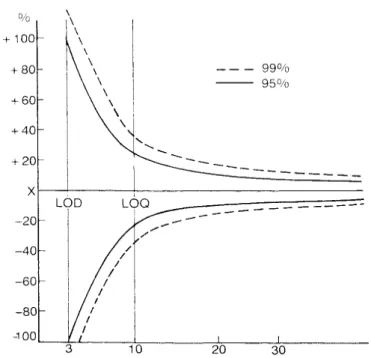
A measured value becomes reliable when it is larger than the uncertainty associated with it. The point at which this occurs is called the detection limit and it is defined as 3s0 (uncertainty is ± 100% at 95%
confidence). The lower level at which measurements become quantitatively meaningful has been called the quantitation limit and it is defined arbitrarily as 10s0.
According to the American Chemical Society Committee on Environmental Improvement, at this concentration, the relative confidence in the measured value is about ± 30% at the 95% probability level (Fig. 1). To evaluate s0, seven samples containing a
small but measurable amount of analyte should be measured (TAYLOR, 1987; US CFR, 2009).
Detection Limit
The detection limit of an individual analytical procedure is the lowest amount of analyte in a sample which can be detected but not necessarily quantified as an exact value. The detection limit is based more upon the sensitivity of an analytical instrument and will only rarely account for the full range of matrix effects that are normally encountered with environmental samples (US EPA, 2009a).
Method Detection Limit (MDL)
Method Detection Limit (MDL) is found in
environmental data reports, despite the high degree of uncertainty associated with it. The procedure for determining the MDL is defined in the United States Code of Federal Regulations (40 CFR part 136, Appendix B, 2009). MDL is a statistically defined number based upon the standard deviation of seven replicate analyses of a standard. MDL is determined for each analyte, by matrix, and corresponds to the minimum concentration of an analyte that can be determined with 99% confidence, whose true value is greater than zero.
The Method Detection Limit is the basis for determining Practical Quantitation Limits, along with the professional judgment of the chemist experienced with the particular analyte and method.
Instrument Detection Limit (IDL)
Instrument Detection Limit (IDL) is the
lowest concentration that can be detected by an instrument without correction for the effects of sample matrix or method-specific parameters such as sample preparation. IDLs are statistically determined based upon direct measurements. The IDL is based on the ability of a detector to distinguish between signal and noise.
If the method used is entirely instrumental, i.e., no chemical or other procedural steps are involved, the signal-to-noise has some relation to MDL (TAYLOR, 1987; US EPA, 2009a).
IDL is the basis for selecting the most appropriate technique to attain the quantitation limits required for the project.
Quantitation Limits
A quantitation limit is the lowest amount of an analyte in a sample which can be quantitatively determined with suitable precision and accuracy. The quantitation limit differs from the detection limit in that it takes into account sample matrix effects. Unfortunately, like detection limits, there are a variety of quantitation limits that are reported with
environmental data such as practical quantitation limit and sample quantitation limit. SQLs take into account sample characteristics, sample preparation and analytical adjustments, therefore, these values are the most relevant QLs (US EPA, 2009b).
Practical Quantitation Limit (PQL)
Practical Quantitation Limit (PQL) is the
lowest concentration that can be reliably achieved within specified limits of precision and accuracy under routine laboratory operating conditions. Most SW 846 methods give PQLs which are often set at some multiple of typical MDLs for reagent water.
PQL = [Method Detection Limit] X [Factor]
The multiplying factors vary according to the matrix evaluated: salt or brackish water and sediment. In general, practical quantitation limit should be approximately five to 10 times the MDL (SCHOLZ; FLORY, 1999).
Additionally PQLs listed for sediment are typically reported on a wet-weight basis. However, reported data must be on dry-weight basis, increasing SQLs, described in the section below.
Sample Quantitation Limit (SQL)
Sample Quantitation Limit (SQL) is, in
general, like the PQL. As this limit is unique for each sample it is not specifically mentioned in SW 846, therefore, it is the one that has to be presented in analytical reports. The SQL represents a quantitation limit adjusted to reflect sample-specific procedures, such as dilution, use of smaller aliquot sizes, matrix effects, and moisture (US EPA 2009b).
Seeing that data are reported on a dry-weight basis, SQLs will be higher than PQLs, varying according to percentage dry weight in each sample, unless the laboratory dries the sample before performing the analysis. In this case, additional care is necessary in order to avoid target-analyte losses, especially naphthalene and mercury, which are parameters normally evaluated for dredged material assessments.
Therefore it is always appropriate to discuss with the laboratory if the reported SQL was determined on a dry or wet-weight basis and what specific weighting factors were used for calculating it.
It should be noticed that analytical limits involve standard deviations (s0) and these are not
unique constants of the methodology; ordinarily they will depend on the expertise of the chemist, the quality control procedures adopted by the laboratory and on the matrix measured. Thus two analysts or laboratories using the same methodology can show significant differences in precision, and PQL or SQL will differ.
D
ISCUSSIONThe most important current federal laws related to marine sampling are Resolutions 344/04 (CONAMA, 2009a), for sediments, and 357/05 (CONAMA, 2009b), for waters. Resolution 344 establishes general guidelines and minimal protocol for the assessment of the sediments to be dredged in Brazilian jurisdictional waters.
The evaluation of contaminants in the dredged material is an important line of evidence to be assessed in order to prevent occasional damage to the environment and adverse effects to marine biota during dredging and disposal operations. CONAMA 344/04 resolution presents a list of contaminants to be determined in the sediments, such as metals and semi-metals (As, Cd, Pb, Cu, Cr, Ni, Hg and Zn), total PCB, PAH and organochlorine pesticides.
Water quality has to be evaluated simultaneously for the same parameters. The values obtained are to be compared to those given in CONAMA Resolution 357/05 (article 21).
Each group of analytes is discussed below.
Metals
According to SW 846, the methods available for the analyses of metals are those listed in the 6000 and 7000 series. As flame atomic absorption spectrophotometry, by the 7000B method (US EPA, 2009c), is not suitable for attaining the limits required for marine samples, the most usual methodology employed for the determination of metals is SW 846
US EPA6010C (US EPA, 2009d). It recommends the following wavelengths for ICP-OES (inductively coupled argon plasma by optical emission spectrometry) analysis of the elements listed in CONAMA 344 (2004): 193.696 nm (arsenic), 226.502 nm (cadmium), 220.353 nm (lead), 324.754 nm (copper), 267.716 nm (chromium), 231.604 nm (nickel), and 213.856 nm (zinc).
This method is adequate for marine samples seeing that ICP-OES is versatile equipment, providing rapid and multi elementary determination and low quantitation limits.
However, in order to use it for marine assessments, it is recommended that an inter element correction (IEC) study be undertaken, this consists of the evaluation of potential interferents in sediments, such as iron, aluminum, on the elements wavelengths studied. A mathematical equation is generated by this study, which can be applied to obtain actual metal concentration.
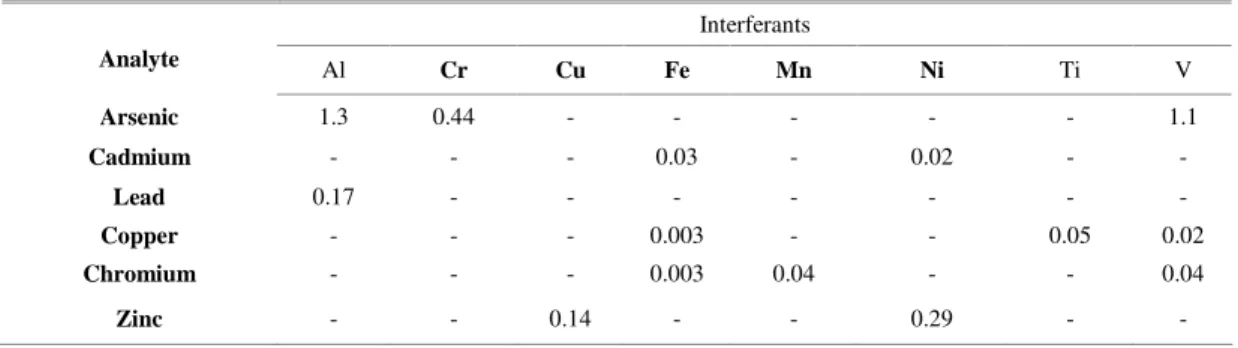
According to SW 846 US EPA 6010C (2009d), the contributions of false positives may lead to inappropriate conclusions about the area investigated. As may be observed in Table 1, a salt or brackish water with 10 mg L-1 of Al will contribute
with 130ppb and 17ppb to the final concentrations of As and Pb, respectively. For sediments, the interelement contribution will vary with the mass weighed and final volume for analysis. Assuming two grams and a final volume of 100 mL, a sediment sample with 1% of iron will have a false positive result of 3 mg kg-1 for cadmium, unless IEC is used.
Gonçalves et al. (2008) evaluated interelement contribution by determining the metals and semi-metals required by CONAMA Resolution 344/04 and comparing the results obtained by applying and not applying the interelement correction equation. It was observed that cadmium was below QL when a mathematical correction was used and between 3 and 6 mg kg-1, without it; zinc values were 20% higher and
chromium, 10%.
Table 1. Potential interferences and analyte concentration equivalents (mg L-1) arising from interference at the 100-mg L-1 level
(US EPA, 2009d).
Interferants
Analyte Al Cr Cu Fe Mn Ni Ti V
Arsenic 1.3 0.44 - - - 1.1
Cadmium - - - 0.03 - 0.02 - -
Lead 0.17 - - - -
Copper - - - 0.003 - - 0.05 0.02
Chromium - - - 0.003 0.04 - - 0.04
Although not regularly used by all laboratories, interelement correction application is crucial for dredged sediment quality investigation, seeing that its absence from the metal concentration calculation may lead to an erroneous decision concerning dredged material disposal.
SW 846 US EPA 6010C (2009d) is also applicable to salt and brackish water. However, due to its high dissolved solid content, it is necessary to use a nebulizer designed for this purpose.
Organic
c
ompoundsAmong the regulated organic contaminants, the main ones under investigation are polynuclear aromatic hydrocarbons (PAH), polychlorinated biphenyls (PCB) and organochlorine pesticides. The suggested SW 846 methods for determination of these compounds are:
• PAHs: 8270D by Gas Chromatography/Mass Spectrometry - GC-MS (US EPA, 2009e), 8310 by High Performance Liquid Chromatography - HPLC (US EPA, 2009f) or 8100 by Gas Chromatography/ Flame Ionization Detector - GC-FID, US EPA 2009g);
• PCBs: 8270D by GC-MS (US EPA, 2009e) or 8082A by Gas Chromatography/Electron Capture Detector - GC-ECD (US EPA, 2009h);
• Organochlorine pesticides: 8270D by GC-MS (US EPA, 2009e) or 8081B by GC-ECD (US EPA, 2009i).
Although the 8100 method (US EPA, 2009g) is still used, it is not recommended for marine studies, as it cannot resolve some PAHs adequately. Moreover, FID is not a selective detector, being subject to interferences and consequently liable to false responses. PAH determination by this method can mislead the environmental manager and inappropriate conclusions may be drawn.
The 8310 method (US EPA, 2009f) provides low limits for PAHs. Nevertheless, as detection is obtained by ultraviolet (UV) and fluorescence detectors, its application in marine investigations becomes questionable, considering that some compounds in brackish and marine samples fluoresce. Due to the reasons related above, the most commonly used method for organic compound analyses is 8270D, by GC-MS. If the complete method is strictly followed, laboratory will provide 10 µg L-1,
for water, and 660 µg kg-1 for sediments, which do not
comply with the limits required by CONAMA Resolutions 357/05 (0.018 µg L-1) and 344/04
(6.22-600 µg kg-1). In order to meet clients´ data quality
objectives, laboratories have opted to run samples using the selected ion monitoring (SIM) mode to achieve lower limits. Thus, 0.025 µg L-1, for water,
and 3.3 µg kg-1, for sediment, are an attainable, since a
concentration factor of 4,000 times is applied to water and 30g to a final volume of 1 mL is used for sediment.
It is important to mention that using larger sample amounts and the SIM mode aiming at lower limits is generally applicable to samples with a reduced amount of interferants. The presence of interferences in the sample may contribute to misquantification seeing that SIM may provide a lesser degree of confidence in the compound identification, since less mass spectral information is available (US EPA, 2009j). Moreover, interferences may not allow validating sample analysis due to coelution with surrogate compounds, leading to false positive results or reaction with them, leading to lower results.
It is possible to achieve lower limits by adopting other techniques instead of the SW 846 USEPA 8270D method (US EPA, 2009k). Thus, organochlorine pesticides and PCB can be detected with a higher sensitivity as they are determined by GC-ECD (SW 846 US EPA 8081B and 8082A, respectively), because gas chromatographies coupled with selective detectors provide lower limits than GC-MS.
GC-ECD (electron capture detector) allows the achievement of a very low quantitation limit (around 10 ng L-1 for water and 300 ng Kg-1 for
sediment). Such limits are not found using EPA 8270D.
The selective detectors response is excellent; however, they are more prone to false results than GC-MS, making it imperative that means should be found to avoid these latter. Most common analytical interferences in chromatographic methods are presented below.
Analytical Interferences
Undoubtedly chromatographic methods can be used to produce data of appropriate quality for environmental analyses. However, data quality can be greatly enhanced when the laboratory understands both the intended use of the results and the limitations of the specific analytical procedures being employed (US EPA, 2009k). Methods are subjected to several interferences, such as co-elution, matrix effect and moisture, among others.
Co-elution
Many chromatographic interferences result from co-elution of one or more compounds with the analyte of interest, or may be the result of the presence of a non-analyte peak in the retention time window of an analyte.
to have two dissimilar columns, with completely different chemical compositions: one for identification and the other for confirmation. Co-elution problems may affect quantitation as well as identification, and result in poor agreement between the quantitative results from two dissimilar columns.
Matrix Effect
The main limitation of chromatographic methods to achieve lower limits is the matrix effect. Samples with a very high concentration of one or more compounds can show higher limits due to the necessary dilution factor that should be considered in SQL. Two situations can occur: 1) the requirement of dilution in order to bring one or more target analytes within the calibration range; 2) the requirement of dilution due to interferences caused by non-target analytes and they should be overcome. In both cases the carry-over of compounds from one sample to the next, contamination of the analytical instrument itself and chromatographic column damage may occur.
In the second case, an additional cleanup step is required. This process will depend on the type of analysis and interfering analyte: silica gel is used when the interfering compounds are of a different polarity from the target analyte (US EPA, 2009l), florisil mostly for organochlorine pesticides and PCBs (US EPA, 2009m). Sulfuric acid/permanganate cleanup (US EPA, 2009n) is suitable only for PCBs as it destroys most organic chemicals.
Solubility of sulfur in dichloromethane (solvent used for extraction) is very similar to that of the organochlorine pesticides, and it can interfere in the analysis as sulfur is quite evident in GC-ECD (US EPA, 2009i) and masks the region within the solvent and the Aldrin correspondent peak. As a florisil cleanup will not eliminate this interference, powdered copper may be required (US EPA, 2009o).
However, a clean-up may not be enough to eliminate interference. During organochlorine pesticide analysis by the 8081B method, DDT breakdown in DDE and DDD and/or endrin breakdown in endrin aldehyde and endrin ketone can occur, leading to lower DDT and/or endrin results and higher DDE/DDD/ endrin aldehyde/endrin ketone results.
A sediment sample for PAH analysis, for example, can be so rich in aliphatic hydrocarbons that the cleanup process is not sufficient to eliminate this interference. Thus separation is required to obtain a cleaner chromatogram in order to avoid false positive results that lead to a high sample quantitation limit.
Moisture
Another sample characteristic affecting its quantitation limits is the moisture percentage. Highly
humid sediment, for instance, tends to show higher limits. If the PQL for a specific analyte is 100 µg kg-1
and the sediment has 30% of moisture, its SQL will be 143 µg kg-1 whilst a 60% moisturized sediment will
present a SQL of 250 µg kg-1.
Analytical Alternatives to Improve the Quantitation Limits
As stated above, to obtain an unquestionable environmental analysis, it would be necessary that sample quantitation limits fall below or be equal to the levels established by environmental legislations. New techniques have been developed allowing the attainment of lower limits, such as ICP-MS for metals and high resolution GC-MS for organic compounds. However, the costs associated with these instrumentations are generally several orders of magnitude higher than the Project budget. Thus, modifications in the standardized methodologies become the best alternative for the attainment of lower quantitation limits. Generally, the additional steps before analysis are increased.
One example is the introduction of the PTV (programmable temperature vaporization) technique. It permits the injection of 50 µL or more of extract while with the routine analysis only 1 µL is injected. Analytical sensitivity is, thus, greatly enhanced for analytes with low concentrations. Norlock and collaborators (2002) analyzed PAHs in sediment samples using the PTV-GC-MS technique. MDL for the sum of the sixteen priority PAHs was 1.4 µg kg-1,
using 10g of sample and three multiple injections of 20 µL of extract. For the same compounds, US EPA 8270 establishes 660 µg kg-1 for each PAH such as
PQL using 15 g and 1 µL of extract.
Modification of US EPA 7470A/7471A (US EPA, 2009p; 2009q) methods permits lower quantitation limits for mercury. This is possible by inserting a gold trap in the CV AAS technique to amalgamate the Hg0 vapor formed and heat it to
volatilize mercury for analysis. The quantitation limit will depend on the volume of sample used to trap the mercury by the use of gold.
For clean samples, the use of a higher volume or weight of sample and/or smaller final volume contributes to decrease SQL. This alternative is impracticable for dirty samples. If the sample contains a group of target analytes at high concentrations, the efficiency of extraction will be insufficient, leading to lower values than those expected. If the sample is contaminated with non-target analytes, these will contribute to the production of matrix effects.
obtaining of a cleaner extract, avoiding high dilution factors.
It is not to be recommended that sediment samples should be dried before analysis because target analytes can be lost, as has already been stated. An aliquot of a sample may be measured for moisture level before the preparation step. According to its humidity, the laboratory can weigh out a larger mass to compensate for it. However, this procedure is not applicable to contaminated sediments.
C
ONCLUSIONIn the quantitative analysis field, method detection limits are used as a tool to obtain sample quantitation limits, which allows a borderline between numbers and analytical results to be established. This depends on the whole analytical process adopted by the laboratory, including its QA/QC Laboratory Policy.
Analytical laboratories are subject to different experimental conditions and consequently different MDLs. Laboratories must, therefore, prove how low an SQL can be reported by annual MDL studies and precision and accuracy tests.
Laboratories will rarely provide the QLs needed for a particular project without having the necessary information about client data quality objectives. Consultant companies must, therefore, work together to obtain quantitation limits comparable to environmental reference values. However, as presented in this study, it is crucial to keep in mind that these SQLs will not depend only on the applicable legislation but also greatly on matrix characteristics.
Obviously there are alternative means of meeting Project Objectives, such as PTV for SVOC compounds, PAHs analysis by SIM mode in GC-MS, dual-column GC-ECD for PCB and organochlorine pesticides, gold trap for mercury, higher initial volume or mass of sample, lower final volume of extracts, among others, and the laboratories have to consider them The most appropriate alternative will vary according to target analytes, matrix effects and the experience of the analyst.
R
EFERENCESCONAMA (Conselho Nacional do Meio Ambiente). 2009a. Resolução no. 344, 25 de março de 2004. Available at <www.mma.gov.br/port/CONAMA/res/res04/res34404.x ml> accessed February, 2009.
CONAMA (Conselho Nacional do Meio Ambiente). 2009b. Resolução no. 357, 17 de março de 2005. Available at <www.mma.gov.br/port/conama/res/res05/res35705.pdf > accessed in February, 2009.
GONÇALVES, C; YAMAMOTO, C. R.; TURQUIA, S.; SILVÉRIO, P.; NIEMEYER, S. Aplicação de correção interelementar por ICP-OES a material dragado em ambientes marinhos. In: CONGRESO IBEROAMERICANO DE FÍSICA Y QUÍMICA AMBIENTAL, 5., 2008 Libro de Resumenes… Mar del Plata, Argentina. Sociedad Iberoamericana de Física y Química Ambiental, España. 2008.
NORLOCK, F. M.; JANG J.; ZOU Q.; SCHOONOVER T.M; LI A. J. Large-Volume injection PTV-GC-MS Analysis of Polycyclic Aromatic Hydrocarbons in air and sediment samples. Air & Waste Mange.Assoc., v. 52, p. 19-26, 2002.
SCHOLZ, T. G.; FLORY, D. A. Clearing up the confusion. Environ. Protect., v. 10, p. 37-41, 1999. 1999. TAYLOR, J. K. Quality assurance of chemical
measurements. 1st ed. Lewis Publishers. Boca Raton,
Fla.: CRC Press, 1987. 328 p.
US CFR. Code of Federal Regulations Title 40: Protection of Environment, Part 136 – Guidelines establishing test procedures for the analyses of pollutants, Appendix B to Part 136 – definition and procedure for the determination of Method Detection Limit rev. 1.11. Available at <http://ecfr.gpoaccess.gov> accessed in February, 2009. US EPA. Tier I Data Validation Manual for the Ohio EPA
Division of Hazardous Waste Management, February 7, 2006, Revision 4.0, 2009a. 124 p. Available at <www.epa.state.oh.us/dhwm/pdf/TierIDVManual.pdf> accessed in February, 2009.
US EPA Office of Emergency and remedial response, Washington DC. 2009. Risk Assessment guidance for superfund – V. I: Human Health Evaluation Manual (Part A) – Chapter 5, EPA/540/1-89/002, 1999.
Available at
<www.epa.gov/oswer/riskassessment/ragsa/ch5.pdf> accessed in February, 2009.
US EPA. Method 7000B – Flame Atomic Absorption Spectrometry, Feb. 2007, rev.02, 72 p. Available at <www.epa.gov/epaoswer/hazwaste/test/pdfs/7000b.pdf> accessed in February, 2009c.
US EPA. Method 6010C – Inductively coupled plasma – Atomic emission spectrometry, Feb. 2007, rev.03, 72 p.
Available at
<www.epa.gov/epaoswer/hazwaste/test/pdfs/6010c.pdf> accessed in February, 2009d.
US EPA. Method 8270D – Semivolatile Organic Compounds by Gas Chromatography/Mass Spectrometry (GC/MS), Feb. 2007, rev.04, 72 p. Available at <www.epa.gov/epaoswer/hazwaste/test/pdfs/8270d.pdf> accessed in February, 2009e.
US EPA. Method 8310 – Polynuclear Aromatic Hydrocarbons, Sep. 1986, rev.00, 13 p. Available at <www.epa.gov/epaoswer/hazwaste/test/pdfs/8310.pdf> accessed in February, 2009f.
US EPA. Method 8100 – Polynuclear Aromatic Hydrocarbons, Sep.. 1986, rev.00, 10 p. Available at <www.epa.gov/epaoswer/hazwaste/test/pdfs/8100.pdf> accessed in February, 2009g.
US EPA. Method 8082A – Polychlorinated Biphenyls (PCBs) by Gas Chromatography, Feb. 2007, rev.01, 56
p. Available at
US EPA. Method 8081B – Organochlorine Pesticides by Gas Chromatography, Feb. 2007, rev.02, 57 p. Available at <www.epa.gov/epaoswer/hazwaste/test/pdfs/8081b.pdf> accessed in February, 2009i.
US EPA. Superfund Analytical Services/Contract Laboratory Program (CLP), Multi-Media, Multi-Concentration Organics Analysis, SOM01.2, Exhibit D - Analytical Method for the Analysis of Semivolatile Organic Compounds, May, 2005 Available at <http://nsdi.epa.gov/superfund/programs/clp/som1.htm# pdf> accessed in February, 2009j.
US EPA. Method 8000C – Determinative Chromatographic Separations, March 2003, rev.03, 66 p. Available at <www.epa.gov/epawaste/hazard/testmethods/sw846/new _meth.htm#8000C> accessed in February, 2009k. US EPA. 3630C – Silica gel Cleanup, Dec 1996, rev.03, 15 p.
Available at
<www.epa.gov/epaoswer/hazwaste/test/pdfs/3630c.pdf> accessed in February, 2009l.
US EPA. Method 3620C – Florisil Cleanup, Feb 2007, rev.
03, 27 p. Available at
<www.epa.gov/epaoswer/hazwaste/test/pdfs/3620c.pdf> accessed in February, 2009m.
US EPA. Method 3665A – Sulfuric acid/Permanganate Cleanup, Dec 1996, rev.01, 5 p. Available at <www.epa.gov/epaoswer/hazwaste/test/pdfs/3665a.pdf> accessed February, 2009n.
US EPA. Method 3660B – Sulfur Cleanup, Dec 1996, rev.
02, 6 p. Available at
<www.epa.gov/epaoswer/hazwaste/test/pdfs/3660b.pdf> accessed February, 2009o.
US EPA. Method 7470A – Mercury in liquid waste (manual cold-vapor technique), September 1994,
rev.01, 6 p. Available at
<www.epa.gov/epaoswer/hazwaste/test/pdfs/7470a.pdf> accessed February, 2009p.
US EPA. Method 7471B – Mercury in solid or semisolid waste (manual cold-vapor technique), February 2007,
rev.02, 11 p. Available at
<www.epa.gov/epaoswer/hazwaste/test/pdfs/7471b.pdf> accessed February, 2009q.
WSDA (Washington State Department of Agriculture) and WSDE (Washington State Department of Ecology). Ecology Publication no. 04-03-048 - Surface Water Monitoring Program for Pesticides in Salmonid-Bearing Streams, April to December, 2003 – Nov. 2004.
2009. 110 p. Available at
<www.ecy.wa.gov/biblio/0403048.html> accessed in February, 2009.