1 The Johns Hopkins Bloomberg School of Public Health Epidemiology Department. Division of Population Research, National Cancer Institute José Alencar Gomes
da Silva (INCA). E-mail: mszklo1@jhu.edu. Orcid ID: https://orcid.org/0000-0001-9433-6266
2Division of Population Research, INCA. E-mail: lalmeida@inca.gov.br. Orcid ID: https://orcid.org/0000-0002-6132-9358 Moysés Szklo1; Liz Maria de Almeida2
Screening as a Cancer Control Strategy
doi: https://doi.org/10.32635/2176-9745.RBC.2018v64n2.85
Rastreamento como Estratégia de Controle do Câncer
Cribado como Estrategia de Control del Cáncer
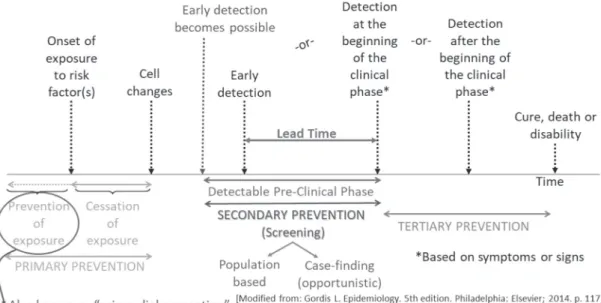
Figure 1. Cancer control is based on the natural history of the disease
INTRODUCTION
Cancer control has been defined by the United States National Cancer Institute as:
the conduct of basic and applied research in the behavioral, social, and population sciences to create or enhance interventions that, independently or in combination with biomedical approaches, reduce cancer risk, incidence, morbidity and mortality, and improve quality of life1.
In addition to primary prevention, screening (early detection) is an important strategy for cancer control. In this paper, we summarize the major general tenets of cancer screening, using prostate and colorectal cancer as examples of the application of these tenets.
In the natural history of cancer, early detection is a secondary prevention approach that takes place within
the detectable preclinical phase (DPCP) (Figure 1) and is based on either removal of precancerous lesions, (e.g., uterine cervix and colorectal), or early detection (cervix, colorectal, and breast).The DPCP, which begins with the earliest possible detection and ends when clinical disease is diagnosed based on signs or symptoms, also contains the so-called lead time. Lead time, the period that begins with actual early detection and ends with clinical disease, refers the degree to which early diagnosis can be anticipated. Thus, the maximum lead time is the DPCP. Both lead time and DPCP can be estimated2, serving as important
variables when the objective is to determine periodicity of screening.
Early detection can be population-based (screening) or opportunistic (case finding), the latter based on offering screening in the context of an individual medical encounter (“case-by-case” basis). As Rose has aptly demonstrated3, population-based prevention strategies
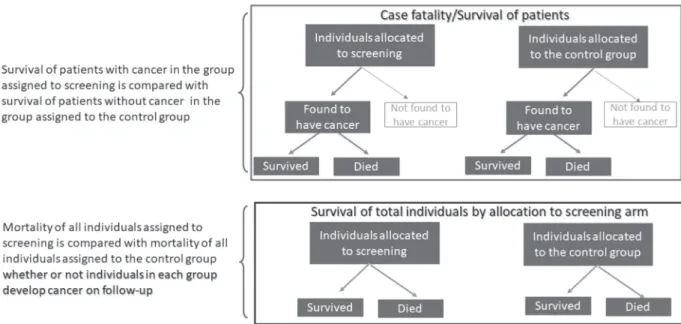
Figure 2. Two strategies for evaluation of screening effectiveness
approaches. Thus, screening is often more effective than case finding.
The key principles of cancer screening are that (1) the test should have reasonably high validity and be acceptable to the target population, (2) early detection and treatment lead to better outcomes than detection based on symptoms, (3) there is an adequately long DPCP, which allows identification of preclinical disease at regular intervals, (4) prevalence is high, and thus false positivity is minimized, (5) facilities for diagnostic confirmation and treatment should be readily available, (6) screening should be cost-effective vis-à-vis total health-related expenditures, and (7) without treatment, most cases in the preclinical phase progress to a clinical phase (a principle that may not be true for certain cancers, e.g., prostate and breast). It should be emphasized that, although highly sensitive and specific tests are a necessary condition for screening, as they allow detection of the disease in the DPCP, the ultimate utility of a screening program is the extent to which it decreases the risk of the disease outcome.
E
VALUATION OF SCREENINGEvaluation of screening is conducted by process studies and outcome studies. Process studies include, for example, the proportion of eligible persons in a given population that undergo screening procedures and the proportion of false positives. Outcome studies pertain to the effectiveness of the screening process. The main types are the comparison of case-fatality rates (or their complement, cumulative survival) between screened and non-screened patients with the disease of interest, and comparison of mortality
in all individuals (not only patients) according to whether they were assigned to the screened group or the control group (Figure 2). Due to the possibility of lead-time bias (see the next section), the latter type of study is ideal for assessing screening programs. Other outcomes in screening evaluation include recurrence rate, quality of life, and temporal trends in patients found to have early lesions.
B
IASES IN SCREENING EVALUATIONThe following biases may occur when evaluating the effectiveness of a screening program: selection bias, which includes referral/volunteer bias and length-biased sampling, lead-time bias, and overdiagnosis bias.
Referral/volunteer bias may occur when the selection of people to receive or not receive the screening procedures is not based on random allocation. Since individuals at higher risk of a given outcome may be more likely to self-select (e.g., women with a family history of breast cancer), volunteer bias may occur. This bias can be prevented by conducting a randomized trial.
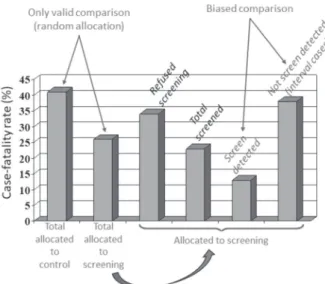
Length-biased sampling occurs when individuals identified by screening (in a periodic screening program) are compared to those whose diagnosis is made between screening exams (interval cases). Because interval cases usually present more rapid progression than cases diagnosed by screening, the latter appear to have better prognosis (Figure 3). Prevention of this bias is based on comparing mortality for all individuals allocated to the screening program, regardless of whether they are identified by the screening procedure(s), and the mortality in individuals in the control group.
Figure 3. Length-Biased Sampling. Each horizontal line represents
the detectable pre-clinical phase (DPCP) for a case
HIP Randomized Clinical Trial: Lead-Time- Adjusted Five-Year Case-Fatality Rates of Breast Cancer Patients
[Based on: Shapiro S, et al. Ten-fourteen year effect of screening on breast cancer mortality. JNCI. 1982;69:349-55.]
Table 1. Lead time bias: two patients with exactly the same survival from (biological) disease onset
Onset od cancer Early diagnosis Clinical
diagnosis* Death
Survival from diagnosis
Patient A January 2004 2005 January 2015 10 years
Patient B January 2004 Not screened 2008 January 2015 7 years
No gain when adding lead time to the survival of patient A: [Patient A survival - Lead time] = Patient B survival = 10-3 = 7 years
Onset od cancer Early diagnosis Clinical
diagnosis* Death
Survival from diagnosis
Patient A January 2004 2005 January 2020 15 years
Patient B January 2004 Not screened 2008 January 2015 7 years
Patient A survival is greater than that of Patient B survival because [Paciente A survival – lead time] > Paciente B survival = 15 – 3 = = 12 > 7 years
*based on symptoms and signs
[Based on: Gordis L. Epidemiology. 5th edition. Philadelphia: Elsevier; 2014. p. 119]
Lead-time bias occurs when survival (or case-fatality) is estimated in patients from the time of early diagnosis. Since individuals who undergo screening procedures are likely to be diagnosed earlier, the overall observed survival is influenced by lead time and thus, even if there is no difference in survival between screened and non-screened individuals, longer survival is observed in screened individuals, since it is counted from the date of early diagnosis (Table 1). Two solutions for preventing this bias are possible: (1) estimation of lead time for the disease under evaluation, which is then subtracted from the survival of the screened group (for example, if the lead time is 2 years and the survival is 8 years from early diagnosis, the actual survival for those who are screened is 6 years) and (2) use of mortality in all screened
and non-screened individuals as the main outcome to evaluate effectiveness of screening; because mortality is not calculated from the date of diagnosis and this type of evaluation is not based only on patients, lead-time bias is not a consideration, and thus this type of bias does not occur.
Finally, overdiagnosis bias may result from the inclusion of false positives in the evaluation of screening. Since false positives have better survival than individuals who actually have the disease, this bias tends to artifactually increase survival in individuals subjected to screening.
T
RANSLATING KNOWLEDGE ON SCREENING TO A SCREENING PROGRAM2The process of translating knowledge on screening to a screening program starts with a review (preferably systematic) of the literature or at least of one well-designed randomized trial, which leads to evaluation of levels of evidence and programmatic options with or without sensitivity analysis. Based on this evaluation, a cost-effectiveness analysis is carried out, resulting in recommendations for the implementation of evidence-based policies. There is usually tension between evidence and obstacles, which can be of an ethical, political, or resource-based nature.
L
EVELS OF EVIDENCEDecisions on implementation of a screening program (or any other program) should be based on levels of evidence. Exhibit 1 shows the main levels of evidence. For all levels, it is assumed that the intervention does more good than it does harm. The highest level is the result of a systematic review of the literature or a high-quality randomized trial. Well-designed observational studies (cohort and case-control) constitute the next level. The following level is the presence of dramatic results in
Exhibit 1. Translational and Implementation of policy, programs or interventions
[Based on: US Preventive Services Task Force. Available from: http://www.uspreventiveservicestaskforce.org/; American Cancer Society. Available from: http:// www.cancer.org/healthy/findcancerearly/cancerscreeningguidelines/american-cancer-society-guidelines-for-the-early-detection-of-cancer; Canadian Task Force on Preventive Health Care. Available from: https://canadiantaskforce.ca/guidelines/published-guidelines/]
uncontrolled experiments, such as reduction in cervical cancer mortality after the introduction of Pap testing. Finally, the lowest level is recommendation from experts – not based on systematic evidence -- who are convinced that the policy, program, or intervention is effective.
These levels are usually discussed by a task force, such as the United States Preventive Services (USPSTF) and the Canadian Periodic Health Examination task forces, which assigns grades to express their recommendations as to whether the program produces a net benefit, and if so, whether it should be implemented (Exhibit 1). More details on this process will be provided as follows in the real-life examples of prostate and colorectal cancers.
T
HE EXAMPLE OF PROSTATE CANCERExcluding non-melanoma skin cancer, prostate cancer is the most common type of cancer among men in countries of the Americas and parts of Europe, Africa, and Oceania4. The main risk factor associated with prostate
cancer is aging. Clinical examination and PSA test in combination may suggest the presence of the disease, but histopathological analysis of the prostate tissue is needed to confirm the diagnosis. In addition, Gleason histological grading complements the information needed to determine the best treatment for the patient. The extent of the disease at time of diagnosis is the main prognostic factor related to 5-year survival, which in the United States varies from 100% for local and regional stages to 29% for the distant stage5.
Prostate-specific antigen (PSA) has been used traditionally to diagnose early prostate cancer. There are different types of PSA tests, but for the purposes of this
example, we will use a value of PSA ≥4 ng/ml to indicate a positive test result. The sensitivity and specificity of positive PSA have been reported variously as 35-71% and 63-91%, respectively. As a result, the false-positive rate is relatively high, having varied from study to study from about 20% to almost 70%6,7. Transient causes of
false positivity include prostatitis, urethral endoscopy, and some medications (e.g., finasteride). Long-term false-positive tests result from benign prostatic hyperplasia. Notwithstanding the relatively high false-positive rate, a positive test usually leads to biopsy, which in addition to cost, results in complications such as severe pain in about one-fourth of patients, hematuria, and hematospermia in approximately one-half, and infection in 3-4%6,7. If
biopsy indicates presence of cancer, surgery, radiation therapy, or active surveillance is recommended. If surgery or radiation therapy is conducted, complications include urinary incontinence, urethral stricture, and sexual impotence. The latter is particularly common, occurring in about 10-18% of patients undergoing surgery and 3-8% of those who undergo radiation therapy. However, active surveillance is becoming more common and it is recommended for patients at very low or low risk. Exhibit 2 shows the classification of the prostate cancer risk profile suggested by the Johns Hopkins Department of Urology8.
E
FFECTIVENESS OF PROSTATE CANCER SCREENINGTwo of the best randomized trials on the effect of screening on prostate cancer mortality were conducted in the United States and Europe, respectively9,10. In the U.S.
trial, cumulative prostate cancer mortality after about 9 years was higher in the screening group than in the control
Exhibit 2. Active surveillance: criteria and recommendations from the Johns Hopkins, Department of Urology, based on prostate cancer
patient’s risk profile
[Available from: http://www.urology.jhu.edu/prostate/active_surveillance_selection.php.] *The cells are well differentiated and look like healthy cells
**Tumor found during needle biopsy, usually because of elevated PSA ***PSA number ÷ prostate volume
****Tumor involves ½ of 1 side of the prostate
Exhibit 3. American Cancer Society (“case-by-case”) PSA screening
age-specific guidelines
[American Cancer Society. Available from: http://www.cancer.org/healthy/ findcancerearly/cancerscreeningguidelines/american-cancer-society-guidelines-for-the-early-detection-of-cancer/]
group. After the same follow-up period, the European trial found no difference in prostate cancer mortality between the groups. Reflecting these trends, in 2012 the U.S. Preventive Services Task Force assigned grade D evidence (see Exhibit 1), reflecting a moderate/high certainty that no net benefit could be expected from screening and therefore that implementation of PSA testing should be discouraged. However, further follow-up of the European trial showed significantly lower mortality in the PSA group than in the control group11. This positive result prompted the American
Cancer Society (ACS)5 to assign grade C evidence in 2016,
according to which, the level of certainty is moderate or high and the expected benefit is small; consequently, its recommendation was for a “case-by-case” approach to PSA testing, that is, suggesting that implementation should be based on “case finding”. The “case-by-case” approach was specified by the ACS for different age groups (Exhibit 3). It is useful to quote here the recommendation from the ACS: The […] ACS recommends that men have a chance to make an informed decision with their health care provider about whether to be screened for prostate cancer. The decision should be made after getting information about the uncertainties, risks, and potential benefits of prostate cancer screening5 Although in the updated European study the prostate cancer mortality was significantly lower in the PSA group than in the control group, C grade evidence was assigned rather than A or B (Exhibit 1), because the authors could not find a difference in overall (all-cause) mortality between the groups.
In addition to the trials summarized in the previous paragraph, other clinical trials have been conducted to examine the effectiveness of a positive PSA test. In these trials, extensively and systematically reviewed by Fenton et al12, with the exception of one trial, prostate
cancer mortality was lower in the screened than in the non-screened group, with effectiveness varying widely from 4.0-42.0%. However, it should be noted that – as for the European trial – the relative risk for all-cause mortality was close to 1.0 in all trials; that is, no benefit was seen for overall mortality. Based on Fenton’s systematic review, the USPSTF recommended grade C for men aged 55-69 years and grade D for men 70 years and older. It can be hypothesized that, as for the ACS, the USPSTF decided to assign a grade C (rather than A or B) for men aged 55-69 years because in all the randomized trials to date, overall mortality was not decreased with PSA screening.
T
HE CONUNDRUM OF DEFINING FALSE POSITIVITY IN PROSTATE CANCERThere is a consensus that a relatively high proportion of patients with prostate cancer do not die from the disease. For example, in the USA-based Surveillance, Epidemiology, and End Results (SEER)13 Program, of
about 221,000 incident cases occurring in the United States every year from 1975 to 2011, there were only approximately 27,500 yearly deaths with prostate cancer as the underlying cause. This corresponds to an annual case-fatality rate of around 12.5%. Thus, prostate cancer is very likely not to be invasive in a large proportion of patients, which means that, using lethal cancers as true cases, an expanded definition of false positives would include not only those with a positive PSA and without the disease, but also those with the disease that does not become invasive. There are current efforts to identify biomarkers to allow prediction of prostate cancer invasiveness. In the meantime, as mentioned previously, active surveillance has been recommended for individuals at low and very low risk (Exhibit 2).
S
CREENING AND PRIMARY PREVENTION ARE BOTH IMPORTANT: THE EXAMPLE OF COLORECTAL CANCERColorectal cancer is the third most incident and lethal type of cancer, with 1,849,518 new cases and 880,792 deaths worldwide4. The most recent USPSTF
guidelines for colon cancer screening are from June 2016, recommending that screening for colorectal cancer should start at age 50 years and continue through age 75 years14.
The Task Force suggests a combination of 3 tests: fecal occult blood test (FOBT) or fecal immunological test (FIT) every 3 years, flexible sigmoidoscopy every 5 years, and colonoscopy every 10 years. This recommendation is based on strong evidence (Grade A) of effectiveness, however, and particularly for screening in developing countries, less invasive options should be found for colorectal cancer, since colonoscopy or even sigmoidoscopy may not be acceptable to most people and is an expensive procedure that requires well-trained professionals.
For adults aged 76-85 years, the recommendation is for a “case-by-case” approach and considers the individual’s overall health and prior screening history (evidence Grade C, denoting moderate or high level of certainty).
Even though colorectal screening is effective, particularly if novel, more acceptable, and highly sensitive and specific strategies are found, primary prevention cannot be neglected. As estimated by Platz et al15, if
everyone in the population had optimal levels of factors associated with colorectal cancer, 71% of colorectal cancers would be preventable. These optimal levels include body mass index (kg/m2) <25, ≥75 minutes/week of vigorous
exercise or ≥150 minutes/week of moderate plus vigorous exercise, not smoking, alcohol <15 g/day, red meat intake <2 servings/week, and >100 µg consumption of folic acid supplement/week.
CONCLUSION
Although primary prevention is the best strategy whenever possible, screening is also an important approach for cancer control. Assessing the effectiveness of cancer screening programs as well as the validity of new tools for early diagnosis of specific cancer types are important for health managers’ decision-making. Thus, guidelines must be reviewed periodically.
The examples of prostate and colorectal cancers show that the decisions to plan and implement population-wide cancer screening are not trivial and must be carried out taking into consideration the evidence resulting from well-designed studies. In addition, a careful assessment of risks and benefits involved in diagnostic and therapeutic procedures should be conducted.
REFERENCES
1. National Cancer Institute (US) [Internet]. Bethesda, MD: NCI; ©2018 [cited 2018 Out 12]. Cancer Control Definition; [about 2 screens]. Available from: https:// cancercontrol.cancer.gov/od/about.html.
2. Szklo M, Nieto FJ. Epidemiology: beyond the basics. 4th edition. Burlington: Jones & Bartlett Learning; 2019.
3. Rose G. The strategy of preventive medicine. New York: Oxford University Press; 1992.
4. Bray F, Ferlay J, Soerjomataram I, Siegel RL, Torre LA, Jemal A. Global cancer statistics 2018: GLOBOCAN estimates of incidence and mortality worldwide for 36 cancers in 185 countries. CA Cancer J Clin. 2018 Nov;68(6):394-424.
5. American Cancer Society. Cancer Facts & figures 2017 [Internet] Atlanta (GA): American Cancer Society; 2017 [cited 2018 Out 9]. Available from: https:// www.cancer.org/content/dam/cancer-org/research/ cancer-facts-and-statistics/annual-cancer-facts-and-figures/2017/cancer-facts-and-figures-2017.pdf. 6. Crawford ED, Leewansangtong S, Goktas S, Holthaus
K, Baier M. Efficiency of prostate-specific antigen and digital rectal examination in screening, using 4.0 ng/ml and age-specific reference range as a cutoff for abnormal values. Prostate 1999;38(4):296-302.
7. Gann PH, Hennekens CH, Stampfer MJ. A prospective evaluation of plasma prostate-specific antigen for detection of prostatic cancer. JAMA 1995;273(4):289-94.
8. Johns Hopkins School of Medicine [Internet]. Baltimore: The Brady Urological Institute Urology Department; ©2018 [cited 2018 Out 12]. Prostate Cancer Management: active surveillance. Available from: http://www.urology.jhu.edu/prostate/active_ surveillance_selection.php.
9. Schröder FH, Hugosson J, Roobol MJ, Tammela TL, Ciatto S, Nelen V, et al. Screening and prostate-cancer mortality in a randomized European study. New Eng J Med 2009;360(13):1320-128.
10. Andriole GL, Crawford ED, Grubb RL, Buys SS, Chia D, Church TR, et al. Mortality results from a randomized prostate-cancer screening trial. New Eng J Med 2009;360(13):1310-19.
11. Schroder FH, Hugosson J, Roobol MJ, Tammela TL, Zappa M, Nelen V, et al. Screening and prostate cancer mortality: results of the European Randomised Study of Screening for Prostate Cancer (ERSPC) at 13 years of follow-up. Lancet 2014;384(9959):2027-35. 12. Fenton JJ, Weyrich MS, Durbin S, Liu Y, Bang
H, Melnikow J, et al. Prostate-Specific Antigen-Based Screening for Prostate Cancer: Evidence Report and Systematic Review for the US Preventive Services Task Force. JAMA 2018;319(18):1914-31.
13. National Cancer Institute [Internet] Rockville: The Surveillance, Epidemiology, and End Results (SEER); ©2018 [cited 2018 Out 12]. Available from: https:// seer.cancer.gov/.
14. US Preventive Services Task Force, Bibbins-Domingo K, Grossman DC, Curry SJ, Davidson KW, Epling JW Jr, et al. Screening for Colorectal Cancer: US Preventive Services Task Force recommendation statement. JAMA. 2016 Jun 21;315(23):2564-2575.
15. Platz EA, Willett WC, Colditz GA, Rimm EB, Spiegelman D, Giovannucci E Proportion of colon cancer risk that might be preventable in a cohort of middle-aged US men. Cancer Causes and Control 2000;11(7):579-588.
Recebido em 27/11/2018 Aprovado em 28/11/2018