need for green space to create a social, physical and spiritual balance in individuals is rising dramatically. The present research analyzes the performance of urban management in Behbahan city with an emphasis on green space. From the viewpoint of purpose, this research is applied and in terms of the research method is descriptive-analytical and the required data and information has been collected through documentary and library studies and field studies. The statistical population of this research is the total population of Behbahan city, and the sample size is estimated to be 393 by Cochran formula. SPSS software and its tests, including Kolmogorov-Smirnov test, binomial test, and distribution coefficient were used to analyze the data. The results of the quantitative and qualitative section of the green area indicate that in Behbahan, green space per capita is 9.08 m2, which is higher than the minimum acceptable national standards, which is 7 m2 and compare to the minimum acceptable international standards, ie 20 m2, is less about 10.92 m2. Overall, the growth of green space has been roughly proportional to population growth but citizens are not content with the qualitative and fair distribution of green space as well as the performance of urban management. Keywords: Park. Green space. Urban management. Behbahan.
Resumo: Hoje, o desenvolvimento e a expansão dos espaços verdes, devido à crescente expansão da população, à construção urbana e à necessidade humana de espaço verde para criar um equilíbrio social, físico e espiritual nos indivíduos, está aumentando dramaticamente. A presente pesquisa analisa o desempenho da gestão urbana na cidade de Behbahan com ênfase no espaço verde. Do ponto de vista de propósito, esta pesquisa é aplicada e em termos do método de pesquisa é descritivo-analítico e os dados e informações necessários foram coletados por meio de estudos documentários e bibliotecários e estudos de campo. A população estatística desta pesquisa é a população total da cidade de Behbahan, e o tamanho da amostra é estimado em 393 pela fórmula de Cochran. O software SPSS e seus testes, incluindo o teste de Kolmogorov-Smirnov, o teste binomial e o coeficiente de distribuição foram utilizados para analisar os dados. Os resultados da secção quantitativa e qualitativa da área verde indicam que, em Behbahan, o espaço verde per capita é de 9,08 m2, que é superior aos padrões nacionais mínimos aceitáveis, que é de 7 m2 e comparado com os padrões internacionais mínimos aceitáveis, ou seja 20 m2, é menos de 10,92 m2. No geral, o crescimento do espaço verde tem sido aproximadamente proporcional ao crescimento populacional, mas os cidadãos não se contentam com a distribuição qualitativa e justa do espaço verde, bem como com o desempenho da gestão urbana.
Palavras-chave: Parque. Espaço verde. Gestão urbana. Behbahan.
MA Geography and Urban Planning, Faculty of Social and Humanities Sciences, Mazandaran University, Iran. E-mail: ghmalek@umz.ac.ir
Assistant Professor of Geography and Urban Planning, Faculty of Social and Humanities Sciences, Mazandaran University, Iran. E-mail: annamoradnejad@yahoo.com
Associate Professor of Geography and Urban Planning, Faculty of Social and Humanities Sciences, Mazandaran University, Iran. E-mail: abdollahkarimzadeh@yahoo.com
Abdolmottaleb Karimzadeh Glolamreza Malekshahi Rahim Bardi Anamoradnezhad
NVESTIGAÇÃO EXPERIMENTAL
DA GESTÃO URBANA NO
DESENVOLVIMENTO DE ESPAÇOS
VERDES E PARQUES URBANOS
(ESTUDO DE CASO DA CIDADE DE
BEHBAHAN)
EXPERIMENTAL INVESTIGATION
OF URBAN MANAGEMENT IN THE
DEVELOPMENT OF GREEN SPACE
AND URBAN PARKS (CASE STUDY
OF BEHBAHAN CITY)
1
2
3
1
2
3
Introduction
With population growth and the expansion of urbanization, humans have gradually disappeared from nature and excessive population density and interference in the natural environment and the creation of human environments have increased the environmental, physical and mental needs of humans. In order to meet these needs, urban man has made gardens and artificial green spaces inside the cities (Saeedniya, 2004:26).
What is today’s crisis at the beginning of the 21st century is a crisis for our cities, and it’s a tired and frustrated city and its inhabitants, as well as its inhabitants, and the destruction of humanity and nature that unfortunately, in recent years, we have been paying less attention to this issue in urban development and urbanization (Zangiabadi and Mokhtari, 2005:12).
In the industrial world today, advances in various fields of industry and technology have become one of the most important concerns of developed and developing countries and even the Third World. With the increase in population, the development and expan-sion of urbanization, humans gradually evolved from nature and overgrown population and interference in the natural environment and the creation of human-made environ-ments, have shown more human physical and mental environmental needs that in order to meet these needs, urbanization has begun to create a green space. Increasing urban population growth and limiting the access of urban residents to green spaces, along with increasing their importance in leisure time, the development and arrangement of these spaces has given a special place in contemporary urbanization, but overcoming the econo-mic insight on the urbanization process has prevented attention from this, in a such way that currently, most urban settlements lack the proper green space (Zangiabadi, Rakhsha-ninasab, 2009:106).
Recognizing that green space is considered as a respiratory lung of the city, and the absence of it means that there is no physical and mental health in the cities, along with development, the importance of green space becomes more tangible. Today, at different levels of the geographical level from the city level to the global level, the importance is given to environmental issues and green space; to the extent that urban green space, apart from its various ecological and social effects, is considered to reduce problems such as poverty and unemployment (Hataminezhad, Emranzadeh, 2010:74).
The significance of this application has increased much since the rapid and unpre-cedented expansion of the city after the industrial revolution. In the twentieth century, with the globalization of functional urbanism, the park was considered by the urban planners as a public-service space and, like other urban services, was subdivided accor-ding to the city’s physical division into neighborhoods and local, and regional and urban parks (Behbahani, 1994:32). Now in the twenty-first century, it became clear that the park should be a democratic place to recognize and respond to the needs and desires of diffe-rent urban cultures (Thompson, 2002). Attention to urban green spaces in Iran began sin-ce in the 1930s by the construction of the National Garden in Tehran and then turned into a park of the city and thus, the expansion of cities in recent decades necessitated planning for the construction of these spaces (Mohammadi et al., 2007:96).
Behbahan city faces problems due to uneven distribution of green space users that this problem in addition to disregarding the principle of equity in equally enjoying citizens from the appropriate urban green spaces, has encountered problems with the comfort, efficiency, health, and safety of citizens, which is the goal of urban planners. In this con-text, one can point out the beauty and quality of urban green spaces, which are more homogeneous and without special creativity and attraction, lack of work in climate studies in green space and the introduction of suitable plant species to indigenous conditions for use in urban green space, the lack of appropriate facilities and equipment for different age and gender groups in these places are the factors that reduce citizens’ willingness to use parks and urban green spaces. It can also be noted that the distribution of green spaces and parks in the city that do not have regular standards and citizens face a lot of problems in this area.
Investigating and analyzing the performance of urban management in the field of green space usage in Behbahan city was the main motivation for this research, and to provide the appropriate solutions along with the main goal of urban green planning which is to provide people with the prosperity by creating a better, healthier, more effective and more pleasant environment.
Previous studies related to research
La Rosa (2014) presented a set of accessibility indicators aimed at quantifying dif-ferent measures of accessibility to existing open spaces for the city of Catania, southern Italy, an urban context characterized by a general lack of green spaces and high density of urban settlements. Results show different scenarios in terms of the rank of greenspaces accessibility, strongly influenced by the chosen distance metric (Euclidean vs network) and thus emphasize a careful use of these indicators as planning support tools. Some practical implications of measuring accessibility for urban planning can be highlighted: for instan-ce, specific land uses might be chosen for highly accessible open spaces, especially those characterized by high proximity to residential settlements. Examples include allotment gardens, playgrounds, and other informal green areas.
Senanayake et al. (2013) analyzed the environmental quality in Colombo city based on green spaces and to provide appropriate recommendations to raise the environmental quality to international standards.
In this study, green space areas were extracted from Thailand Earth Observation Sys-tem (THEOS) satellite imagery using the Normalized Difference Vegetation Index (NDVI). The study revealed that 24% of the entire Colombo Municipal Council (CMC) area consists of green spaces. This study also revealed that 34 GN divisions out of 55 lack the minimum per capita green space recommended by the World Health Organization for healthy living. Recommendations are presented regarding regions where new green spaces should be established to enhance the environmental standard of living up to international standards.
Rabare et al. (2009) assessed the utilization, investigate the benefits and analyze the factors influencing the use of urban parks in Kisumu. The study indicates that the poor maintenance and lack of adequate facilities had hindered optimal social, economic, envi-ronmental and educational benefits of the parks.
Varsi et al. (2015) in a research entitled Spatial Analysis and Optimization of Urban Green Spaces (Case Study: Najaf Abad City) showed that weaknesses in the proportional and fair distribution of green spaces in the city of Najafabad, as well as inappropriateness per capita, are announced by the standards that in fact, according to the findings, the cen-tral part, part of the south and west of the city lacked the park and green space, outside of the functional range of the surrounding parks.
Nahibi, Sadat Hasandokht (2014) in research entitled Investigating the Effect of Ur-ban Green Space on Improving UrUr-ban Quality of Life Case Study: Shiyan District showed that citizens of the Shiyan neighborhood view green equipment as an integral part of their lives, promote quality of life, and become a green and vibrant neighborhood.
Lotfi et al. (2014) in research entitled Investigation of distribution, standards and per capita calculation of urban green space based on Bahram Soltani’s Model, Case Study: District Q of Qom showed that the amount of green space in the area is 8337293 m2. This
figure indicates the unfavorable condition of the green space and its poor distribution, especially in the northeastern parts of the region, which is almost empty of green space, according to the images on the map.
Research Methodology
The present research analyzes the performance of urban management in Behbahan city with an emphasis on green space. From the viewpoint of purpose, this research is applied and in terms of the research method is descriptive-analytical and the required
data and information has been collected through documentary and library studies and field studies. The statistical population of this research is the total population of Behbahan city, according to the population of 122604 people in Behbahan city, the sample size is estimated to be 393 by Cochran formula. Questionnaires with Likert scale, whose validity was calculated through Cronbach’s alpha coefficient, were distributed field-wise in these parks on holidays and non-festive days and in the morning and afternoon in different age and gender structures, using the method of conditional sampling among the visitors of the parks. SPSS software and its tests, including Kolmogorov-Smirnov test, binomial test, and distribution coefficient were used to analyze the data.
Research hypotheses:
• Along with urbanization in the city of Behbahan, urban green spaces also incre-ased.
• Per capita, green space in Behbahan does not meet acceptable standards. • The people of Behbahan city have a low satisfaction on management
perfor-mance in terms of quality and quantity of urban green space.
• The people of Behbahan city are not satisfied with the quantity of urban green space in terms of quality and quantity
Studied Field (Behbahan City)
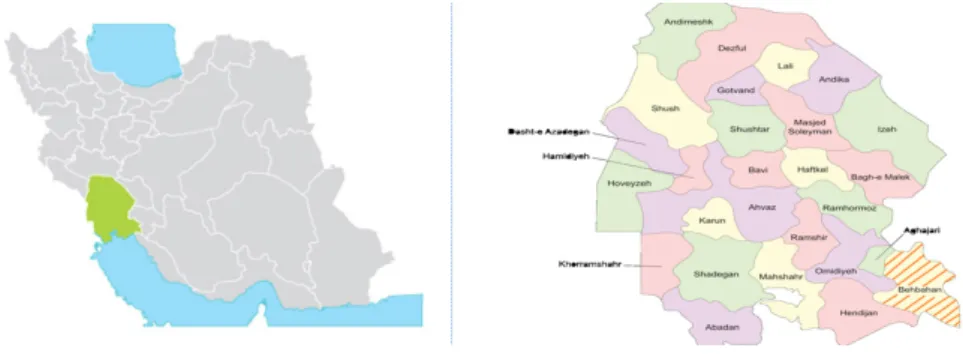
Behbahan city is located in the southeast of Khuzestan, north, and northeast, in the Kohgiluyeh and Dehdasht mountains, from the east and south-east is restricted to Gachsa-ran and from the south to the Deylam port in Bushehr province and from the northwest to Ramhormoz. Omidieh city and Mahshahr port city are located in the west and southwest of the city.
Its longitude is 50 degrees and 14 minutes east longitude and 30 degrees and 36 minutes northern latitude and 325 meters above sea level. The distance from Behbahan to the center of the province is 200 kilometers.
Map 1: Political Situation of Behbahan in Khuzestan and Iran
Table 1: Trend of population growth and absolute growth rate of Behbahan during
the period of 1966-95 1966 1976 1986 1996 2006 2016 year 39937 49486 79169 89169 102861 122604 Population (people) 2.2 4.8 1.2 1.4 1.3 Growth rate (percent)
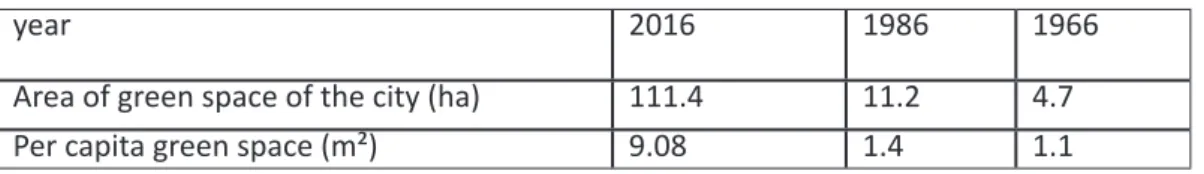
Table2: Green spaces of Behbahan city during the period of 1966-95 1966 1986 2016 year 4.7 11.2 111.4 Area of green space of the city (ha)
1.1 1.4
9.08 Per capita green space (m²)
Source: Behbahan City Development Project 2009, Behbahan Municipality.
According to the research, the identity of the park in Behbahan is more human constructed more than forest. Regarding the classification of parks, according to the im-portance, scale and sphere of influence, we can say that the parks of Behbahan city are more urban parks than national parks and international parks.
Urban parks on the basis of scale and area of influence are divided into neighboring parks, local parks, regional parks, and urban parks. Based on this, the Behbahan city has urban parks with 40 urban parks located in area 1, There are 11 neighboring parks, 9 local parks, and 1 parks district and in district two, 8 neighboring parks, 10 local parks and 1 regional park which can be said most of the parks Behbahan are neighboring and local type. The performance of the parks in the Behbahan city has often been built to meet the people’s recreational needs. The main goal of the visitors is to have fun at the parks.
At present, the area of green space in Behbahan city is 1114182 m2. According to
the population of 122604 people, the per capita green space of Behbahan is 9.08 m2,
which is a comparison to the international standard green space of 20 to 25 m2
(Manage-ment and Planning Organization of the country, 2001) shows a low level.
Table 3: Separated statistics and total green spaces of Behbahan municipality in
1395 R e -gional Park District Park L o c a l park N e i -ghborhood Park B o u l e -vard G r e e n band Squares Triangles Scattered g r e e n space Ar number ea number Ar ea number Ar ea number Ar ea number Ar ea number Ar ea number Ar ea number Ar ea number Ar ea 1 150000 1 65162 19 350752 19 41064 57 217477 6 173047 36 34264 34 40998 26 41419
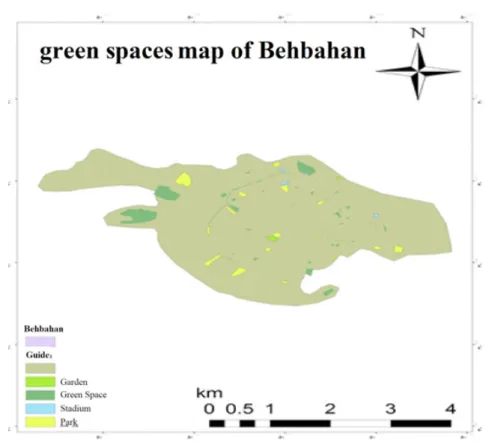
Map 2: Green spaces map of Behbahan
Results
Demographic studies of research respondents
The tables below show the frequency of gender, age, education, occupation, and the reason for coming to the park in the statistical sample.
Table 4: Frequency of the gender variable
Frequency Frequency percentage Gender 166 57.3 Women 223 42.7 Men 389 100 total
Table 5: Frequency of age variable
Frequency Frequency percentage Age 112 28.8 18-24 149 38.3 25-35 93 23.9 36-45 29 7.5 46-55 5 1.3 56-65 1 0.3 66 upward
389 100
total
Table 6: Frequency of education variable
Frequency Frequency percentage
Degrees
23 8.5
Under the diploma
171 44 Diploma 164 52.2 Bachelor 20 5.1 Masters 1 0.3 Ph.D 389 100 total
Table 7: Frequency of job variable
Frequency Frequency percentage Job title 155 39.8 Unemployed 59 15.2 Employee 12 3.1 Retired 106 27.2 self-employment 87 14.7 Other 389 100 total
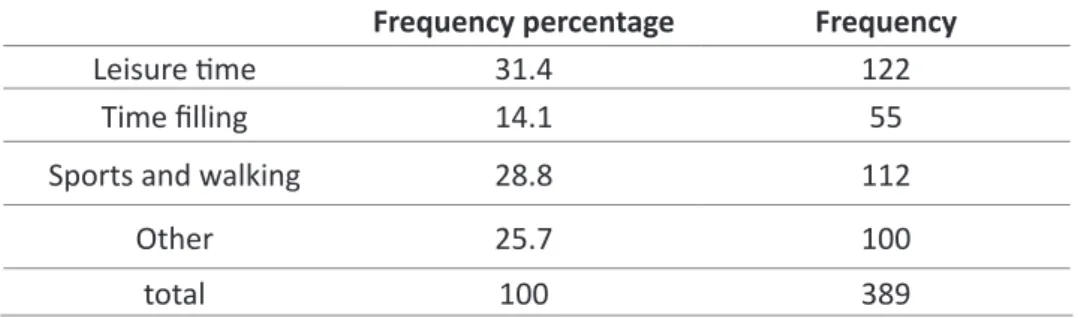
Table 8: Frequency of reason for coming to the park variable Frequency Frequency percentage 122 31.4 Leisure time 55 14.1 Time filling 112 28.8
Sports and walking
100 25.7 Other 389 100 total
Table 9: Descriptive statistics of research variables
Mean Std. Min. Max. Variables 2.88 0.95 1.000 5.000
Health and environment
2.48 0.81 1.000 5.000 access 2.62 0.76 1.000 5.000
Equipment and safety
2.33 1.08
1.000 5.000
Social and cultural
As shown in Table (9), the mean of all variables and dimensions is less than the average level and in terms of subjects, the variables of health and the environment factors with the highest mean and variables of socio-cultural factors have the lowest mean.
Inferential analysis of data
- Examination of the normal distribution of the sample
In order to evaluate the research hypotheses, first, in Table (10), the normal distri-bution of the sample was investigated by Kolmogorov-Smirnov test and then the parame-tric statistic or nonparameparame-tric statistics were used according to the test result.
Table 10: Kolmogorov-Smirnov test
p-value Result
Variables
0.000 abnormal
Health and environment
0.000 abnormal
access
0.006 abnormal
Equipment and safety
0.007 abnormal
Social and cultural
Research hypotheses evaluation
1-Along with urbanization in the city of Behbahan, urban green spaces also incre-ased.
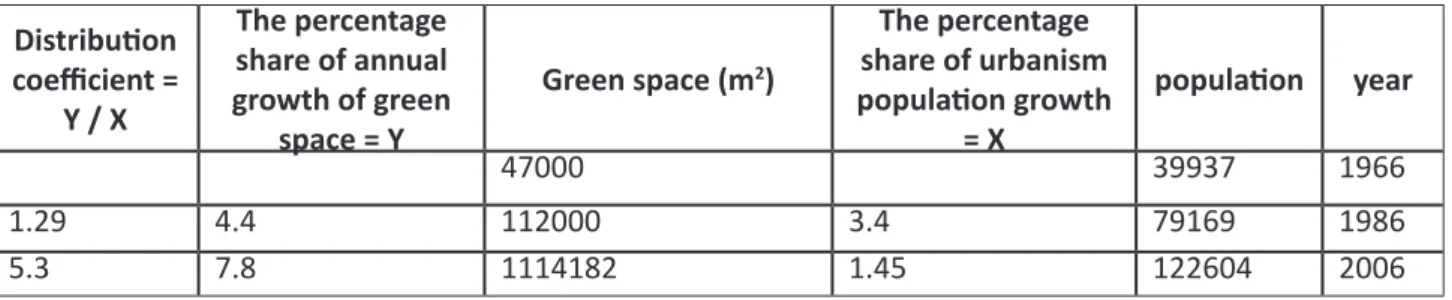
In order to examine this hypothesis, the distribution coefficient (DQ) method, which shows the proportion of the share of green space development percentage to the percen-tage of urbanism growth, is used.
Table 11: Calculation of green space distribution coefficient
year population The percentage share of urbanism population growth = X Green space (m2) The percentage share of annual growth of green space = Y Distribution coefficient = Y / X 1966 39937 47000 1986 79169 3.4 112000 4.4 1.29 2006 122604 1.45 1114182 7.8 5.3
Based on the results of the above table, the distribution coefficient in the studied periods is more than one, which means that the growth of green space is proportional to population growth in Behbahan city and indicates a higher rate than acceptable level. Therefore, this assumption is confirmed.
Per capita green space in Behbahan does not meet acceptable
standards.
The proposed per capita of parks and green spaces of the cities in the international standard is 20 to 25 m2 in the United Nations Environment Organization and in Iran
accor-ding to the Ministry of Housing and Urban Development between is 7 and 12 m2
(Saeed-niya, 1379:83). The area of green space in Behbahan city is 1114182 m2 according to the
latest information from the population and available green spaces that this figure is 10.29 m2 less than the international standards but it has an acceptable level of standards. Based
on the evidence presented above, the hypothesis that per capita green space in the city of Behbahan does not conform to the standards is verified internationally but is rejected at the national level.
management performance in terms of quality and quantity of urban
green space.
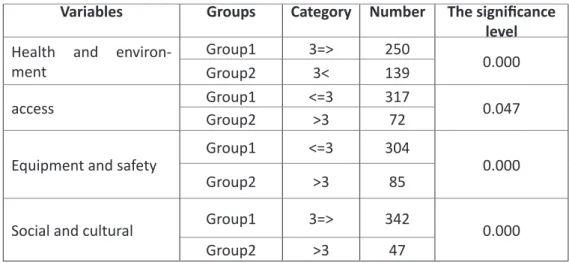
To investigate this hypothesis, the non-parametric binomial test was used to evalua-te the satisfaction of people from the performance of urban management in order to manage urban green space. It should be noted that in the table, Group 1, there are people who, in their opinion, chose medium, weak and very weak choices in answering questions, and Group 2, those who have a good opinion and much Well, the number 3 was ranked as average:
Table 12: Binomial test result to determine satisfaction
The significance level Number Category Groups Variables 0.000 250 3=> Group1
Health and
environ-ment Group2 3< 139 0.047 317 <=3 Group1 access Group2 >3 72 0.000 304 <=3 Group1
Equipment and safety
85 >3 Group2 0.000 342 3=> Group1
Social and cultural
47 >3
Group2
Based on the results of Table (12), as it is known, group 1 shows the majority of respondents and the significance level of the binomial test of all variables is less than 0.05. Based on the results of the above table, group 1 shows the majority of respondents and the significance level of the binomial test of all variables is less than 0.05 so this hypothe-sis is confirmed. As the results of this hypothehypothe-sis and previous assumptions indicate, the amount of green space in the city of Behbahan is in good condition than the domestic standards. Therefore, it seems that the reason for people’s dissatisfaction with the per-formance of urban green space management is its perper-formance regarding the handling of facilities at the park level. This poor performance has been visible in areas such as the qua-lity of green space, children’s and sports equipment, lighting, security, water, sanitation, cleaning, as well as the inadequacy of parks facilities according to the needs of different classes at different ages.
The people of Behbahan city are not satisfied with the quantity of
urban green space in terms of quality and quantity
Table 13: Binomial test result to determine the satisfaction of green spaces The significance level Number Category Groups Variables 0.000 299 <=3 Group1 Satisfaction level
of green spaces Group2 3< 90
Based on the results of Table 13, group 1 shows the majority of respondents and the significance level of the binomial test of all variables is less than 0.05. The results show that people, from the viewpoint of the amount of urban green space, are not satisfied in
quantitative and qualitative terms, so this hypothesis is confirmed.
Conclusion
Considering the importance of green space and its impact on improving the quality of urban spaces, improving the environmental aspects and urban life, and increasing the health and urban health, study of urban green spaces with a revision of methods, stan-dards and per capita in recent years has been of interest to urban planners, geographers and environmental experts.
In this research growth of green space with population growth in Behbahan city was investigated using distribution coefficient technique in periods (1965-1384), re-sults showed that growth of green space has been proportional to population growth in Behbahan. Referring to data collected from the municipality, green space per capita is 9.08 m2, which is higher than the minimum acceptable national standards, which is 7 m2
and compare to the minimum acceptable international standards, ie 20 m2, is less about
10.92 m2.
Also, the results of the questionnaire in health and environment, accessibility, equi-pment and safety, social and cultural aspects were analyzed using non-parametric bino-mial test in order to evaluate the satisfaction of people from the performance of urban management in the management of urban green space, it shows that the significance level of the binomial test of all variables is less than 0.05, which indicates that citizens are not satisfied with the performance of city managers in these sectors.
The results of this study showed that although the growth rate of green space in Behbahan city is in good shape relative to population growth but the lack of attention to these spaces and the needs of citizens for proper access has made people unable to properly use these parts and result in their dissatisfaction. Therefore, the inappropriate performance of urban management in urban green space section in this study could be the main reason for citizens’ dissatisfaction.
Suggestions
Looking at the motivational factors for using parks among different age and gender groups, it is important to note that managers and administrators of designing parks and green spaces to provide satisfaction to these groups should provide appropriate facilities for using them from parks. Considering the needs of children, the elderly and women is one of the factors that are usually less attention paid to designing parks in our country. In this study, it became clear that one of the most important problems for women to use parks in addition to security issues it is not a suitable environment for relaxation, rest and even exercise. Therefore, considering the location of women’s parks or at least the allo-cation of parts of the existing parks, this seems to be the case. Because in this research it became clear that women’s use of parks is more limited to family visits.
Considering today’s issues, being busy citizens and entertaining children and ado-lescents in cyberspace, urban green space planners with a significant and significant bud-get need to be more and more thinking about creativity in the park environment and improving the quality of the facilities of the parks. , Pay attention to the standards of parks and public green spaces, so they could combine the energetic and future of the city with the outdoors, cyberspace and gameplay, and reconciles them from aggression, seclusion, isolation and individualism around the surrounding social environment and brings it clos-er to the real world. In this regard, attention to the design of the parking space from the point of view of environmental psychology and aesthetics is emphasized on the proper combination of colors and desired graphics.
Regarding the role of parks in creating employment, it is suggested that investment areas be identified around parks and parks (in particular, regional parks) (maroon beach, coastal citizen), which will affect the impact It has a lot to create more employment and revenue for citizens and municipalities.
It is suggested that in future researches, the extent and manner of people’s access to the green spaces of Behbahan, as well as the distribution and distribution of green space in the city.
Referenes
Ghorbani, R. &Teymoori, R. (2009). An Analysis of Urban Parks Using Urban-Quality
Pat-terns in Urban Quality Improvement Case Study: Parks in Tabriz City. Human Geography
Research, No. 72, pp. 62-47.
Ghorbani, R.&Beheshtiroy, M. (2010). An Analysis of the Urban Urban Parks Typology of
the East Azarbaijan Province Using the Granisian Analysis Model, Urban and Regional Studies and Research, Second Year, No. 8.
HatamiNezhad, H. &Emranzadeh, B. (2010). Review, evaluation and proposal per capita
urban green space (Case Study: Mashhad Metropolis) Journal of the Iranian Association
of Geography, Vol. 8, No. 25.
La Rosa, D. (2014). Accessibility to greenspaces: GIS based indicators for sustainable plan-ning in a dense urban context. Ecological Indicators, 42, 122-134.
Management and Planning Organization of Iran. Scientific and Technical Issues. (2001).
Space Design Criteria.
Mohammadi, A. &Eskandari, A. (2006). The need to pay attention to the per capita of
green space and its relation with the increase of urban population. Quarterly Journal,
Number Sixteen, New Period. Summer 2006.
Nahibi, S. &Sadaathasandokht, M. (2004). Investigating the Effect of Urban Green Space
on Improving Urban Quality of Life Case Study: Shiyan District). Sustainability,
Develop-ment and EnvironDevelop-ment, Volume 1, Issue 1.
Parks & Green Space Organization of Tehran, “The Importance of Green Space and Its
Impact on Human Psychology”. (2009). pp. 2-3.
Rabare, R. S., Okech, R., & Onyango, G. M. (2009). The role of urban parks and
socio-eco-nomic development: case study of Kisumu Kenya. Theoretical and Empirical Researches in
Urban Management, 4 (3 (12), 22-36.
Saeedniya, A. (2000). Urban Management, 11th volume, Tehran, Municipality
Organiza-tion.
Saeedniya, A. (2004). Urban Management, Municipal Green Book, Vol. 11, Publications of the Municipal Organization of Iran.
Senanayake, I. P., Welivitiya, W. D. D. P., & Nadeeka, P. M. (2013). Urban green spaces
anal-ysis for development planning in Colombo, Sri Lanka, utilizing THEOS satellite imagery–A
remote sensing and GIS approach. Urban forestry & urban greening, 12(3), 307-314.
Recebido em 28 de abril de 2019. Aceito em 23 de agosto de 2019.