iii
Acknowledgements
I would like to thank all the help provided by my supervisor Professor Dr. Gilberto Loureiro, for all the positive input and guidance trough out all my work. Also, for all his time, even with is busy schedule always made time to receive me or to respond me.
I would also like to praise my family: my father Rui Santos, my mother Dalila Santos, my brother Ricardo Santos and my girlfriend Orlanda Baptista. For their love support and financial support in these difficult two years away from home.
A special thanks to a group of special friends, that embarked in this adventure together with me, to come and study at University of Minho. Special thanks to Hugo Gouveia, Tomás Sardinha and Luis Costa, whish all the best for their future.
Last, but not least important, I would like to thank my better half for all the support, guidance, stability, emotional support and for the patience of a Saint. Thank you Orlanda, for loving me and putting up with me through the hard parts and specially being part of my life. If not for you I would not have ever dreamed of reaching so far.
iv
Executive Compensation and Firm Value
Abstract
Executive Compensation can be a solution to some of the conflicting problems that firms face regarding good Corporate Governance. Financial literature attributes, the function of mitigating the conflict of interests between executive managers and shareholders to the compensations packages. However, does the long-term incentive compensation have any positive impact on firm value? In the financial literature, there seems to be a lack of consensus on whether executive equity-based compensation really has a positive impact on firm value. Some view compensation as a way to push the managers to increase the firm value and others see it as a way for the manager to extract rent from the firm. Therefore, my dissertation examines whether including incentives alignment mechanisms, in the executive compensation affect the firm value. Using two samples the first of 1140 US firms from 2002 to 2017 and the second of 186 firms from S&P500 from 2014 to 2017, following the main approach in literature, I test the hypothesis of a positive relation between the level of long-term executive compensation, CEO equity-based compensation and firm value. A vast part of the literature seems to agree that there is a positive relationship between awarding incentive-aligned compensation to executives and firm value. My results show evidence that awarding executive managers is consistent with this hypothesis. The results are robust for the use of a combination of fixed effects, even after addressing endogeneity concerns. However, with awarding CEO equity-based compensation the results show a possible positive relationship, but due to the results not being robust, a concrete conclusion is not possible.
Keywords: Executive Compensation, Firm Value, Corporate Governance, Agency
v
Executive Compensation and Firm Value
Resumo
Compensações para os executivos pode ser uma solução para alguns dos conflitos que as empresas enfrentam quando enfrentam uma boa governança. A literatura financeira atribui a função de mitigar o conflito de interesses entre gestores executivos e acionistas a atribuição de pacotes de compensação. Porém, será que atribuir incentivos de longo prazo reflete-se num impacto positivo no valor das empresas? Parece haver uma falta de consenso na literatura financeira se ao atribuir incentivos aos executivos reflete-se num impacto positivo no valor das empresas. Há quem veja os incentivos como uma maneira dos gestores aumentarem o valor das empresas e outros como uma maneira dos gestores extraírem rendas da empresa. Assim sendo, a minha dissertação examina se incluindo mecanismos de alinhamento por incentivos na renumeração dos gestores, afeta o valor da empresa. Usando duas amostras: a primeira, de 1140 empresas americanas de 2002 a 2017 e a segunda, de 186 empresas tiradas do índice S&P500 de 2014 a 2017. Seguindo a abordagem principal da literatura, eu testo a hipótese de haver uma relação positiva entre o nível de incentivos a gestores executivos no longo prazo, incentivos ao CEO em capital próprio e o valor da empresa. Os meus resultados mostram evidência de que premiar gestores executivos é consistente com esta hipótese. Embora, os resultados sugiram que também há uma relação positiva entre estabelecer incentivos ao CEO e o valor da empresa, os resultados não são robustos logo não é possível estabelecer uma concreta relação.
Palavras-Chave: Compensação Executiva, Valor da Empresa, Governança Corporativa, Teoria da Agência, Manipulação de Resultados.
vi
Table of Contents
Acknowledgements ... iii
Executive Compensation and Firm Value ... iv
Abstract ... iv
Executive Compensation and Firm Value ... v
Resumo ... v
Table of Contents ... vi
List of Tables ... vii
1 Introduction... 1
2 Literature Review ... 2
2.1 Agency Theory ... 3
2.2 The dangers of excessive equity-based compensation ... 5
2.3 Compensation Packages ... 6
2.4 Previous studies on the relation between compensation and the firm ... 8
2.5 Main hypothesis of the study ... 11
3 Methodology ... 11
3.1 Ordinary Leas Squares (OLS) Regressions ... 11
3.2 OLS with fixed effects ... 12
3.3 Addressing endogeneity: Two-Stage Least Squares (2SLS) ... 13
4 Data ... 14
4.1 Descriptive Statistics ... 15
5 Results ... 17
5.1 Results – Long-term Objectives ... 17
5.1.1 OLS Regression ... 17
5.1.2 OLS Regression with Fixed Effects ... 18
5.1.3 Two-Stage Least Squares ... 20
5.2 Results – CEO Equity-based Compensation ... 23
5.2.1 OLS Regression and Fixed effects ... 23
5.2.2 Two-Stage Least Squares ... 25
6 Conclusion ... 26
vii
List of Tables
Table 1 – Summary Statistics ... 16 Table 2 - Summary Statistics... 16 Table 3 – Preliminary Results on the relation of Long Term Compensation and Firm Value ... 18 Table 4 – Results on the relation of Long Term Compensation and Firm Value
considering fixed effects. ... 20 Table 5 – Results on the relation of Long Term Compensation and Firm Value
considering the Endogeneity. ... 22 Table 6 - Results on the relation of CEO Compensation and Firm Value ... 24
1
1
Introduction
Over the last few decades, corporate governance has been subject to many studies and they tend to focus on explaining corporate governance and its consequences. Corporate Governance is a set of rules, directives or practices, aimed at improving the quality of company management, assuring that the best interests of shareholders is pursued in all managerial activities. Although all stakeholders benefit from good governance, there are many examples where different agents have conflicting interests in their attempts to maximize individual utility. For instance, managers benefit from good governance when it positively impacts stock prices, but they also consider fixed salaries and perks when maximizing their utility. Even though fixed salaries and perk consumption helps motivate managers, they are not related to the alue of the fi ’s equity, a d the efo e a e ot alig ed ith sha eholde s’ i te ests.
Because the interests of the shareholders and managers are not aligned, this might lead to a problem, which the literature refers to as the agency problem. The problem comes from the conflicting interest between the manager and shareholder: the shareholder seeks the stock value maximization; the manager seeks their wealth maximization. These conflicting interests between managers seeking corporate perks, which hurt firm value, and shareholders seeking to maximize firm value, is the typical agency problem described in the literature (Jensen and Meckling, 1976).
In order to solve these pro le s a d to alig sha eholde s’ a d a age s’ interests, Shleifer and Vishny (1997) and Jensen and Murphy (1990a) suggested the establishment of long-term compensation plans. For this incentive to work, it must be designed in a way that the pay is aligned with the stock price maximization, so as to tie the interests of shareholders and executives. If this is successful, the manager will be able to improve firm value and personal wealth as well.
The purpose of this dissertation is to determine how incentive alignment mechanisms included in executive compensation packages affect the firm value, following some of the approaches used in the literature. My study uses a set of American firms from 2002 to 2017 and tests whether the inclusion of long-term incentives on e e uti e o pe satio pa kages affe t the fi s’ To i ’s Q a d Retu o Assets (ROA). Apart from the sample period selected, another aspect that distinguishes this
2
dissertation from the extant literature is the use of a different compensation proxy that captures shareholders-manager incentives alignment – namely Compensation Policy/Long Term Objectives a score from the Asset4 database. This is a variable that scores whether executive compensation packages include a long-term incentives plan. In addition to this score, for a smaller sample of companies listed in the S&P500 index, I hand-collected the amount of option grants and restricted stocks given to the CEO as part of their total compensation. With this data, it is possible to compute a more direct proxy of equity-based compensation.
There is still no consensus in the empirical literature on executive compensation about the existence of a positive (or negative) relationship between the incentives alignment mechanisms included in executive compensation packages, and firm value. Overall, I find that the results obtained show evidence that executive managerial compensation packages that included long-term incentives have a positive effect on firm value. The results are robust after including combinations of fixed effects (year, industry and firm) and after addressing endogeneity issues. On the other hand, CEO compensation packages appears to have a positive affect on firm value. But due to limitations on the second sample and the lack of robustness1 those results must be
approached carefully.
This dissertation is composed of the following parts:
In section 2, the literature review, I present and discuss the relevant literature on this topic. Section 3 is the methodology, where the models used to study the relation of the executive compensation and firm value are described. Section 4 is the data, where the variables extraction and sample construction are explained. Section 5 presents and discusses the results obtained from the models employed. Section 6 is the conclusion, where the relevant findings are summarized.
2
Literature Review
Beginning with Berle and Means (1932), with their pioneer study about the agency theory, studies about executive compensation only came about much later.
1 It was not possible to address endogeneity efficiently and when adding the company fixed effects the
3
Empirical researchers have been focusing on studying the conflict of interests between managers and shareholders. Some solutions were found in order to mitigate this problem. One of them is tying the compensation of executives to long term goals related to the value of the firm. Consequently, the executives would have to improve the shareholders’ ealth through the improvement of firm value, to be able to achieve higher compensation.
2.1 Agency Theory
The essence of agency theory is the separation of ownership and control. According to Jensen and Meckling (1976), the agency relationship is a contract made between a principal and an agent. In this contract, the principal delegates the authority to make decisions on their behalf to the agent. The principal in the contract expects that the agent will defend and uphold their best interests. However, if both parties want to maximize their utility, there is a high possibility that the agent will not act in the principal’s est i te ests and try to raise their o utilit at the e pe se of the p i ipal’s utility. The principal, to limit the agent’s different agendas, can establish appropriate incentives for the agent. These conflicting interests between the principal and the agent (in other words between the managers and the shareholders), where managers seek corporate perks that hurt firm value and shareholders that seek to maximize the firm value, is the typical agency problem described in the literature. One way of mitigating this problem and aligning the interests of both managers and shareholders is to set up an executive compensation package where a significant part of the manager’s pa is tied to the alue of the fi ’s e uit i the lo g u .
Shleifer and Vishny (1997) question whether if the manager raises funds from investors to invest or to cash out his holdings in the firm, the fi a e s eed the a age spe ialized hu a apital to ge e ate etu s p. . The poi t is, ho a investors be sure that they will get any returns from their funds? To solve this, the fi a e s a d the a age seal a o t a t. The o t a t a ot e e spe ifi because it is impossible to tell the manager where or how to invest the funds. However, the contract states that the manager must, to his best abilities, run the company in the best interest of the shareholders. The problem with these contracts is that most future
4
contingencies are hard to describe and predict. However, when the contracts between the manager and the financers are infeasible, Shleifer and Vishny suggest that a better solution is to grant the manager a long-term incentive contract, to align the interests of the investors with the manager. Jensen and Murphy (1990a) also suggest the establishment of compensation policies to increase the shareholders’ wealth. They state that sha eholde s do ’t ha e the o plete set of i fo atio a out the a age ’s activities within the firm. If they had, they could have designed a specific contract to force the manager to act in accordance with a set of circumstances that are in alignment with the shareholders’ objectives.
Bebchuck and Fried (2003) discuss and split the agency problems and executive compensations link into two views: the optimal contracting approach, and the managerial power approach. The first, that is predominant between financial economists, regards compensation as a pa tial e ed to the age problem. In this approach, board members are tasked to design the compensations schemes that should provide managers with efficient incentives to maximize shareholders’ value. This view recognizes that the manager is affected by the agency problem and might not seek to maximize the shareholder value. Although the board members are expected to design the package, one cannot forget that the directors also want to be re-appointed, so they are not exempt from the agency problem either. According to the managerial power approach, the executive compensation is part of the problem and is not an instrument to be used to deal with the agency problems. The executives have great leverage over their pay, which means the greater the influence the greater the ability to extract rents. Managers can also use the relationship between equity-based pay and performance to e t a t ealth. Fo i sta e, optio s that a e ’t pa ti ula l li ked to the a age ’s performance, but are dependent on market or sector trends beyond his control, permitting the manager to reap earnings not linked to their effort.
Awarding a CEO tournament incentives to the next level executives might also work to increase the firm’s performance. These corporate promotion tournaments are considered relevant because they can lead to a better managerial performance. Kale et al. (2009) provides evidence that there is a positive relationship between tournament incentives and firm performance, especially when the CEO is near retirement or is less
5
positive when the CEO is new. The relationship also weakens when the CEO is an outsider. Burns et al. (2017) also finds evidence that supports, the view that tournament incentives are an important mechanism to motivate managers, and that tournaments incentives lead to a better firm performance.
2.2 The dangers of excessive equity-based compensation
The long-term incentives contract, as a solution for the conflict of interests between managers and shareholders, may lead to one of two things. First, the manager with his abilities can increase the intrinsic value of the company’s stocks in the market. Secondly, the manager can achieve the same result of increasing the stock value of the company, but through manipulation or fraud, which is a problem with the long-term incentives solution. Thus, the manager gives the perception to the market that the stocks of the company have more value than the real value of the firm. The policy of tying the firm performance may also lead the manager to pursue excessive risks while governing the firm to achieve his compensation goals (Denis et al., 2006). The fundamental use for equity incentives is the need to link the changes i the a age ’s wealth, to the maximization of the shareholder stock value, because the shareholders cannot themselves observe or execute, themselves, the best opportunities for the business. Therefore, they must hire a manager and delegate on them these responsibilities to them. The manager is supposed to have superior information about these opportunities, in comparison to the shareholders. Thus, to make the best out of this, the shareholders motivate the managers by linking the manager’s wealth to the firm performance (Core et al., 2003).
However, the executive compensation theory and the empirical studies support the notion that there is a positive relationship between equity-based executive compensation and firm value. There are studies that warn that awarding excessive compensation incentives may lead to some adverse results. It can lead to manipulation of the results to inflate the stock prices. Companies with more compensation policies incentivizing the CEO that are more sensitive to the o pa ’s sto k p i es have higher levels of earning management. This results in evidence that accrual-based measures of earnings management are higher on firms with a higher level of stock-based incentives.
6
Bergstresser et al. (2006) also found an unusual option exercised by the CEO, coinciding with periods of high accruals, but also an unloading of shares by CEOs and top executives. Bennet et al. (2017) found evidence that executive managers reported accounting performance to achieve compensation goals. Firms that have just exceeded their EPS goal have higher abnormal accruals and lower R&D expenditures when compared to firms that just missed their goal. Their results indicate that there is less performance management if the goals are specified with other firms, in terms of sales or profit targets, which is consistent with tying the interests of the goals with the firm valuation.
However, if the incentives awarded by the companies are focused on the long-term and well defined in the remuneration of the managers, this kind of manipulation of stock prices in the short-run losses its relevance.
2.3 Compensation Packages
In the 1980s the majority of executive compensations in the US were composed of cash compensations, however, since 2000, stock options have become an important component of executive compensations. Options have greatly improved the wealth of the executive managers, nevertheless, the long-term impact on business remains unclear. Stock options can create controversy for the outside viewer due to the increase in wealth it generates for executives. Stock options as a compensation mechanism, however, is a good way to guarantee that managers act in ways that ensure the long-term success of the companies and the well-being of the stakeholders (Hall, 2000). Equity-based compensation is also important for the maximization of the shareholders’ wealth. Using a ranking system based on a literature survey, Mehran et al. (2009) founding the mean wealth, maximizing compensation packages, which consisted of 62.01% of cash, 27.99%% equity-based compensation and 10% in other types of compensation. They also asked board members about the overall priority for cash and equity-based compensation, which resulted in a similar outcome, when comparing with the literature survey performed by the authors. This suggests that board members are aware of the importance of awarding equity-based compensation.
7
The problem with CEO compensation is not the excessive pay. The real issue, that gets set aside by the media, is how CEOs are paid. Core et al. (1999) found that in firms with weaker corporate governance structures, i.e. those with greater agency problems, CEOs earn larger compensations, and the firms perform worse. In most publicly held, companies the compensation policies are independent of the firm performance. That is why some CEOs run their companies in a bureaucrat style, and not as a more value-pursuing entrepreneur who would seek to maximize the market value of the companies. The most important connection between the wealth of the shareholder and the CEOs wealth is the stocks that the manager owns. However, CEO stock ownership for larger fi s is athe s all. Co pe satio poli is o e of the ost i po ta t fa to s i a o ga izatio ’s su ess Je se a d Mu ph , , p. , li ki g the compensation to the firm performance would not mean a transfer of wealth, but rather a reward towards the manager for his success in governing the company (Jensen and Murphy 1990b).
Core et al. (1999) found that CEO compensation is higher when the CEO also sits on the board of directors. If the board is larger, there is a higher probability that there are outside directors who are appointed by the CEO. The CEO compensation is also larger when the directors are older and belong to more than three boards at the same time. According to Brick et al (2006), there is evidence that the compensations of CEOs and board of directors are positively correlated with each other due to the presence of cronyism2, which might mean that the managers and directors are putting their interests
before those of the shareholders.
Cooper et al. (2016) studied the relationship between overconfident CEOs and the firm performance. They found that firms with highly paid CEOs earn lower returns when the CEO is overconfident. They concluded that the negative relationships between excessive incentive compensation and future performance is attributable to CEOs that accept high long-term incentives pay. They are, on average, overconfident and engaging in value destroying practices that result in lower performances and stock returns. These effects are stronger when the firms lack a strong corporate governance. This implies that
8
the compensation structures and long-term incentives payment might not create higher returns, but rather the opposite.
2.4 Previous studies on the relation between compensation and the firm
Overall, the financial literature does not seem to reach a consensus about the true impact of compensation on the firm value. The reasons addressed to this problem are the small sample sizes, the differences in the methodology, the measure of equity-based executive compensation or even the firm valuation method.
The majority of the studies find that compensation has a positive impact on firm value. Most of this evidence comes from American firms (e.g., Mehran, 1995; Frye, 2004;
Lewellen et al., 1992; Kuo et al., 2013; Abowd, 1990; Larcker el at., 2007; Tai, 2004; Aaron et al., 2014; Jensen and Murph, 1990a; Hall and Liebman, 1998). There are also studies focused on Canada and Japan (e.g. Zhou, 2000; Kato et al., 2005) that support the idea that tying the e e uti es’ pa to the fi pe fo a e is o e a to itigate the conflict of interests between managers and shareholders.
Mehran (1995), usi g To i ’s Q a d ROA as fi pe fo a e p o ies, found that firm performance is positively related to the percentage of equity-based executive compensation and to the percentage of equity held by the managers. Following Mehran, Frye (2004) proved that the use of equity-based compensation for employees is positively related to firm performance. Lewellen et al. (1992), using the annual rates of return, ROE, and after-tax compensation of the three highest-paid executives, found evidence that pay and performance are positively correlated in a small sample of large industrial firms. Kuo et al. (2013) used ROE as a proxy for firm performance and stock options plus compensation from restricted stocks over total annual compensation. They found that the CEO equity incentives has a positive impact on firm performance, but also is more pronounced in firms with a lower and moderated level of stock-based incentives, and on those that are less profitable.
Apart from using two accounting measures, the ROA and the ROE, Abowd (1990) also used the gross cash flow and a market performance, the total shareholder return. This study proved that pay-for-performance systems that are based on after-tax gross
9
economic return and total shareholder return may be effective to increase firm performance, because, when increasing the compensation sensitivity to these measures they can be associated with better performance. Benson and Davidson III (2009), using To i ’s Q ith fi ed effe ts a d o t olli g fo e doge eit , found that their results are consistent with the incentive alignment.
Using a different measure, the dollar change in CEO wealth per $1000 change in firm market value Jensen and Murphy (1990a) argued that the relation between CEO wealth and shareholder wealth is small. However, Hall and Liebman (1998) reached a different conclusion using a fifteen-year data set of large American firms and using 4 measures of compensations. In addition to the measure used by Jensen and Murphy (1990a), they also used another two that measure how CEO wealth changes with typical changes in firm performance, and one that measures the increase in CEO compensation for every one percent in firm value. Using the salary and bonus received by the CEO during the fiscal year, they found a strong link between firm performance and CEO pay, and they also found that the fortunes of the CEOs and the firms are strongly correlated. Tai (2004), with a small sample of American Quality Companies, using the same dependent variable as Hall and Liebman and the firm rates of return, found that there is a positive relation between CEO incentivized pay and firm performance. Similarly, Aaron et al. (2014) reached the same conclusion with a bigger database and using the percentage of incentivized compensation over the overall compensation of the CEO, and the cumulative abnormal return as proxy for firm performance.
There are some studies performed where the sample is not from American firms, for example, Zhou (2000) analysed a set of Canadian firms and found that CEO pay is correlated to firm size and that the compensation is tied to firm performance. To find these relations between firm and compensation, he used changes in the shareholder wealth and CEO pay: the salary plus bonus pay and total pay. Moreover, splitting his data set into small firms versus big firms, the big firms are the ones that are emphasizing firm growth and are adopting a stronger pay-size elatio . This esult see s su p isi g because one might have expected that small firms would be more likely to emphasize firm growth and thus adopt managerial pay schemes with stronger pay-size
10
elatio ship p. , hi h means that small firms are the ones that should be focusing on paying more and using compensations to grow.
After 1997, Japanese firms could also grant stock options to their employees. Kato et al. (2005) studied a set of Japanese firms from 1997 to 2001 using ROA. They found that, after the adoption stock options plans, the ROA increased when compared to their benchmark. This means that adopting an option plan improved the firms operating performance in Japan.
In contrast, Palia (2001) and Cheng and Farber (2008) reached an opposite conclusion. Palia , usi g To i ’s Q as a p o fo fi pe fo a e a d CEO pa -performance sensitivity, established that compensation is endogenous. Thus, he performed a two-stage least square regression with firm level fixed effects and year dummies, finding no statistically significant relationship between shareholders’ incentive-compatible executive compensation and firm value. Cheng and Farber (2008) studied fi ’s earnings restatements and found that firms reduce the proportion of CEOs’ option-based total compensation after a restatement, consequently improving the operating performance of the firm.
Furthermore, mixed results have been found by other authors. Li et al. (2015) used ROE, To i ’s Q a d sto k ased o e total o pe satio as a o pe satio measure. They Concluded that the impact of CEO equity-based pay is negative on firm performance and on firms that are undergoing their less profitable stage, but it is positive for firms that are on their most profitability or growth stage. Furthermore, Aboody et al. (2010) examined the relationship between option-repricing and firm performance. They found that firms that include the executives in the stock options repricing outperformed those that excluded the executives from the repricing. They reached the conclusion that when top executives are included in the re-pricing of stock options, it provides an incentive effect capable of influencing the firm performance. It also proved that executive level stock options provide a large enough effect to impact the firm performance.
11
2.5 Main hypothesis of the study
Based on the literature reviewed above, I have formulated the main hypotheses that will be tested in this study:
H1: There is a positive relationship between the level of equity-based/long-term
incentives compensation for executives and the firm value.
H2: There is a positive relation between the level of CEO equity-based compensation
and firm value.
Financial literature suggests that providing executive managers with long-term incentive alignment compensation is a measure to mitigate the conflicting issues between manager and shareholders. Even though it is still an ongoing debate, a vast part of the literature seems to confirm a positive relationship between long-term incentive compensation and firm value or performance.
3
Methodology
In order to the determine if long-term incentive packages affect the firm value, it is necessary to use a set of regressions. Therefore, the empirical research models used will be described in this section.
3.1 Ordinary Leas Squares (OLS) Regressions
As i p e ious elated lite atu e, I use To i ’s Q as a p o fo fi alue a d ROA to measure operating profitability. In the literature, there are studies that mainly use OLS regressions (see Mehran, 1995; Lewellen et al. 1992). Accordingly, I will use two OLS regressions to get my preliminaries results, specified bellow:
���� = + � � � � � � ��+ � ��+ �� (2)
′
12
In the equations, the dependent variables are ′ �� and ����, the To i ’s Q is defined as total assets minus book value of equity plus market value of equity, all over total assets for firm i in year t. ROA is defined as earnings before interests and taxes (ebit) over total assets, for firm i in year t. The main variables of interest are
� � � � � � ��3, which is a score variable from the Asset4 database that
measures if the executives have a long-term objective target and gives a score for the intensity of those incentives in the compensation package.4 The model includes a set of
control variables, namely size, leverage, sales growth and, in equation (1) profitability. Size ( � � )is the natural logarithm of total assets of firm i in year t; leverage � � ���� , is the long-term debt over total debt; Sales growth � � ℎ�� is
measured as the change in the sales over one year, t minus t-1 over t-1; profitability ���� is measured as the earnings before interests and taxes (ebit) over book value
of equity.
On both regressions the presence of heteroskedasticity was tested5. The two
models were proved to have presence of heteroskedasticity. Thus, I used the White (1980) corrected standard errors to address this issue.
3.2 OLS with fixed effects
Secondly, I estimated the same equations but considered a fixed effects model to account for time-invariant industry and unobservable firm characteristics.Brick et al. (2006) and Abowd (1990) also used fixed effects in their models.
To ensure that fixed effect model was the most appropriate method, I performed the Hausman Test, whichproved that the fixed effect model was more appropriate than the random effect model. To build the effects, I used year, industry and company dummies and paired them as industry/year and company/year. For the industry dummy variable, I used a 2 digit SIC code. Once again, the presence of heteroskedasticity was tested and addressed using the White (1980) corrected standard errors.
3 The variable full name description and code: Score - Compensation Policy/Long Term Objectives –
Database Code: CGCPO07S
4 It is based on another value from asset4 database, that ranks in true or false, per example if the
executive compensation package includes LT incentives (1) or not (0).
13
3.3 Addressing endogeneity: Two-Stage Least Squares (2SLS)
The OLS regression can give biased results in the presence of endogeneity, which is the possibility of a correlation between the explanatory variable and the error term. In order to solve this problem, I used the Two-Stage Least Squares regression, just has Palia (2001) did. As an instrumental variable, I used a governance score, and thus, the first stage regression was computed using both combinations of fixed effect, to save the residuals.
� � � � � � �� = + � � � ���+ � ��+ ��
Where the � � � ���6 is a score from the Asset4 database, it is a score
that also efle ts the o pa ies’ apa it to use thei est a age e t p a ti es to direct and control their rights and responsibilities. This is accomplished through the creation of incentives, as well as checks and balances in order to generate long-term shareholder value.
The residuals from the first stage least square were regressed with the instrument taking into account the fixed effects combinations. The results show that the instrument was not statistically significant, validating the instrument7. Thus, the
� � � ��� can be used as an instrument in the Two-Stage Least Square
regression.
Since the score was proven to be useable, the Two-Staged Least Squares was regressed with the fixed effects combination, and for both firm value proxies, the To i ’s Q a d the ROA. Due to the la ge u e of du a ia les fo the o pa ’s fixed effect, the configurations of the Stata software had to be changed.
6 Variable description and code: Corporate Governance Score – Database code: CGVSCORE 7 I also performed the same regression but with the residuals of the 2nd stage regression, where I
14
4
Data
With the purpose to evaluate the relation between the executive compensation packages and the firm value, it is important to be able to construct a dataset which includes a set of accounting, firm value, and compensation variables. The focus of my research is the US market, where there is a bigger set of public companies and more available data.
First, I started by obtaining all the accounting data from DataStream/WorldScope database and the compensation data from the Asset4 database, both provided by Thomson Reuters. The sample is composed of yearly data that spans from 2002 to 2017. The initial number of companies was 2037 and, following the main literature, I applied several filters. First, I excluded companies with missing data, and companies with sic codes between 6000 and 6799 and between 4000 and 4999, which represent the financial and utility sectors, respectively. Lastly, I excluded all companies with sales equal or below zero and companies with total assets equal or below 10 Million. The final data set therefore included 1140 companies and 6964 observations.
After the construction of the variables, the data had to be winsorized. The variables that were affe ted this e e the depe de t a ia les: To i ’s Q a d ROA, and the control variables: log of assets, leverage and salesgrowth. Winsorizing these variables controls for the possibility of having outliers that could lead to a biased outcome.
For the main body of the dissertation, I will be using a score that relates e e uti es’ pa to the lo g-term objectives. The initial idea was to use as a proxy for the compensation, the value of the CEO equity-based compensation over the total compensation. However, there were no available data on the accessible databases. To overcome this issue, I had to manually build a smaller data set to run the same analysis, to check, and to add robustness to my findings. To do this, I had to access Thomson Reuters and manually extract the data for the option awards and restricted stock awards for each of the CEOs, from 2014 to 2017. I started with a list from S&P500 extracted from DataStream and selected the first 314 companies, and then manually extracted the data. After compiling all the data, I applied the same filters as before, removing missing
15
data, sic codes between 6000 to 6799 and between 4000 to 4999, sales equal and below zero and total assets bellow 10 Million. I therefore reached the final data set of 186 companies and 814 observations.
4.1 Descriptive Statistics
This subsection exhibits the summary statistics for the variables used by both analyses. Table 1 provides the summary statistics for the variables employed by the analysis of the relation between incentive-aligned executive compensation and firm value. Table 2 provides the summary statistics for the variables used in the analysis of the relation between the CEO compensation and firm value. Both tables display the reported value for the mean, median and standard deviation.
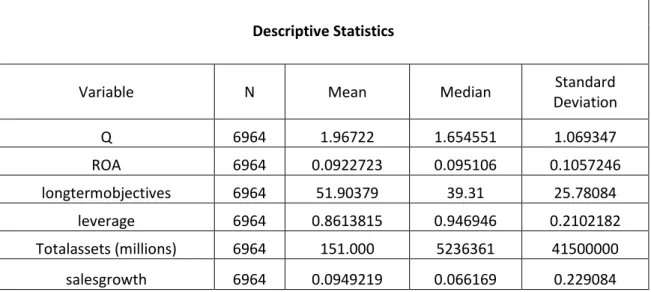
In Ta le the ea epo ted fo To i ’s Q Q is . , and in Table 2, with the set of companies from the S&P500, the mean is higher, at 2.41892. When comparing with several similar studies, the To i ’s Q reported here presents higher values. For example, Palia (2001) showed a To i ’s Q ith a ea of . , with 3260 observations. Frye (2004) presented a To i ’s Q i of 1.35, with 326 observations, and in 1999, it was 1.46, with 619 observations. Lastly, Benson et al. (2009) dislayed a To i ’s Q ith a mean of 1.8901 for their 9429 observations.
Also, in Table 1 and 2, the mean reported for ROA is 9.227% and 11.985%, respectively. When comparing with Frye’s (2004) study, her sample mean in 1994 for ROA is 4.89%, and for 1999 is -16.50%. My ROA ith To i ’s Q also displa s highe alues when comparing with several similar studies.
Comparing both datasets with the size of the firms in mind, Table 1’s broader dataset, has a mean of total assets of $151,000 Million. With the smaller set of firms from the S&P500, the mean of the total assets is higher, at $385,000 Million. Comparing with some of the previous studies, for example Benson et al. (2009), the mean for total assets is $9,625 Billion. With both samples from 1994 and 1999, Frye (2004) has a mean of $9,954 Million and $4,583 Million, respectively.
16 Table 1 – Summary Statistics
This table reports the summary statistics for all the variables computed to run with the models proposed for the first data base analysis. All the data were taken from Thomson Reuters DataStream/ Worldscope a d Asset Data ases. To i ’s Q Q , ROA, le e age a d salesgrowth described here were all winsorized at 1% tails.
Descriptive Statistics
Variable N Mean Median Standard
Deviation Q 6964 1.96722 1.654551 1.069347 ROA 6964 0.0922723 0.095106 0.1057246 longtermobjectives 6964 51.90379 39.31 25.78084 leverage 6964 0.8613815 0.946946 0.2102182 Totalassets (millions) 6964 151.000 5236361 41500000 salesgrowth 6964 0.0949219 0.066169 0.229084
Table 2 - Summary Statistics
This table reports the summary statistics for all the variables computed to run with the models proposed for the second data base analysis. All the data were taken from Thomson Reuters and Thomson Reuters Data“t ea / Wo lds ope a d Asset Data ases. To i ’s Q (Q), ROA, leverage and salesgrowth
described here were all winsorized at 1% tails.
Descriptive Statistics
Variable N Mean Median Standard
Deviation Q 814 2.41892 2.020079 1.294095 ROA 814 0.1198537 0.1117628 0.0924762 Compensation 813 0.7209839 0.7703882 0.195924 restrictedstocksawards 814 6115309 5107069 5741413 optionsaward 813 2537858 1866663 3921901 totalannualcompensation 814 14800000 13100000 8773757 leverage 814 0.8720307 0.9194224 0.1486719 Totalassets (millions) 814 385.000 18200000 61500000 salesgrowth 814 -0.0170663 -0.0332144 0.1570435
17
5
Results
In this section the results are presented and discussed whether the relation between awarding equity-based compensation and the firm value is positive or not.
5.1 Results – Long-term Objectives
This subsection displays the results obtained with the first data sample where I am studying the relationship between Executive Managers long-term compensation and the firm value.
5.1.1 OLS Regression
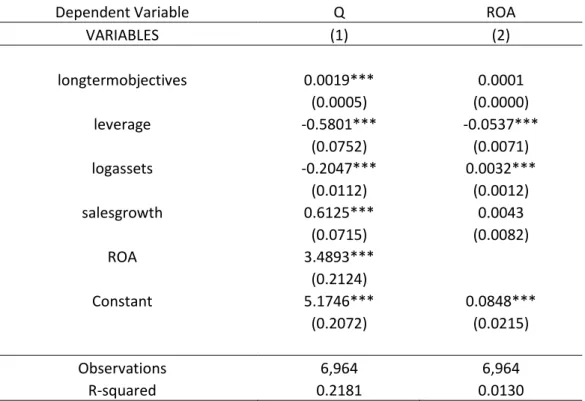
Table 2 exhibits the estimates for the preliminary results on the relation between the o pe satio a d the fi alue. Colu , ith To i ’s Q as the dependent variable, includes the score for Long term objectives plus the model control variables: size, growth opportunities, leverage and profitability. Column (2) displays ROA as the dependent variable and includes the score for Long term objectives plus the model’s control variables, except for the profitability control.
In column (1), the coefficient for the long-term objectives score is positive and statistically significant. So, for every percentage point increase in the long-term objectives score, there is a i ease of . i To i ’s Q. Fu the o e, le e age a d log of assets show a negative and statistically significant coefficient. On the other hand, sales growth and ROA coefficients are positive and statistically positive.
The expected signs for the coefficients are in accordance with some of the literature. For example, Mehran (1995) also found a positive sign for the growth opportunities coefficient in his outputs. However, he found a negative sign for the coefficient of the log of assets in both regressions.
According to Agency theory, equity-based compensation packages should help mitigate the conflicting interests between executive managers and shareholders. Therefore, having compensation should improve firm value. With the first results from
18
Table 3, we can conclude that awarding long-term incentives is having a positive impact o fi alue To i ’s Q . Ho e e , e ause there is some limitation to an OLS regression, more tests are needed to reach a more precise conclusion.
Table 3 – Preliminary Results on the relation of Long Term Compensation and Firm Value
This table presents the first results on the ordinary least squares estimation, for the analysis of the relation between incentive-alig ed e e uti e o pe satio a d fi alue. The depe de t a ia les a e To i ’s Q and ROA. The variable of interest is Longtermobjectives. White’s (1980) corrected standard errors are shown in parenthesis. *, **, *** stands for statistical significance at 10%, 5% and 1% levels, respectively.
Dependent Variable Q ROA
VARIABLES (1) (2) longtermobjectives 0.0019*** 0.0001 (0.0005) (0.0000) leverage -0.5801*** -0.0537*** (0.0752) (0.0071) logassets -0.2047*** 0.0032*** (0.0112) (0.0012) salesgrowth 0.6125*** 0.0043 (0.0715) (0.0082) ROA 3.4893*** (0.2124) Constant 5.1746*** 0.0848*** (0.2072) (0.0215) Observations 6,964 6,964 R-squared 0.2181 0.0130
5.1.2 OLS Regression with Fixed Effects
Table 4 exhibits the estimates for the results on the relationship between the compensation and the firm value, considering company and firm fixed effects. Column (1) to (2) displays the outputs regarding company fixed effects. Colu sho s To i ’s Q as the dependent variable and it includes the score for long term objectives plus the model control variables: size, growth opportunities, leverage and profitability. Column (2) displays ROA as the dependent variable and includes the score for long term objectives plus the model’s control variables except for the profitability control.
19
Regarding the company fixed effects in column (1), the coefficient of log of assets is negative and statistically significant. Salesgrowth and ROA coefficients, on the other hand, are positive and statistically significant. In column (2), the coefficient of log of assets is negative and also statistically significant. The coefficient of salesgrowth is positive and statistically significant.
Columns (3) and (4) display the outputs regarding industry fixed effects. Column sho s To i ’s Q as dependent variable and includes the score for long term objectives, plus the model control variables. Column (4) displays ROA as the dependent variable and includes the score for long term objectives, plus the model’s control variables, except for the profitability control.
Regarding the industry fixed effects in column (3), the coefficient for the long-term objectives is positive and statistically significant. So, for every percentage point increase in the long-term objectives score, there follows an i ease of . i To i ’s Q. Furthermore, the coefficients of leverage and log of assets are negative and statistically significant. On the other hand, the coefficients of salesgrowth and ROA are positive and statistically significant. In column (4), the coefficient of the long-term objectives is positive and statistically significant at a 5% level of significance. So, for every percentage point increase in the long-term objectives score, there is an increase of . i To i ’s Q. Fu the o e, the leverage coefficient is negative and statistically significant.
When considering industry fixed effects, the impact of the long-term incentives is positi e o the fi alue To i ’s Q . E e the ope ati g pe fo a e ROA see s to be positively impacted by the long-term incentives. While, with company fixed effects, there seems to be no impact on the firm value and the operating profitability. One possible reason for this difference between company and industry fixed effects might be due to the number of dummy variables. I used for company 1140 dummies and for industry 46 dummies.
20 Table 4 – Results on the relation of Long Term Compensation and Firm Value
considering fixed effects.
This table presents the results on the analysis of the ordinary least squares estimation, the analysis of the relation between incentive-aligned executive compensation and firm value considering company, industry, a d ea fi ed effe ts. The depe de t a ia les a e To i ’s Q a d ROA. The a ia le of i te est is Longtermobjectives. White’s (1980) corrected standard errors are shown in parenthesis. *, **, *** stands for statistical significance at 10%, 5% and 1% levels, respectively.
Dependent Variables Q ROA Q ROA
VARIABLES (1) (2) (3) (4) longtermobjectives -0.0002 0.0001 0.0020*** 0.0001** (0.0007) (0.0001) (0.0004) (0.0000) leverage -0.0767 -0.0122 -0.5452*** -0.0323*** (0.0817) (0.0080) (0.0721) (0.0071) logassets -0.2681*** -0.0202*** -0.1938*** -0.0005 (0.0419) (0.0041) (0.0118) (0.0013) salesgrowth 0.2024*** 0.0549*** 0.5324*** 0.0069 (0.0512) (0.0087) (0.0710) (0.0084) ROA 1.8822*** 3.3325*** (0.2172) (0.2092) Constant 6.0257*** 0.4093*** 5.2224*** 0.0874*** (0.6565) (0.0643) (0.2406) (0.0295) Observations 6,964 6,964 6,964 6,964
company fixed effects yes yes no no
industry fixed effects no no yes yes
year fixed effects yes yes yes yes
R-squared 0.1051 0.0362 0.3417 0.1167
5.1.3 Two-Stage Least Squares
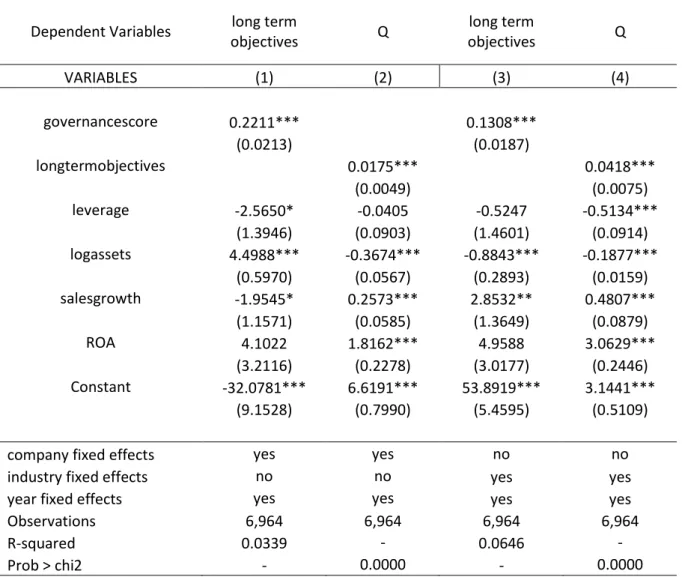
In this subsection, I analyse the relationship between the executive long-term compensation and firm value. However, this time I am considering the presence of endogeneity between the long-term compensation and the error term. To do so, I use a two-stage least squares regression with a governance score as the instrument. The first stage regression is displayed in Table 5. For the company and industry fixed effects, see columns (1) and (3). This shows that the governance score is positive and statistically significant in both columns. Saving the residuals from the two first-stage regressions and regressing the residuals to the governance score, the results show that the governance score is not statistically significant (these results are not reported in the table). Meaning
21
that with these two results, the governance score is well suited to be used has an instrument in the two-stage least square regression.8
In Table 5, both panels of fixed effects (column (2): company fixed effects, column (5): industry fixed effects) use the governance score as the instrumental variable. Columns (2) and (4 sho s To i ’s Q as the dependent variable. In all columns, the long-term objectives score is the main variable of interest. All columns also display the control variables: size, growth opportunities, leverage and profitability.
While To i ’s Q efle ts o the a ket alue of the fi the e pe ted e efits i the long run of the compensation incentives at place, ROA is a short-term measure that only captures the operating performance in a specific year. A more appropriate use of ROA, would be to consider an average of a few years following changes in compensation incentives to be able to see proper effect. However, by doing so, I would have lost a considerable amount of observations. Thus, throughout my analysis, I give more e phasis to To i ’s Q, as it is the ost app op iate easu e of fi pe fo a e fo the hypothesis tested in this dissertation. In the next sections, I will present my results usi g o l To i ’s Q.
Regarding company fixed effects in column (2), the long-term objectives score is positive and statistically significant. Meaning that, for every percentage point increase in the long-term objectives score, there follows a i ease of . i To i ’s Q. Furthermore, the coefficient of the log of assets is negative and statistically significant. Concerning the industry fixed effects in column (4), the long-term objectives score is positive and statistically significant. Thus, every percentage point increase in the long-te o je ti es s o e, leads to a i ease of . i To i ’s Q. Additio all , the coefficients of leverage and log of assets are negative and statistically significant.
The expected signs for the coefficients are in accordance with some of the literature. For example, Palia (2001) also found in his two-stage least square regression outputs a positive sign for the growth opportunities. However, contrary to my output, he also found a positive sign for the coefficient of the log of assets.
8 Performed the same test using the residuals of the 2nd stage regression and reached the same
22
When considering the endogeneity, Table 5 has proven that there is a positive impact to the firm value when awarding long-term incentive compensation to executive managers. Overall and throughout the OLS regression, when adding fixed effects and controlling for endogeneity, the results obtained are in accordance with some of the literature. Offering long-term incentives to executive managers seems to be having a positive impact in the fir alue To i ’s Q . Ho e e , it does not have the same impact in the operating profitability (ROA) due to some limitations of using ROA as a dependent variable.
Table 5 – Results on the relation of Long Term Compensation and Firm Value considering the Endogeneity.
This table presents the results on the two-stage least squares estimation, for the analysis of the relation between incentive-aligned executive compensation and firm value considering company, industry and year fixed effects, when addressing Endogeneity. The instrument used in the two-stage least square is the Go e a e “ o e. The depe de t a ia les a e To i ’s Q a d ROA. The a ia le of i te est is Longtermobjectives. White’s (1980) corrected standard errors are shown in parenthesis. *, **, *** stands for statistical significance at 10%, 5% and 1% levels, respectively.
Dependent Variables long term
objectives Q long term objectives Q VARIABLES (1) (2) (3) (4) governancescore 0.2211*** 0.1308*** (0.0213) (0.0187) longtermobjectives 0.0175*** 0.0418*** (0.0049) (0.0075) leverage -2.5650* -0.0405 -0.5247 -0.5134*** (1.3946) (0.0903) (1.4601) (0.0914) logassets 4.4988*** -0.3674*** -0.8843*** -0.1877*** (0.5970) (0.0567) (0.2893) (0.0159) salesgrowth -1.9545* 0.2573*** 2.8532** 0.4807*** (1.1571) (0.0585) (1.3649) (0.0879) ROA 4.1022 1.8162*** 4.9588 3.0629*** (3.2116) (0.2278) (3.0177) (0.2446) Constant -32.0781*** 6.6191*** 53.8919*** 3.1441*** (9.1528) (0.7990) (5.4595) (0.5109)
company fixed effects yes yes no no
industry fixed effects no no yes yes
year fixed effects yes yes yes yes
Observations 6,964 6,964 6,964 6,964
R-squared 0.0339 - 0.0646 -
23
5.2 Results – CEO Equity-based Compensation
This subsection displays the analysis of my second data sample. Whether awarding equity-based compensation to the CEO has a positive effect on the firm value. In this analysis, I am replicating the same methodology, though with a change to the main variable of interest. This will now be measured as the CEO’s Optio A a ds plus the Restricted Stock Awards over the Fiscal Year Total Annual Compensation.
5.2.1 OLS Regression and Fixed effects
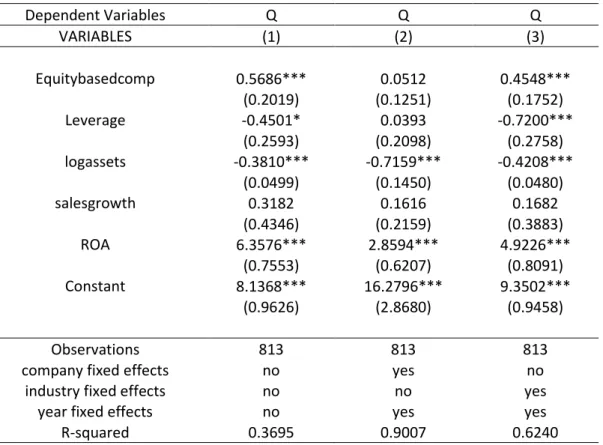
Table 6 exhibits the estimates for the results on the relationship between the equity-based compensation of the CEO and the firm value also displays the estimate with the fixed effects. Column (1) displays the output without regarding any fixed effects Column (2) displays the output regarding company fixed effects and Columns (3) displays the outputs regarding industry fixed effects. Column (1) (2) and (3), ith To i ’s Q as the dependent variable, includes the main variable of interest equitybasedcomp plus the model control variables: size, growth opportunities, leverage and profitability.
In Column (1), the main variable of interest equitybasedcomp is both positive and statistically significant. This means that every percentage point increase in the variable leads to an increase of 0,5686 percentage points i To i ’s Q. Fu the o e, log of assets shows a negative and statistically significant coefficient, while ROA shows a positive and statistically significant coefficient.
Regarding the company fixed effects, seen in Column (2), the main variable of interest is not statistically significant. On the other hand, in the industry fixed effects, seen in Column (3), the main variable of interest is positive and statistically significant. Thus, every percentage point increase in the equitybasedcomp variable leads to an increase of 0.4548 percentage points i To i ’s Q. Fu the o e, le e age a d the log of assets show a negative and statistically significant coefficient, while ROA shows a positive and statistically significant coefficient.
24
With this first test (see Column (1)), one could say that the relation between the CEO equity-based compensation and the firm value is positive, however, just like before, using only an OLS regression is not enough to reach a definite conclusion.
As with the same analysis of the long-term objective score in the previous section, when adding the fixed effects, the same pattern appears here. The industry fixed effect has a positive and statistically significant output, which, in contrast, the company fixed effect does not have. As seen earlier it might be because of the same reasons, the number of dummy variables for the company factor is much bigger than the industry one.
Table 6 -Results on the relation of CEO Compensation and Firm Value
This table presents the first results on the ordinary least squares estimation, for the analysis of the relationship between equity-based compensation of the CEO and firm value and considering company, industry and year fixed effects. The dependent variable is To i ’s Q. The a ia le of i te est is Compensation. White’s (1980) corrected standard errors are shown in parenthesis. *, **, *** stands for statistical significance at 10%, 5% and 1% levels, respectively.
Dependent Variables Q Q Q VARIABLES (1) (2) (3) Equitybasedcomp 0.5686*** 0.0512 0.4548*** (0.2019) (0.1251) (0.1752) Leverage -0.4501* 0.0393 -0.7200*** (0.2593) (0.2098) (0.2758) logassets -0.3810*** -0.7159*** -0.4208*** (0.0499) (0.1450) (0.0480) salesgrowth 0.3182 0.1616 0.1682 (0.4346) (0.2159) (0.3883) ROA 6.3576*** 2.8594*** 4.9226*** (0.7553) (0.6207) (0.8091) Constant 8.1368*** 16.2796*** 9.3502*** (0.9626) (2.8680) (0.9458) Observations 813 813 813
company fixed effects no yes no
industry fixed effects no no yes
year fixed effects no yes yes
25
5.2.2 Two-Stage Least Squares
With the equity-based CEO compensation it is not possible to perform the Two-Stage Least Squares regression. Due to the limitations of the number of observations in the sample. The fact that this sample was hand-collected make it impossible to have reached a larger number of observations. Therefore, the instrumental variable was proven to not be adequate (not statistical significant) nor others tested were able to pass the tests. For this reason, the results must be addressed with some caution.
Overall, the results might suggest some positive relationship between the CEO equity-based compensation and firm value (see Table 6). However, the results give little robustness, because it was impossible to address the issue of endogeneity in an efficient way and the results disappear when I introduced company fixed effects. Because of these limitations and the literature that states that equity-based compensation can be a possible solution to the agency problem. This analyse should be repeated with a larger sample number and more details data on the equity-based compensation.
Even with no conclusive answer to the relationship between CEO compensation and firm value, it serves as a support for the CEO tournament incentives or Tournament Theory, where awarding managers with promotion incentives lead, to their better performance. This, in turn, increase in the firm value of the firm, contrary to just awarding the CEO with incentives.
26
6
Conclusion
My dissertation examines the relationship between long-term equity-based incentives of executives and the value of a firm. I used two samples: the first was 1140 firms from 2002 to 2017, to examine the relation of the executives and the firm value: and the second was 186 firms from the S&P500 index list from 2014 to 2017, to examine the relationship between CEO compensation and firm value.
Agency theory states that in order to mitigate the conflicting interest between managers and shareholders, the use of long-term equity-based compensation should be used, as a way to take into account the interests of the shareholders. This should be done so that the manager would work to increase the firm value in exchange for the
e t a e u e atio , ithout da agi g the fi to e t a t their personal gains. With my first dataset, I confirmed my first hypothesis, as firm value seems to react positively to the presence of long-term incentives for executive managers, which comes in accordance with some of the literature.
My second sample did not reach a conclusive answer, if whether awarding only the CEO with equity-based compensation results in increasing the firm value, as some of the literature states. This might be due to the difference of the sample sizes, and by using the same methodology I reached different results. However, this also supports the Tournament theory, where, with CEO tournament incentives, that awards executive manager’s outputs, and not the time spent. This motivates them to want to reach higher positions in the hierarchy of the firm, granting them access to more wealth. This results in the executives working harder, even sometimes taking excessive risks, increasing the firm performance and the firm value. Lazear and Rosen (1981) gave the example that the large salaries of the e e uti es’ may serve has an incentive to all who work in the firm. This goes in accordance with my results that give a positive weight to awarding long-term incentives to managers, resulting in a positive relationship between executive managers long-term incentives and the firm value.
Although the results suggest a positive relationship between CEO equity-based compensation and firm value, these results suffer from a lack of robustness maybe due
27
to sample limitations. These issues came from not being able to address endogeneity efficiently and the results disappearing when adding company fixed effects. So, for future research, I suggest increasing the sample size, collecting a more complete data on equity-based compensations and broadening the study to other geographical areas. For example, Europe, where these problems are less studied, the information is more scattered and the compensation schemes may suffer slightly changes from country to country.
28
7
References
Aaron, R.J., Harris, L.M., McDowell, C.W., Cline, N. B. (2014). Optimal CEO Incentive Contracts: A Prospect Theory Explanation. Journal of Business Strategies, 31(2), 336-356.
Abbody, D., Johnson, B.N., Kasznik, R. (2010). Employee stock options and future firm performance: Evidence from option repricings. Journal of Accounting and Economics, 50, 74-92.
Abowd, J. (1990). Does Performance-Based Managerial Compensation Affect Corporate Performance? Industrial and Labor Relations Review, 43(3), 52-73.
Bebchuk, A.L., & Fried, M. J. (2003). Executive Compensation as an Agency Problem.
Journal of Economic Perspectives, 17(3), 71-92.
Bennett, B., Bettis, J., Gopala, R., & Milbourn, T. (2017). Compensations goals and firm performance. Journal of Financial Economics, 124, 307-330.
Benson, W., B., Davidson III, N., W. (2009). Reexamining the managerial ownership effect on firm value. Journal of Corporate Finance. 15(5), 573-586.
Bergstresser, D., & Philippon, T. (2006). CEO incentives and earnings management.
Journal of Financial Economics, 80, 511-529.
Berle, A., Means, G. (1932). The Modern Corporation and Private Property. New York: Macmillan.
Brick, I., Palmon, O., & Wald, J. (2006). CEO compensation, director compensation, and firm performance: Evidence of Cronyism? Journal of Corporate Finance, 12, 406-423. Burns, N., Minnick, K., Starks, L. (2017). CEO Tournaments: A Cross-Country Analysis of Causes, Cultural Influences, and Consequences. Journal of Finance and Quantitative
Analysis, 52(2), 519-551.
Cheng, Q., Farber, B.D. (2008). Earnings Restatements, Changes in CEO Compensation, and Firm Performance. The Accounting Review, 83(5), 1217-1250.
Cooper, M., Gulen, H., & Rau. P. (2016). Performance for pay? The relation between CEO incentive compensation and future stock price performance. Working paper. Core, E.J., Guay, R. W., Larcker. F. D. (2003). Executive Equity Compensation and Incentives: A Survey. Economic Policy Review, 9(1), 27-50.
Core, J., Holthausen R., & Larcker, D. (1999). Corporate governance, chief executive officer compensations, and firm performance. Journal of Financial Economics, 51, 371-406.
Denis, D.J., Hanouna, P., Sarin. A. (2006). Is there a dark side to incentive compensation? Journal of Corporate Finance, 12, 467-488.
29
Frye, B., M. (2004). Equity-Based compensation for Employees: Firm Performance and Determinants. The Journal of Financial Research, 27(1), 34-54.
Hall, B.J. (2000). What you need to know about stock options. Harvard Business
Review, 121-129.
Hall, B.J., & Liebman B. J. (1998). Are CEOs Paid Like Bureaucrats? The Quarterly
Journal of Economics, 113(3), 653-691.
Jensen, M., & Meckling, W. (1976). Theory of the Firm: Managerial behaviour, Agency Costs and Ownership Structure. Journal of Financial Economics, 3(4), 305-360.
Jensen, M., & Murphy, K. (1990a). Performance Pay and Top-Management Incentives.
Journal of political Economy. 98 (2), 225-264.
Jensen, M., & Murphy, K. (1990b). CEO incentives – its not how much you pay, but how. Harvard business review, 3, 138-153.
Kale, R. J., Reis, E., Venkateswaran, A. (2009). Rank-Order Tournaments and Incentive Alignment: The Effect on Firm Performance. The Journak of Finance, 64(3), 1479-1512. Kato, K., H., Lemmon, M., Luo, M., Schallheim, J. (2005). An empirical examination of the costs and benefits of executive stock options: Evidence from Japan. Journal of
Financial Economics, 78, 435-461.
Kuo, C.-S., Li, M.-Y. L., Yu, S.-E. (2013). Non-uniform effects of CEO equity-based compensation on firm performance – An application of a panel threshold regression model. The British Accounting Review, 45, 203-214.
Lazear, P. E., Rosen, S. (1981). Rank-Order Tournaments as Optimum Labor Contracts.
The Journal of Political Economy, 89(5), 841-864.
Lewellen, W., Loderer, C., Martin, K., & Blum, G. (1992). Executive Compensation and the Performance of the Firm. Managerial and Decision economics, 13, 65-74.
Li, M.-Y. L., Yang, T.-H., Yu, S.-E. (2015). CEO Stock-Based Incentive Compensation and Firm Performance: A Quantile Regression Approach. Journal of International Financial
Management & Accounting, 26(1), 39–71.
Mehran, H. (1995). Executive compensation structure, ownership and firm performance. Journal of Financial Economics, 38 (2), 163-184.
Mehran, H., Khaksari, S., Tehranian, H. (2009). Determining CEO Compensation Structure. The International Journal of Finance, 21(1), 5006-5038.
Palia, D. (2001). The Endogeneity of Managerial Compensation in Firm Valuation: A Solution. The Review of Financial Studies, 14(3), 735-764.
Shleifer, A., & Vishny, R. (1997). A Survey of Corporate Governance. The Journal of
30
Tai, S., L. (2004). Firm Size, Performance and CEO Pay: Evidence from a Group of American Quality Companies. Total Quality Management, 15(1), 35-42.
White, H., 1980. A heteroskedasticity-consistent covariance matrix estimator and a direct test for heteroskedasticity. Econometrica, 48(4), 817–838.
Zhou, X. (2000). CEO Pay, Firm Size, and Corporate Performance: Evidence from Canada. The Canadian Journal of Economics, 33 (1), 213-231.