UNIVERSIDADE DA BEIRA INTERIOR
Ciências da Saúde
Coadministration of antiepileptic drugs and
P-glycoprotein inhibitors of flavonoid-type:
a strategy to overcome the drug
resistance in epilepsy
Ana Filipa da Silva Ferreira
Tese para obtenção do Grau de Doutor em
Ciências Farmacêuticas
(3º ciclo de estudos)
Orientador: Professor Doutor Gilberto Lourenço Alves
Coorientador: Professor Doutor Amílcar Celta Falcão Ramos Ferreira
iii The experimental work presented in this thesis was carried out at the Health Sciences Research Centre, Faculty of Health Sciences, University of Beira Interior (CICS-UBI) and at the Center for Neuroscience and Cell Biology (CNC), University of Coimbra, under the scientific supervision of Professor Gilberto Lourenço Alves and Professor Amílcar Celta Falcão Ramos Ferreira.
iv
v The work underlying the present thesis was supported by FCT - Foundation for Science and Technology, Lisbon, Portugal (SFRH/BD/84936/2012). This work was also supported by FEDER funds through the POCI - COMPETE 2020 - Operational Programme Competitiveness and Internationalisation in Axis I - Strengthening research, technological development and innovation (Project POCI-01-0145-FEDER-007491) and National Funds by FCT (Project UID/Multi /00709/2013).
vii
Aos meus Pais
Ao Edgar
ix
“Sabemos muito mais do que julgamos, podemos muito mais do
que imaginamos.”
xi
Agradecimentos
Terminada esta longa e árdua etapa resta-me registar os meus sinceros agradecimentos a todos aqueles que foram parte integrante deste caminho e que contribuíram para a sua finalização.
Ao Professor Gilberto Alves, meu orientador,
agradeço em primeiro lugar o convite que me endereçou para a realização deste trabalho de investigação com vista ao grau de Doutor. Gostaria ainda de salientar a minha sincera gratidão pelo notável contributo e orientação científica, fundamentais para a execução deste trabalho, pela constante dedicação, disponibilidade e ensinamentos transmitidos.
Ao Professor Amílcar Falcão, meu coorientador,
agradeço pela orientação científica, profissionalismo, e todo o conhecimento e recomendações transmitidas durante estes anos.
Ao Professor Márcio Rodrigues,
companheiro e apoio essencial desde o início deste trabalho. Agradeço a pronta disponibilidade e auxílio sempre que o meu desespero imperava sobre o resto. O seu contributo científico, partilha do saber e valiosos conselhos foram fundamentais.
À Professora Ana Fortuna,
agradeço o contributo científico, os ensinamentos e esclarecimentos científicos transmitidos que se revelaram de grande importância no decorrer deste projeto.
À Professora Adriana Santos,
agradeço a amabilidade e disponibilidade que sempre teve para comigo, bem como todo o entusiasmo, incentivo e saberes transmitidos.
Ao Centro de Investigação em Ciências da Saúde da Universidade da Beira Interior,
aos Professores, Investigadores, Colegas e Funcionários que tiveram um papel fundamental no desenrolar deste trabalho e cujo auxílio nas mais diversas vertentes foi essencial na sua concretização.
Aos Colegas do grupo de doutoramento,
A partilha de alegrias e frustrações, vitórias e fracassos foi essencial para tornar mais fácil esta longa jornada.
xii
Aos Amigos, aos de Sempre, e a todos Aqueles e Aquelas que se juntaram durante esta longa etapa. Fazem parte daquilo que sou e foram e serão sempre essenciais para tornar todos os caminhos menos sinuosos e todas as batalhas mais gratificantes.
Ao Edgar,
um agradecimento muito especial. Por estar sempre ao meu lado e por todo o Amor, Apoio e Suporte, fundamentais para seguir sempre em frente. Pela Confiança, Orgulho, Compreensão e Motivação constantes e por nunca me deixar desistir.
Aos meus Pais João Paulo e Lurdes,
pilares essenciais na minha vida. Obrigada pelo Amor, Confiança e Dedicação incondicional que sempre depositaram em mim, fulcrais para ultrapassar todas as adversidades e querer fazer sempre mais e melhor. Tudo o que sou a vocês vos devo. Obrigada por tudo!
xiii
xv
Table of contents
RESUMO ALARGADO ... xxi
ABSTRACT ... xxvii
LIST OF FIGURES ... xxxi
LIST OF TABLES ... xli LIST OF ABBREVIATIONS ... xlvii LIST OF PUBLICATIONS ... liii CHAPTER I: General Introduction ... 1
I.1. Epilepsy - Disease and pharmacological therapy ... 3
I.1.1. Historical background ... 5
I.1.2. Epidemiology and costs ... 6
I.1.3. Epilepsy and epileptic seizures ... 6
I.1.4. Therapeutic approaches ... 7
I.2. Pharmacoresistant Epilepsy - The concept of pharmacoresistance and P-glycoprotein . 13 I.2.1. Pharmacoresistant epilepsy ... 15
I.2.2. The pharmacoresistance phenomenon ... 16
I.2.2.1. P-glycoprotein ... 18
I.2.2.1.1. P-glycoprotein–mediated drug transport ... 20
I.2.2.2. P-glycoprotein inhibitors: an overview ... 23
I.3. Flavonoids as P-glycoprotein Inhibitors ... 29
I.3.1. Flavonoids ... 31
I.3.1.1. Flavonoids chemistry ... 32
I.3.1.1.1. Structure-activity relationship ... 38
I.3.1.2. Sources of flavonoids ... 41
I.3.1.3. Biological properties and flavonoid–P-glycoprotein interactions ... 41
I.3.1.3.1. Interactions of flavonoids with P-glycoprotein ... 44
I.3.1.3.1.1. Cell-based in vitro models ... 45
I.3.1.3.1.2. In vivo animal models ... 47
I.3.1.3.1.3. Clinical studies ... 50
I.4. Aims... 51
I.4.1. Aims of this thesis ... 53
CHAPTER II: Drug Analysis ... 55
II.1. General Considerations ... 57
xvi
II.2. Experimental - Liquid chromatographic assay based on microextraction by packed sorbent for therapeutic drug monitoring of carbamazepine, lamotrigine, oxcarbazepine, phenobarbital, phenytoin and the active metabolites carbamazepine-10,11-epoxide and
licarbazepine ... 61
II.2.1. Introduction ... 63
II.2.2. Material and methods ... 65
II.2.2.1. Materials and reagents ... 65
II.2.2.2. Stock solutions, calibrations standards and quality control samples ... 65
II.2.2.3. Apparatus and chromatographic conditions ... 66
II.2.2.4. Sample preparation and extraction ... 66
II.2.2.5. Method validation ... 67
II.2.2.6. Clinical application ... 68
II.2.3. Results and discussion ... 69
II.2.3.1. Development and optimization of chromatographic conditions ... 69
II.2.3.2. Optimization of sample preparation: MEPS conditions ... 71
II.2.3.3. Method validation ... 73
II.2.3.3.1. Selectivity ... 73
II.2.3.3.2. Calibration curves, LLOQs and LODs ... 73
II.2.3.3.3. Precision and accuracy ... 74
II.2.3.3.4. Recovery... 75
II.2.3.3.5. Stability... 76
II.2.3.3.6. Clinical application ... 77
II.2.4. Conclusion ... 79
II.3. Experimental - A new HPLC-DAD method for the quantification of carbamazepine, oxcarbazepine and their active metabolites in HepaRG cell culture samples ... 81
II.3.1. Introduction ... 83
II.3.2. Material and methods ... 85
II.3.2.1. Reagents and cells ... 85
II.3.2.2. Stock solutions, calibration standards and quality control samples ... 85
II.3.2.3. Apparatus and chromatographic conditions ... 86
II.3.2.4. Sample preparation and extraction ... 86
II.3.2.5. Method validation ... 86
II.3.2.5.1. Selectivity ... 86
II.3.2.5.2. Calibration curve ... 87
II.3.2.5.3. Lower limit of quantification ... 87
II.3.2.5.4. Precision and accuracy ... 87
II.3.2.5.5. Recovery... 88
II.3.2.5.6. Stability... 88
II.3.3. Results ... 88
xvii
II.3.3.1.1. Selectivity ... 89
II.3.3.1.2. Calibration curves and LLOQs ... 89
II.3.3.1.3. Precision and accuracy ... 90
II.3.3.1.4. Recovery ... 91
II.3.3.1.5. Stability ... 92
II.3.3.1.6. Method application ... 93
II.3.4. Discussion ... 94
II.3.5. Conclusion ... 96
II.4. Experimental - A rapid and sensitive HPLC-DAD assay to quantify lamotrigine, phenytoin and its main metabolite in samples of cultured HepaRG cells ... 97
II.4.1. Introduction ... 99
II.4.2. Experimental ... 100
II.4.2.1. Reagents and cells ... 100
II.4.2.2. Stock solutions, calibration standards and quality control samples ... 101
II.4.2.3. Apparatus and chromatographic conditions ... 101
II.4.2.4. Sample preparation and extraction ... 101
II.4.2.5. Method validation ... 102
II.4.2.5.1. Selectivity ... 102
II.4.2.5.2. Calibration curve ... 102
II.4.2.5.3. Limits of quantification ... 103
II.4.2.5.4. Precision and accuracy ... 103
II.4.2.5.5. Recovery ... 103
II.4.3. Results ... 103
II.4.3.1. Method validation ... 103
II.4.3.1.1. Selectivity ... 104
II.4.3.1.2. Calibration curves and LLOQs ... 104
II.4.3.1.3. Precision and accuracy ... 105
II.4.3.1.4. Recovery ... 106
II.4.4. Discussion ... 106
II.4.5. Conclusion ... 108
CHAPTER III: In Vitro Studies ... 109
III.1. General Considerations ... 111
III.1.1. In vitro assays ... 113
III.2. Experimental - Flavonoid compounds as reversing agents of the P-glycoprotein–mediated multidrug resistance: Focus on antiepileptic drugs ... 115
III.2.1. Introduction... 117
III.2.2. Material and methods ... 118
III.2.2.1. Compounds and reagents ... 118
III.2.2.2. Cell lines and culture conditions ... 119
xviii
III.2.2.4. Intracellular rhodamine 123 accumulation assays ... 119
III.2.2.4.1. Identification of flavonoid compounds as P-glycoprotein inhibitors ... 120
III.2.2.4.2. Identification of antiepileptic drugs/metabolites as inducers of P-glycoprotein activity ... 120
III.2.2.5. Intracellular antiepileptic drugs accumulation assays ... 120
III.2.2.5.1. Identification of antiepileptic drugs/metabolites as P-glycoprotein substrates ... 120
III.2.2.5.2. Effects of flavonoid compounds on the intracellular accumulation of antiepileptic drugs/metabolites ... 121
III.2.2.6. HPLC analysis ... 121
III.2.2.7. Statistical analysis ... 122
III.2.3. Results ... 122
III.2.3.1. Cytotoxicity assays ... 122
III.2.3.2. Identification of flavonoid compounds as P-glycoprotein inhibitors ... 126
III.2.3.3. Identification of antiepileptic drugs/metabolites as inducers of P-glycoprotein activity... 127
III.2.3.4. Identification of antiepileptic drugs/metabolites as P-glycoprotein substrates . 128 III.2.3.5. Effects of flavonoid compounds on the intracellular accumulation of antiepileptic drugs/metabolites ... 129
III.2.4. Discussion ... 129
III.3. Experimental - Synergic effects of dual flavonoid combinations for reversing P-glycoprotein–mediated multidrug resistance: focus on phenytoin, carbamazepine, oxcarbazepine and their active metabolites ... 135
III.3.1. Introduction ... 137
III.3.2. Experimental section ... 138
III.3.2.1. Reagents ... 138
III.3.2.2. Cell culture ... 139
III.3.2.3. Rhodamine 123 accumulation assays ... 139
III.3.2.3.1. Concentration-response curves for individual flavonoids in the intracellular accumulation of rhodamine 123 ... 140
III.3.2.3.2. Concentration-response curves for dual combinations of flavonoids in the intracellular accumulation of rhodamine 123. ... 140
III.3.2.4. Antiepileptic drugs accumulation assays ... 140
III.3.2.4.1. Effects of the most promising flavonoid combinations on the intracellular accumulation of antiepileptic drugs/metabolites ... 140
III.3.2.4.2. MDCK-MDR1 monolayer permeability assays to licarbazepine ... 141
III.3.2.5. HPLC analysis ... 142
III.3.2.6. Statistical analysis ... 143
xix
III.3.3.1. Flavonoid combinations increase the intracellular accumulation of the
P-glycoprotein probe substrate rhodamine 123 ... 143
III.3.3.2. Flavonoid combinations increase the intracellular accumulation of antiepileptic drugs ... 147
III.3.3.3. Licarbazepine drug transport experiments in MDCK-MDR1 cells ... 149
III.3.4. Conclusions ... 151
CHAPTER IV:In Vivo Studies ... 153
IV.1. General Considerations ... 155
IV.1.1. In vivo assays ... 157
IV.2. Experimental - Impact of silymarin, a flavonoid-type P-glycoprotein inhibitor, on the pharmacokinetics of carbamazepine, oxcarbazepine and phenytoin in rats ... 159
IV.2.1. Introduction ... 161
IV.2.2. Material and methods ... 163
IV.2.2.1. Materials and methods ... 163
IV.2.2.2. Animals ... 164
IV.2.2.3. Systemic pharmacokinetic studies ... 164
IV.2.2.4. Plasma-to-brain distribution study ... 165
IV.2.2.5. Bioanalytical method validation ... 165
IV.2.2.6. Drug analysis ... 166
IV.2.2.7. Pharmacokinetic analysis ... 167
IV.2.2.8. Statistical analysis ... 167
IV.2.3. Results ... 167
IV.2.3.1. Bioanalytical method validation ... 167
IV.2.3.2. Effects of silymarin on the systemic pharmacokinetics of antiepileptic drugs ... 170
IV.2.3.2.1. Effects of silymarin on the pharmacokinetics of carbamazepine ... 170
IV.2.3.2.2. Effects of silymarin on the pharmacokinetics of oxcarbazepine ... 172
IV.2.3.2.3. Effects of silymarin on the pharmacokinetics of phenytoin ... 175
IV.2.3.3. Effects of silymarin on plasma-to-brain distribution of oxcarbazepine and its main metabolite ... 175
IV.2.4. Discussion ... 176
IV.2.5. Conclusions ... 180
IV.3. Experimental- Influence of the dual combination of silymarin and (-)-epigallocatechin gallate, natural dietary flavonoids, on the pharmacokinetics of oxcarbazepine in rats .. 181
IV.3.1. Introduction ... 183
IV.3.2. Materials and methods ... 185
IV.3.2.1. Drugs and materials ... 185
IV.3.2.2. Animals ... 185
IV.3.2.3. Systemic pharmacokinetic study ... 186
IV.3.2.4. Plasma-to-brain biodistribution study ... 186
xx
IV.3.2.6. Drug analysis ... 188
IV.3.2.6.1. Pharmacokinetic analysis ... 188
IV.3.2.7. Pharmacokinetic analysis ... 189
IV.3.3. Results ... 189
IV.3.3.1. Bioanalytical method validation ... 189
IV.3.3.2. Effects of silymarin, (-)-EPG and their combinations on the systemic pharmacokinetics of OXC ... 189
IV.3.3.3. Effects of silymarin and (-)-EPG combinations on the OXC and LIC plasma-to-brain biodistribution ... 194
IV.3.4. Discussion ... 195
IV.3.5. Conclusions ... 197
CHAPTER V: General Discussion ... 199
V.1. General discussion ... 201
CHAPTER VI:Conclusions & Future Perspectives ... 209
VI.1. Conclusions & future perspectives ... 211
APPENDICES ... 215
Appendix A ... 217
Appendix B ... 235
REFERENCES... 241
SUPPLEMENT: Isobolographic analysis of the neuro and hepatotoxic profile resulting from the combination of carbamazepine, oxcarbazepine or phenytoin with the flavonoid silymarin ... 283
xxi
xxiii
Resumo alargado
A epilepsia é uma das doenças neurológicas crónicas mais comuns e tem um grande impacto negativo na qualidade de vida dos doentes, sendo de extrema importância os esforços continuados para desenvolver novos fármacos antiepiléticos e novas abordagens terapêuticas. Contudo, apesar dos avanços significativos alcançados nos últimos anos, os fenómenos de farmacorresistência associados aos fármacos antiepiléticos são provavelmente um dos principais problemas no que diz respeito à terapêutica da epilepsia, afetando 30-40% dos doentes. De facto, esta situação tem proporcionado um ímpeto crescente para o desenvolvimento de abordagens terapêuticas inovadoras e mais eficazes. A sobreexpressão de transportadores de efluxo de fármacos, como a glicoproteína-P (P-gp), ao nível da barreira hematoencefálica, tem sido sugerida como um dos principais mecanismos subjacentes à epilepsia refratária. Desta forma, vários esforços têm sido realizados no sentido de descobrir e desenvolver inibidores da P-gp que sejam úteis de um ponto de vista terapêutico. No entanto, as múltiplas desvantagens apresentadas pelas primeiras gerações de inibidores da P-gp demonstraram a necessidade de encontrar agentes mais potentes e mais seguros, tendo sido dado um ênfase especial nos últimos anos a compostos flavonoides. Além do seu interesse potencial como inibidores da P-gp, uma panóplia de outras propriedades farmacológicas importantes têm sido atribuídas a estes compostos fitoquímicos, entre as quais, por exemplo, efeitos anti-inflamatórios, antioxidantes, antitumorais, antimicrobianos, antivirais, hormonais e, mesmo, anticonvulsivantes.
Tendo em consideração todos estes aspetos, a presente tese teve como principal objetivo realizar uma avaliação abrangente, in vitro e in vivo, do papel potencial dos flavonoides como inibidores da P-gp, e também explorar uma estratégia de terapia combinada de flavonoides/fármacos antiepiléticos como possível abordagem para superar a farmacorresistência verificada na epilepsia.
Este projeto envolveu o desenvolvimento e validação de técnicas bioanalíticas apropriadas e fiáveis para apoiar a execução dos estudos pretendidos. Neste contexto, métodos de cromatografia líquida de alta eficiência acoplados à deteção por fotodíodos (HPLC-DAD) foram devidamente desenvolvidos e validados para a quantificação dos fármacos antiepiléticos alvo de interesse e de alguns dos seus principais metabolitos em amostras de cultura celular e em matrizes de plasma e cérebro de rato. Uma técnica adicional de HPLC-DAD foi também desenvolvida para a quantificação de vários fármacos antiepiléticos e metabolitos em plasma humano, constituindo uma ferramenta útil para apoiar a monitorização terapêutica destes fármacos na prática clínica.
De acordo com os resultados obtidos num conjunto de ensaios in vitro, cinco dos onze flavonoides testados, nomeadamente, a baicaleína, a (-)-epigalocatequina galato [(-)-EPG], o kaempferol, a quercetina e a silimarina demonstraram ter um potencial interessante na inibição
xxiv
da atividade da P-gp. Estes flavonoides promoveram também um aumento significativo da acumulação intracelular dos fármacos antiepiléticos carbamazepina (CBZ), oxcarbazepina (OXC) e fenitoína (PHT), e dos seus metabolitos ativos carbamazepina-10,11-epóxido (CBZ-E) e licarbazepina (LIC), na linha celular Madin-Darby canine kidney, transfetada com o
gene de resistência a múltiplos fármacos 1 (MDR1) que codifica para a P-gp humana (MDCK-MRD1), evidenciando-se como candidatos promissores para reverter a resistência associada aos fármacos antiepiléticos. Além disso, com exceção da lamotrigina (LTG), todos os fármacos antiepiléticos testados (CBZ, PHT e OXC), assim como os seus respetivos metabolitos ativos (CBZ-E e LIC), demonstraram ser substratos da P-gp neste modelo celular. Adicionalmente, a CBZ, CBZ-E, LIC, LTG, OXC e PHT promoveram uma diminuição significativa nas concentrações intracelulares de rodamina 123 (um substrato “sonda” clássico da P-gp), o que sugere um efeito indutor, mediado pelos próprios fármacos e metabolitos, da atividade funcional da P-gp. Reconhecendo-se as várias propriedades biológicas atribuídas aos flavonoides e tendo-se em consideração que misturas complexas de flavonoides são consumidas diariamente na nossa dieta, não se poderá ignorar o seu potencial farmacológico sinérgico. Neste sentido, foi concretizada uma avaliação dos potenciais efeitos sinérgicos da baicaleína, (-)-EPG, kaempferol, quercetina e silimarina relativamente à inibição da P-gp, primeiro in vitro e depois
in vivo. Na verdade, comparativamente aos resultados individuais obtidos, algumas
combinações duais de flavonoides apresentaram um potencial acrescido para inibição da P-gp
in vitro. Além disso, algumas dessas combinações, nomeadamente (-)-EPG/silimarina e
kaempferol/baicaleína, proporcionaram um aumento substancial da acumulação intracelular de CBZ, OXC e PHT, bem como dos seus metabolitos CBZ-E e LIC, na linha celular MDCK-MDR1, sendo estes efeitos comparáveis aos obtidos com o verapamilo, inibidor de referência da P-gp. Assim, enquanto os flavonoides baicaleína, (-)-EPG, kaempferol, quercetina e silimarina testados individualmente aumentaram em 1,2 a 31 vezes a acumulação intracelular dos fármacos antiepiléticos e metabolitos ativos considerados nas células MDCK-MDR1, as combinações duais desses flavonoides permitiram alcançar aumentos de cerca de 1,5 a 76 vezes. Adicionalmente, o efeito da combinação da (-)-EPG com a silimarina foi também avaliado em ensaios de transporte com a LIC (substrato da P-gp) através de uma monocamada de células MDCK-MDR1 montadas em câmaras de Ussing; como esperado, esta combinação aumentou o coeficiente de permeabilidade aparente da LIC.
Em geral, os resultados dos estudos in vitro foram suportados pelos resultados dos estudos in
vivo. De facto, após pré-tratamento de ratos Wistar machos com silimarina observou-se um
aumento nas concentrações plasmáticas dos fármacos antiepiléticos alvo (CBZ, OXC e PHT). No entanto, é de ressaltar que os principais efeitos induzidos pela silimarina foram notados na farmacocinética da OXC, para a qual foi observado um aumento estatisticamente significativo na sua concentração plasmática máxima (50%) e na sua extensão de exposição sistémica (41%), tendo tais efeitos um impacto direto nas concentrações farmacológicas alcançadas no cérebro. Por outro lado, o uso de combinações duais de (-)-EPG/silimarina na inibição da atividade da P-gp foi também avaliado in vivo em ratos Wistar, sendo evidente o potencial sinérgico destes
xxv
dois flavonoides no aumento do grau de exposição sistémica à OXC e LIC (metabolito farmacologicamente ativo da OXC), o que ocorreu numa extensão comparável à observada para o verapamilo (controlo positivo). De facto, o pré-tratamento de ratos Wistar com combinações de silimarina/(-)-EPG originou concentrações plasmáticas máximas de OXC semelhantes àquelas obtidas na presença do verapamilo. Além disso, os efeitos promovidos pelas combinações de silimarina/(-)-EPG no que diz respeito à magnitude da exposição sistémica ao fármaco foram também refletidos nos níveis de OXC e LIC alcançados no cérebro (biofase).
Assim, de acordo com os nossos resultados, a terapia combinada de flavonoides/fármacos antiepiléticos pode ser considerada como uma abordagem promissora que deve continuar a ser explorada no sentido de superar a farmacorresistência mediada pela P-gp. A disponibilidade desta informação resultante de ensaios in vitro e in vivo contribui também para apoiar a hipótese do envolvimento de transportadores de efluxo, em particular da P-gp, na condição de epilepsia farmacorresistente. Considerando todo o seu potencial intrínseco e propriedades biológicas indiscutíveis, os compostos de tipo flavonoide podem então emergir como uma alternativa aos inibidores da P-gp disponíveis para um tratamento prospetivo dos doentes com epilepsia refratária.
Palavras-Chave
Ensaios in vitro, Epilepsia, Fármacos antiepiléticos, Farmacocinética, Farmacorresistência, Flavonoides, Glicoproteína-P, Rato
xxvii
xxix
Abstract
The resistance to antiepileptic drugs (AEDs) remains a major unsolved therapeutic problem, which affects 30-40% of patients with epilepsy. The overexpression of multidrug efflux transporters, as the P-glycoprotein (P-gp), at the level of the blood-brain barrier of epileptic patients has been suggested as a key mechanism underlying the refractory epilepsy. Bearing this in mind, efforts have been made to search for therapeutically useful P-gp inhibitors. In an attempt to find potent and safer P-gp inhibitor drugs, a particular emphasis has been given to flavonoid compounds. Actually, apart from their potential value as P-gp inhibitors, these phytochemical compounds have been recognised as having a panoply of important pharmacological properties like anti-inflammatory, antioxidant, antitumoral, antimicrobial, antiviral, hormonal and even anticonvulsant effects. Taking this into account, the purpose of the present thesis was to conduct a comprehensive in vitro and in vivo evaluation of the potential of flavonoids as P-gp inhibitors, but also to explore a strategy of flavonoid/AED combined therapy as a possible approach to overcome the P-gp–mediated pharmacoresistance in epilepsy.
This project involved the development and validation of appropriate and reliable bioanalytical techniques to support the accomplishment of the intended studies. Thus, high-performance liquid chromatography methods coupled with diode array detection (HPLC-DAD) were properly validated for the quantification of the target AEDs and some of their main metabolites in cell culture samples and in rat plasma and brain matrices. An additional HPLC-DAD technique was also developed to quantify several AEDs and metabolites in human plasma, which has shown to be a useful tool for the therapeutic drug monitoring in the clinical practice.
According to the results of a set of in vitro assays, five out of eleven flavonoids tested, namely baicalein, (-)-epigallocatechin gallate [(-)-EPG], kaempferol, quercetin and silymarin demonstrated to have an interesting potential in inhibiting the P-gp activity. These promising flavonoids also promoted a significant increase in the intracellular accumulation of the AEDs carbamazepine (CBZ), oxcarbazepine (OXC) and phenytoin (PHT) and their active metabolites carbamazepine-10,11-epoxide (CBZ-E) and licarbazepine (LIC) in the Madin-Darby canine kidney cell line transfected with the human multidrug resistance-1 gene which encodes the human P-gp (MDCK-MRD1), showing up as important drug candidates to overcome the AED-resistance. Actually, excluding LTG, all the AEDs tested (CBZ, OXC and PHT) as well as their active metabolites (CBZ-E and LIC) were found to be P-gp substrates in the MDCK-MDR1 cells. Additionally, CBZ, CBZ-E, LIC, LTG, OXC and PHT promoted a statistically significant decrease of the intracellular concentration of rhodamine 123 (a classic P-gp probe substrate), suggesting an inducer effect on the functional activity of P-gp.
An assessment of the potential synergic effects of baicalein, (-)-EPG, kaempferol, quercetin and silymarin on the P-gp inhibition was also performed, firstly in in vitro conditions and then
xxx
in in vivo experiments. Indeed, when compared to their individual activity, some dual flavonoid combinations exhibited an increased potential in inhibiting the P-gp in the in vitro assays. Moreover, the dual combinations of (-)-EPG/silymarin and kaempferol/baicalein demonstrated a great potential in enhancing the intracellular accumulation of CBZ, OXC and PHT and their metabolites CBZ-E and LIC in the MDCK-MDR1 cells and such effects were comparable to those
promoted by verapamil (the standard P-gp inhibitor). The effect of the combination of (-)-EPG/silymarin was also tested in transport assays of LIC (P-gp substrate) through
MDCK-MDR1 cells mounted in Ussing chambers; as expected, this combination of flavonoids increased the apparent permeability coefficient of LIC.
Overall, these in vitro findings were further supported by in vivo results. In fact, after the pretreatment of male Wistar rats with silymarin an increasing in the plasma concentrations of the studied AEDs (CBZ, OXC and PHT)was observed. Nevertheless, it should be highlighted that the main effects induced by silymarin were found on the OXC pharmacokinetics, for which was found a statistically significant increase in the peak plasma concentration (50%) and in the extent of systemic exposure (41%), having a direct impact on the drug concentrations reached in the brain. On the other hand, the use of dual combinations of (-)-EPG/silymarin on the inhibition of the activity of P-gp was also evaluated in vivo in Wistar rats, being noticeable the synergic potential of (-)-EPG/silymarin combinations in enhancing the degree of systemic exposure to OXC and LIC (a pharmacologically active metabolite of OXC), and it occurred in a comparable extent to that observed for verapamil (positive control). Indeed, the pretreatment of male Wistar rats with dual silymarin/(-)-EPG combinations originated peak plasma concentrations of OXC similar to those achieved in the presence of verapamil. Moreover, the effects promoted by silymarin/(-)-EPG combinations on the magnitude of systemic drug exposure were also reflected in the corresponding drug levels attained in the brain (biophase). Hence, according to our findings, it seems that the flavonoid/AED combined therapy can be thought as a promising approach that should continue to be exploited in order to overcome the P-gp–mediated pharmacoresistance. The availability of this in vitro and in vivo information also adds support to the efflux transporter hypothesis in explaining the pharmacoresistant epilepsy. Considering all its intrinsic potential and indisputable properties, the flavonoid-type compounds may emerge as an alternative to the available P-gp inhibitors for a prospective management of patients with drug-refractory epilepsy.
Keywords
Antiepileptic drugs, Epilepsy, Flavonoids, In vitro assays, P-glycoprotein, Pharmacokinetics, Pharmacoresistance, Rat
xxxi
xxxiii
List of figures
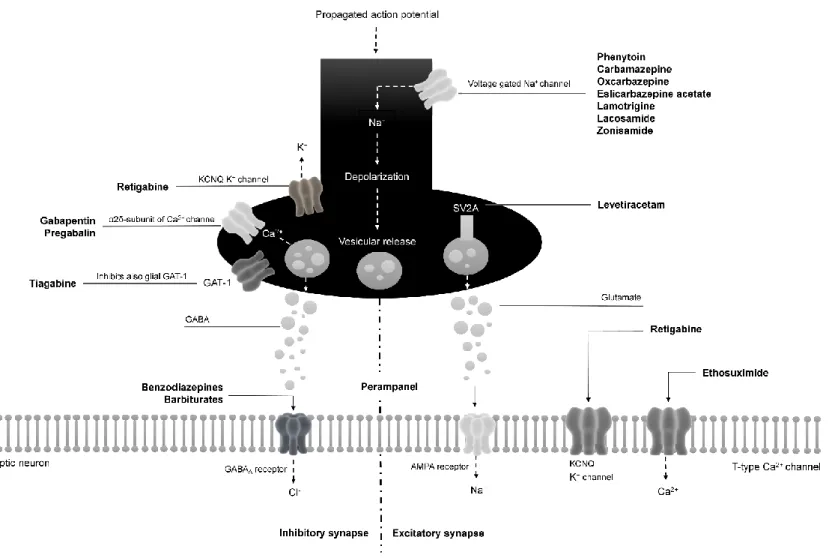
Figure I.1.1 Mechanisms of action of antiepileptic drugs at excitatory and inhibitory synapses. AMPA, α-amino-3-hydroxy-5-methyl-4-isoxazole-propionic acid; GABA, -aminobutyric acid; GAT-1, sodium- and chloride-dependent GABA transporter 1; SV2A, synaptic vesicle glycoprotein 2A. 10
Figure I.2.1 Structure of P-glycoprotein (C, COOH; NBD, nucleotide-binding domain; N, NH2; TMD, transmembrane domain). 20
Figure I.2.2 Models proposed to explain the P-glycoprotein function: the pore (a), the flippase (b) and the hydrophobic vacuum cleaner model (c). 21
Figure I.2.3 Chemical structure of some P-glycoprotein inhibitors belonging to the first-, second- and third-generation. 26
Figure I.3.1 Basic chemical structure of flavonoids. 31
Figure I.3.2 Chemical structures of the compounds belonging to the anthocyanidines subgroup of flavonoids and their glycosides (anthocyanins). 33
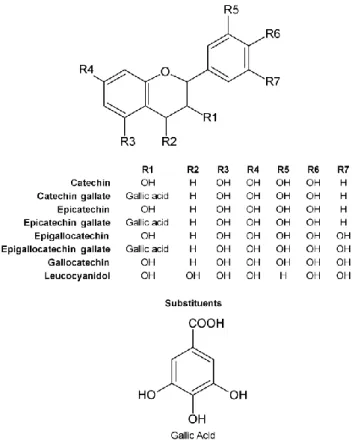
Figure I.3.3 Chemical structures of the compounds belonging to the flavanols or
catechins subgroup of flavonoids. 34
Figure I.3.4 Chemical structures of the compounds belonging to the flavanones subgroup of flavonoids and their glycosides. 35
Figure I.3.5 Chemical structures of the compounds belonging to the flavones subgroup of flavonoids and their glycosides. 36
Figure I.3.6 Chemical structures of the compounds belonging to the flavonols subgroup of flavonoids and their glycosides. 37
Figure I.3.7 Chemical structures of the compounds belonging to the isoflavones subgroup of flavonoids and their glycosides. 38
Figure I.3.8 Structure-activity relationship of flavonoids (NBD, nucleotide-binding
domain; P-gp, P-glycoprotein). 39
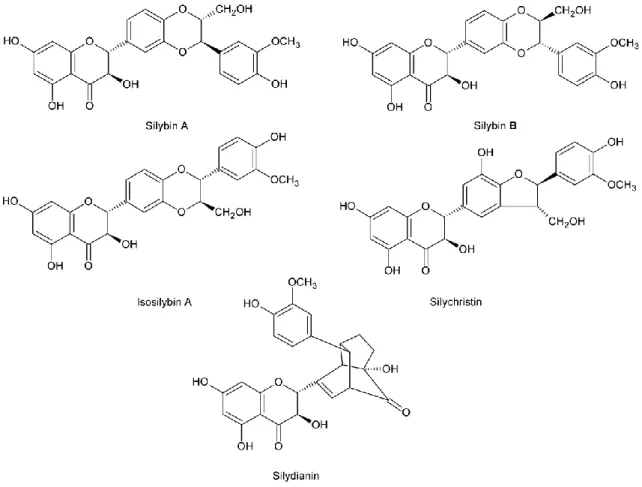
Figure I.3.9 Some constituents of the flavonoid silymarin. 49
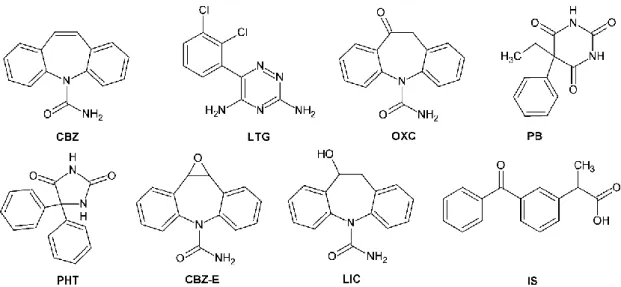
Figure II.2.1 Chemical structures of carbamazepine (CBZ), lamotrigine (LTG),
oxcarbazepine (OXC), phenobarbital (PB), phenytoin (PHT), carbamazepine-10,11-epoxide (CBZ-E), licarbazepine (LIC) and ketoprofen which was used as internal standard (IS). 64
xxxiv
Figure II.2.2 Typical chromatograms of extracted human plasma samples obtained by
the MEPS/HPLC-DAD assay developed: blank plasma at 215 nm (a1), at 237 nm (a2) and at 280 nm (a3); and plasma spiked with internal standard (IS) and the analytes at concentrations of the lower limit of quantification at 215 nm (b1), at 237 nm (b2) and at 280 nm (b3). CBZ, carbamazepine; LTG, lamotrigine; OXC, oxcarbazepine; PB, phenobarbital; PHT phenytoin; CBZ-E, carbamazepine-10,11-epoxide;
LIC, licarbazepine. 70
Figure II.2.3 Representative chromatograms of the analysis of real plasma samples
obtained from patients treated with oxcarbazepine (ID4; a1, a2 and a3); lamotrigine (ID9; b1 and b2); carbamazepine and phenytoin (ID12; c1 and c2); and carbamazepine and phenobarbital (ID13; d1 and d2). CBZ, carbamazepine; LTG, lamotrigine; OXC, oxcarbazepine; PB, phenobarbital; PHT, phenytoin; CBZ-E, carbamazepine-10,11-epoxide; LIC, licarbazepine; IS, internal standard. 78
Figure II.3.1 Metabolic pathways of carbamazepine (CBZ) and oxcarbazepine (OXC)
to their active metabolites carbamazepine-10,11-epoxide (CBZ-E) and licarbazepine (LIC), respectively. 84
Figure II.3.2 Typical chromatograms of extracted supplemented Williams’ E medium
samples generated by the HPLC-DAD assay developed: blank supplemented Williams’ E medium (a); supplemented Williams’ E medium spiked with internal standard (IS) and the analytes at concentrations of the lower limit of quantification (b); and supplemented Williams’ E medium spiked with IS and the analytes at intermediate concentrations of the calibration ranges (c). CBZ, carbamazepine; CBZ-E, carbamazepine-10,11-epoxide; PRM, Primidone; LIC, licarbazepine; OXC, oxcarbazepine. 89
Figure II.3.3 Concentration-time profiles for the metabolism of OXC in its active
metabolite LIC after 2, 4, 6, 12 and 24 h of incubation of the parent drug (OXC) at 2.5 μg/mL in differentiated HepaRG cells (a); and a representative chromatogram of the analysis of a real sample obtained after 6 h of incubation of OXC (2.5 μg/mL) in the differentiated HepaRG cells (b). OXC, oxcarbazepine; LIC, licarbazepine; PRM, Primidone. 93
Figure II.4.1 Chemical structures of 5-(4-hydroxyphenyl)-5-phenylhydantoin (HPPH),
phenytoin (PHT), lamotrigine (LTG) and carbamazepine which was used
xxxv Figure II.4.2 Typical chromatograms of extracted supplemented Williams’ E medium
samples obtained by the HPLC-DAD assay developed: supplemented Williams’ E medium at 215 nm (a1) and 235 nm (a2) and supplemented Williams’ E medium spiked with the analytes at the lower limit of quantification of the calibration ranges at 215 nm (b1) and 235 nm (b2). HPPH, 5-(4-hydroxyphenyl)-5-phenylhydantoin; IS, internal standard;
LTG, lamotrigine; PHT phenytoin. 104
Figure III.2.1 Cell viability data for flavonoids or verapamil together with 5 µM
rhodamine 123 (Rh123) after 4 h of incubation in MDCK-MDR1 cells. Data are expressed as the mean ± standard error of the mean (n = 6). Comparisons between treated cells vs. untreated control cells were
performed by one-way ANOVA with the post hoc Dunnett’s test (*p < 0.05). (-)-EPG, (-)-epigallocatechin gallate. 123
Figure III.2.2 Cell viability data for antiepileptic drugs (or metabolites) together with
5 µM rhodamine 123 (Rh123) after 4 h of incubation in MDCK-MDR1 cells. Data are expressed as the mean values ± standard error of the mean (n = 6). Comparisons between treated cells vs. untreated control cells
were performed by one-way ANOVA with the post hoc Dunnett’s test (*p < 0.05). Comparisons among the data obtained for the three
different tested concentrations of lamotrigine (LTG) and oxcarbazepine (OXC) were also carried out by one-way ANOVA with the post hoc Tukey’s test (p > 0.05, no statistically significant differences were found). CBZ, carbamazepine; CBZ-E, carbamazepine-10,11-epoxide; LIC, licarbazepine; PHT, phenytoin. 124
Figure III.2.3 Cell viability data for antiepileptic drugs (or metabolites) alone and
together with verapamil or flavonoids after 4 h of incubation in MDCK-MDR1 cells. Data are expressed as the mean values ± standard error of the mean (n = 6). Comparisons between treated cells vs. untreated control cells were performed by one-way ANOVA with the post hoc Dunnett’s test (*p < 0.05). CBZ, carbamazepine; CBZ-E, carbamazepine-10,11-epoxide; (-)-EPG, (-)-epigallocatechin gallate; LIC, licarbazepine; LTG, lamotrigine; OXC, oxcarbazepine; PHT, phenytoin. 125
xxxvi
Figure III.2.4 Effect of flavonoids on the intracellular accumulation of rhodamine 123
(Rh123) in MDCK-MDR1 cells. The results were obtained by comparing the flavonoid (or verapamil) pretreated cells vs. untreated cells (control). Data are expressed as the mean values ± standard error of the mean (n = 6). The basal intracellular accumulation of Rh123 in the control group was 0.0097 ± 0.0026 µM. Comparisons between flavonoids/verapamil group vs. control group were performed by one-way ANOVA with the post hoc Dunnett’s test (*p < 0.05). Comparisons among the different concentrations of flavonoids were performed by one-way ANOVA with the post hoc Tukey’s test (#p < 0.05). (-)-EPG,
(-)-epigallocatechin gallate. 126
Figure III.2.5 Identification of P-glycoprotein inducers among the antiepileptic’s/metabolites through rhodamine 123 (Rh123) accumulation assays performed in MDCK-MDR1 cells. The results were obtained by comparing the intracellular Rh123 accumulation in antiepileptic drugs (AEDs) or metabolites pretreated cells vs. untreated cells (control). Data are expressed as the mean values ± standard error of the mean (n = 6). The basal intracellular accumulation of Rh123 in the control group was 0.0091 ± 0.0016 µM. Comparisons between AEDs/metabolite group vs. control group were performed by one-way ANOVA with the post hoc Dunnett’s test (*p < 0.05). Comparisons among the different concentrations of AEDs/metabolites were performed by one-way ANOVA with the post hoc Tukey’s test (#p < 0.05). CBZ,
carbamazepine; CBZ-E, carbamazepine-10,11-epoxide; (-)-EPG, (-)-epigallocatechin gallate; LIC, licarbazepine; LTG, lamotrigine; OXC,
oxcarbazepine; PHT, phenytoin. 127
Figure III.2.6 Comparison of the intracellular accumulation of antiepileptic
drugs/metabolites between MDCK II and MDCK-MDR1 cells. Data are expressed as the mean values ± standard error of the mean (n = 3). Comparisons between MDCK II vs. MDCK-MDR1 group were performed by Student's t-test. *p < 0.05, compared to control group (MDCK II cell line). 128
xxxvii Figure III.2.7 Effect of selected flavonoid compounds or verapamil in the intracellular
accumulation of antiepileptic drugs/metabolites in MDCK-MDR1 cells. Data are expressed as the mean values ± standard error of the mean (n = 3). Comparisons between flavonoids and verapamil groups vs. control (basal drug accumulation) group were performed by one-way ANOVA with the post hoc Dunnett’s test. *p < 0.05, compared to control group. CBZ, carbamazepine; CBZ-E, carbamazepine-10,11-epoxide; (-)-EPG, (-)-epigallocatechin gallate; LIC, licarbazepine; LTG, lamotrigine; OXC, oxcarbazepine; PHT, phenytoin. 131
Figure III.3.1 Chemical structures of baicalein, (-)-epigallocatechin gallate,
kaempferol and quercetin and of some constituents of the flavonoid
silymarin. 139
Figure III.3.2 Concentration-response curves of the effects of individual (A) or
combined flavonoids (B to K) on the intracellular accumulation of rhodamine 123 (Rh123) in MDCK-MDR1 cells. The results were obtained by comparing the results obtained with flavonoid-pretreated
MDCK-MDR1 cells vs. non-pretreated cells (control). (-)-EPG, (-)-epigallocatechin gallate. Data are expressed as the mean values ±
standard error of the mean (n = 6). 145
Figure III.3.3 Effect of selected flavonoid combinations in the accumulation of
antiepileptic drugs or metabolites in MDCK-MDR1 cells. The combination of kaempferol and baicalein was tested in the proportion of 1:3 regarding their EC50 value with a final concentration of 350 µM (167 µM
of kaempferol and 183 µM of baicalein), whereas the combination of (-)-epigallocatechin gallate [(-)-EPG] and silymarin was tested in the
proportion of 1:1 with a final concentration of 698 µM [198 µM of (-)-EPG and 500 µM of silymarin]. Data are expressed as the mean values
± standard error of the mean (n = 3). Comparisons between flavonoid combinations/verapamil group vs. control group were performed by one-way ANOVA with the post hoc Dunnett’s test (*p < 0.05). Comparisons between flavonoid combinations/verapamil groups were performed by one-way ANOVA with the post hoc Bonferroni’s test
xxxviii
Figure III.3.4 A: Time course of the apparent permeability (LnPapp) coefficients
considering absorption direction [apical (A)-to-basolateral (B)] of licarbazepine 140 µM in the presence and absence of the flavonoid combination [198 µM of (-)-EPG and 500 µM of silymarin] and LnPapp
considering efflux direction (B-A) of licarbazepine 140 µM. Each value represents mean ± standard error of the mean (n = 3), and B: Representation of transepithelial electrical resistance (TEER) values plotted against the LnPapp coefficients of licarbazepine 140 µM resulting
from the study presented in A. Comparisons between the groups were performed by two-way ANOVA with the post hoc Bonferroni’s test.
#p < 0.05, compared to A-B control group. 150
Figure IV.2.1 Chemical structures of some constituents of the flavonoid silymarin
(silybinin, silychristin and silydianin). 162
Figure IV.2.2 Chemical structures of the antiepileptic drugs (AEDs) carbamazepine
(CBZ), oxcarbazepine (OXC) and phenytoin (PHT), and of their metabolites carbamazepine-10,11-epoxide (CBZ-E), licarbazepine (LIC) and 5-(4-hydroxyphenyl)-5-phenylhydantoin (HPPH). 163
Figure IV.2.3 Mean plasma concentration-time profiles of antiepileptic drugs and their
respective main metabolites: A, carbamazepine (CBZ); B, carbamazepine-10,11-epoxide (CBZ-E); C, oxcarbazepine (OXC); D, licarbazepine (LIC); E, phenytoin (PHT); and F, 5-(4-hydroxyphenyl)-5-phenylhydantoin (HPPH), over a 6-h period in rats pretreated with silymarin (25 mg/kg), verapamil (25 mg/kg) or vehicle 1 h before the intraperitoneal administration of CBZ (25 mg/kg), OXC (50 mg/kg) or PHT (100 mg/kg). Symbols represent the mean values ± standard error of the mean (SEM) of six determinations per time point (n = 6). Comparisons between vehicle (negative control) group vs silymarin and verapamil (positive control) groups were performed by Student's t-test. *p < 0.05 and #p < 0.001, compared to vehicle group. 171 Figure IV.2.4 Mean plasma and brain concentrations of oxcarbazepine (OXC) and its
active metabolite licarbazepine (LIC) obtained at 1.5 h post intraperitoneal OXC administration (50 mg/kg) in rats pretreated with silymarin (25 mg/kg), verapamil (25 mg/kg) or the vehicle of these compounds. Data are expressed as the mean values ± standard error of the mean (SEM) of three determinations (n = 3). Comparisons between vehicle (negative control) group vs silymarin and verapamil (positive
control) groups were performed by Student's t-test, *p < 0.05 and
xxxix Figure IV.3.1 Chemical structures of oxcarbazepine and its active metabolite
licarbazepine, the flavonoid (-)-epigallocatechin gallate and some constituents of silymarin (silybinin, silychristin and silydianin). 184
Figure IV.3.2 Mean plasma concentration-time profiles of oxcarbazepine (A) and its
active metabolite licarbazepine (B) obtained, over a 12-h period, in rats pretreated with silymarin (25 mg/kg; S), (-)-EPG (25 mg/kg; E), silymarin/(-)-EPG 1:1 (12.5/12.5 mg/kg; fixed-ratio combination of 1:1), silymarin/(-)-EPG 1:3 (6.25/18.75 mg/kg; fixed-ratio combination of 1:3), silymarin/(-)-EPG 3:1 (18.75/6.25 mg/kg; fixed-ratio combination of 3:1), or verapamil (25 mg/kg) 1 h before the intraperitoneal administration of oxcarbazepine (50 mg/kg). The dashed line represents the data of a vehicle control group from previous experiments (rats pretreated with the corresponding volume of the compound’s vehicle instead of flavonoids or verapamil formulations). Data are expressed as the mean values ± standard error of the mean (SEM) of six determinations (n = 6). Comparisons between the verapamil (positive control) group vs experimental groups were performed using one-way ANOVA with the post hoc Dunnett’s test. Above each time point is mentioned which groups have statistically significant differences in relation to the verapamil group (p < 0.05). 190
Figure IV.3.3 Mean plasma and brain tissue concentrations of oxcarbazepine and its
active metabolite licarbazepine obtained at 1.5 h post-dose of oxcarbazepine (50 mg/kg, ip) in rats pretreated intraperitoneally with silymarin/(-)-EPG 1:1 (12.5/12.5 mg/kg; fixed-ratio combination of 1:1), silymarin/(-)-EPG 1:3 (6.25/18.75 mg/kg; fixed-ratio combination of 1:3), silymarin/(-)-EPG 3:1 (18.75/6.25 mg/kg; fixed-ratio combination of 3:1), or verapamil (25 mg/kg). Data are expressed as the mean values ± standard error of the mean (SEM) of three determinations (n = 3). Comparisons between the verapamil (positive control group) vs experimental groups were performed using one-way ANOVA with the
xli
xliii
List of tables
Table I.2.1 Representative P-glycoprotein substrates. 23
Table II.2.1 Tested drugs that interfered at the retention times of the analytes [carbamazepine (CBZ), lamotrigine (LTG), oxcarbazepine (OXC), phenobarbital (PB), phenytoin (PHT), carbamazepine-10,11-epoxide (CBZ-E), licarbazepine (LIC) and internal standard (IS)]. 73
Table II.2.2 Mean calibration parameters obtained for carbamazepine (CBZ), lamotrigine (LTG), oxcarbazepine (OXC), phenobarbital (PB), phenytoin (PHT), carbamazepine-10,11-epoxide (CBZ-E) and licarbazepine (LIC) in
human plasma (n = 5). 74
Table II.2.3 Intra and interday precision (% CV) and accuracy (% bias) values obtained for carbamazepine (CBZ), lamotrigine (LTG), oxcarbazepine (OXC), phenobarbital (PB), phenytoin (PHT), carbamazepine-10,11-epoxide (CBZ-E) and licarbazepine (LIC) in human plasma samples at the concentrations of the lower limit of quantification (*) and at the low (QC1), middle (QC2) and high (QC3) concentrations representative of the
calibration ranges (n = 5). 75
Table II.2.4 Absolute recovery of carbamazepine (CBZ), lamotrigine (LTG), oxcarbazepine (OXC), phenobarbital (PB), phenytoin (PHT), carbamazepine-10,11-epoxide (CBZ-E) and licarbazepine (LIC) from
human plasma. 76
Table II.2.5 Stability (values in mean percentage) of carbamazepine (CBZ), lamotrigine (LTG), oxcarbazepine (OXC), phenobarbital (PB), phenytoin (PHT), carbamazepine-10,11-epoxide (CBZ-E) and licarbazepine (LIC) in unprocessed and processed human plasma samples under the conditions that mimic sample handling and storage (n = 5). 77
Table II.2.6 Plasma concentrations of carbamazepine (CBZ), lamotrigine (LTG), oxcarbazepine (OXC), phenobarbital (PB) and phenytoin (PHT), and the metabolites carbamazepine-10,11-epoxide (CBZ-E) and licarbazepine (LIC) in real plasma samples obtained from epileptic patients under treatment with different therapeutic regimens. 79
Table II.3.1 Mean calibration parameters obtained for carbamazepine (CBZ), carbamazepine-10,11-epoxide (CBZ-E), oxcarbazepine (OXC) and licarbazepine (LIC) in supplemented Williams’ E culture medium (n = 3). 90
xliv
Table II.3.2 Inter and intraday precision (% CV) and accuracy (% bias) values obtained for carbamazepine (CBZ), carbamazepine-10,11-epoxide (CBZ-E), oxcarbazepine (OXC) and licarbazepine (LIC) in supplemented Williams’ E culture medium samples at the concentrations of the lower
limit of quantification (*) and at low (QC1), medium (QC2) and high (QC3)
concentrations representative of the calibration ranges. 91
Table II.3.3 Absolute recovery of carbamazepine (CBZ), carbamazepine-10,11-epoxide (CBZ-E), oxcarbazepine (OXC) and licarbazepine (LIC) in supplemented Williams’ E culture medium. 92
Table II.3.4 Stability (values in mean percentage) of carbamazepine (CBZ), carbamazepine-10,11-epoxide (CBZ-E), oxcarbazepine (OXC) and licarbazepine (LIC) in unprocessed and processed samples of supplemented Williams’ E culture medium under the expected sample handling and storage conditions (n = 5) 92
Table II.4.1 Mean calibration parameters obtained for 5-(4-hydroxyphenyl)-5-phenylhydantoin (HPPH), phenytoin (PHT) and lamotrigine (LTG) in supplemented Williams’ E culture medium (n = 3). 105
Table II.4.2 Inter and intraday precision (% CV) and accuracy (% bias) values obtained for 5-(4-hydroxyphenyl)-5-phenylhydantoin (HPPH), phenytoin (PHT) and lamotrigine (LTG) in samples of supplemented Williams’ E culture medium at the concentrations of the lower limit of quantification (*) and at the low (QC1), middle (QC2) and high (QC3) concentrations
representative of the calibration ranges. 105
Table II.4.3 Absolute recovery of 5-(4-hydroxyphenyl)-5-phenylhydantoin (HPPH), phenytoin (PHT) and lamotrigine (LTG) in supplemented Williams’ E
culture medium. 106
Table IV.2.1 Results obtained for the main validation parameters of the HPLC-DAD
methods employed to quantify carbamazepine (CBZ), carbamazepine-10,11-epoxide (CBZ-E), oxcarbazepine (OXC), licarbazepine (LIC), phenytoin (PHT) and 5-(4-hydroxyphenyl)-5-phenylhydantoin (HPPH) in plasma and brain homogenate supernatant. 169
xlv Table IV.2.2 Pharmacokinetic parameters estimated by non-compartmental analysis
of the plasma concentration-time profiles of carbamazepine (CBZ), oxcarbazepine (OXC), phenytoin (PHT), and their main metabolites
carbamazepine-10,11-epoxide (CBZ-E), licarbazepine (LIC) and 5-(4-hydroxyphenyl)-5-phenylhydantoin (HPPH), respectively, obtained
in rats after pretreatment with silymarin (25 mg/kg), verapamil (25 mg/kg) or the corresponding volume of vehicle 1 h before intraperitoneal administration of CBZ (25 mg/kg), OXC (50 mg/kg) or PHT (100 mg/kg) (n = 6, unless otherwise noted). Data are expressed as the mean ± standard error of the mean (SEM), except for tmax that is
expressed as the median value (range). 173
Table IV.3.1 Pharmacokinetic parameters estimated by non-compartmental analysis
of the plasma concentration-time profiles of oxcarbazepine (OXC) and its active metabolite licarbazepine (LIC) obtained in rats after
intraperitoneal pretreatment with silymarin (25 mg/kg), (-)-epigallocatechin gallate [(-)-EPG; 25 mg/kg], silymarin/(-)-EPG
(12.5/12.5 mg/kg, fixed-ratio combination of 1:1) silymarin/(-)-EPG (6.25/18.75 mg/kg, fixed-ratio combination of 1:3), silymarin/(-)-EPG (18.75/ 6.25 mg/kg, fixed-ratio combination of 3:1) or verapamil (25 mg/kg) 1 h before a single intraperitoneal administration of OXC (50 mg/kg) (n = 6, unless otherwise noted). Data are expressed as the mean values ± standard error of the mean (SEM), exception for tmax that
is expressed as the median value (range). 193
APPENDICES
Table A.1 An overview of the effects of flavonoids on P-glycoprotein (P-gp) evaluated by cell-based in vitro studies. 219
Table A.2 An overview of the effects of flavonoids on the pharmacokinetic parameters of some drugs (P-glycoprotein substrates) evaluated by
non-clinical in vivo studies. 230
Table B.1 Table B.1. Best-fit values and respective standard errors of the concentration-response curves for baicalein, (-)-epigallocatechin gallate [(-)-EPG], kaempferol, quercetin and silymarin as well as for
their dual combinations. 237
Table B.2 Theoretical concentration of baicalein, (-)-epigallocatechin gallate [(-)-EPG], kaempferol, quercetin and silymarin as well as of their dual combinations that induces an 8-fold increase in the intracellular
xlvii
xlix
List of abbreviations
A
ABC Adenosine triphosphate-binding cassette AED Antiepileptic drug
ATP Adenosine triphosphate
AUC Area under the concentration-time curve AUC0-t AUC from time zero to the last sampling time
AUC0- AUC from zero to infinity B
BCRP Breast cancer resistance protein
Bias Deviation from nominal concentration
C
CBZ Carbamazepine
CBZ-E Carbamazepine-10,11-epoxide CI95% 95% confidence interval
Clast Last quantifiable concentration
CLt Total body clearance Cmax Plasma peak concentration
CNS Central nervous system CV Coefficient of variation CYP Cytochrome P450
D
DAD Diode array detector
DMEM Dulbecco’s Modified Eagle’s Medium DMSO Dimethyl sulfoxide
E
EC50 Half maximal effective concentration
EDTA Ethylenediaminetetraacetic acid EMA European Medicines Agency (-)-EPG (-)-Epigallocatechin gallate
l F
FBS Fetal bovine serum
FDA U.S. Food and Drug Administration
G
GABA -Aminobutyric acid GABAA GABA type A
H
HPLC High-performance liquid chromatography HPPH 5-(4-Hydroxyphenyl)-5-phenylhydantoin
I
ILAE International League against Epilepsy ip Intraperitoneal
IS Internal standard iv Intravenous
K
kel Apparent terminal rate constant L
LIC Licarbazepine
LLE Liquid-liquid extraction
LLC-PK1 Porcine-kidney derived Lilly Laboratories cell line
LLC-PK1-MDR1 Porcine-kidney derived Lilly Laboratories cell line transfected with the
MDR1 gene
LLOQ Lower limit of quantification LOD Limit of detection
LTG Lamotrigine
M
MDCK Madin-Darby canine kidney cell line
MDCK-MDR1 Madin-Darby canine kidney cell line transfected with the MDR1 gene
MDR1 Human multidrug resistance-1 gene
mdr1 Rodent multidrug resistance-1 gene
MEPS Microextraction by packed sorbent MRP Multidrug resistance-associated protein MRT Mean residence time
li N NBD Nucleotide-binding domain O OXC Oxcarbazepine P
Papp Apparent permeability coefficient
PB Phenobarbital PBS Phosphate-buffered saline P-gp P-glycoprotein PHT Phenytoin PP Protein precipitation PRM Primidone Q QC Quality control R r2 Determination coefficient Rh123 Rhodamine 123 S
SEM Standard error of the mean SPE Solid-phase extraction
T
TDM Therapeutic drug monitoring TEER Transepithelial electrical resistance TM Transmembrane α-helix segment
tmax Time to reach Cmax
TMD Transmembrane domain
t1/2el Apparent terminal elimination half-life U
liii
lv
List of publications
FERREIRA A ET AL. Isobolographic analysis of the neuro and hepatotoxic profile resulting from the
combination of carbamazepine, oxcarbazepine or phenytoin with the flavonoid silymarin (In
preparation for publication).
FERREIRA A ET AL. Impact of silymarin, a flavonoid-type P-glycoprotein inhibitor, on the
pharmacokinetics of carbamazepine, oxcarbazepine and phenytoin in rats (Submitted for
publication)
FERREIRA A ET AL (2018) Flavonoid compounds as reversing agents of the
P-glycoprotein-mediated multidrug resistance: An in vitro evaluation with focus on antiepileptic drugs.
Food Res Int. 103:110-120. doi: 10.1016/j.foodres.2017.10.010
FERREIRA A ET AL (2018) In vitro screening of dual flavonoid combinations for reversing
P-glycoprotein-mediated multidrug resistance: Focus on antiepileptic drugs. Food Chem
Toxicol. 111:84-93.doi: 10.1016/j.fct.2017.11.004
FERREIRA A ET AL. (2017) Influence of the dual combination of silymarin and (-)-epigallocatechin
gallate, natural dietary flavonoids, on the pharmacokinetics of oxcarbazepine in rats. Food
Chem Toxicol. 106: 446-454. doi: 10.1016/j.fct.2017.06.015
FERREIRA A ET AL. (2016) A Rapid and Sensitive HPLC–DAD Assay to Quantify Lamotrigine,
Phenytoin and Its Main Metabolite in Samples of Cultured HepaRG Cells. J Chromatogr Sci. 54(8): 1352–1358. doi:10.1093/chromsci/bmw088
FERREIRA A ET AL. (2016) HPLC–DAD Method for the Quantification of Carbamazepine,
Oxcarbazepine and their Active Metabolites in HepaRG Cell Culture Samples.
Chromatographia. 79(9): 581–590. doi:10.1007/s10337-016-3063-7
FERREIRA A ET AL. (2016) Huperzine A from Huperzia serrata: a review of its sources, chemistry,
pharmacology and toxicology. Phytochem Rev. 15(1): 51–85. doi:10.1007/s11101-014-9384-y
FERREIRA A ET AL. (2015) Flavonoid compounds as reversal agents of the P-glycoprotein–
mediated multidrug resistance: biology, chemistry and pharmacology. Phytochem Rev. 14(2): 233–272. doi:10.1007/s11101-014-9358-0
lvi
FERREIRA A ET AL. (2014) Liquid chromatographic assay based on microextraction by packed
sorbent for therapeutic drug monitoring of carbamazepine, lamotrigine, oxcarbazepine, phenobarbital, phenytoin and the active metabolites carbamazepine-10,11-epoxide and licarbazepine. J Chromatogr B Anal Technol Biomed Life Sci. 971: 20–29. doi:10.1016/j.jchromb.2014.09.010
Chapter I
1
CHAPTER I
General Introduction
The content of this chapter is included in the following manuscript:
FERREIRA A ET AL. (2015) Flavonoid compounds as reversal agents of the P-glycoprotein–
mediated multidrug resistance: biology, chemistry and pharmacology. Phytochem Rev. 14(2): 233–272. doi:10.1007/s11101-014-9358-0
General Introduction
Chapter I
3
I.1. Epilepsy
General Introduction
Chapter I
5
I.1.1. Historical background
Epilepsy is perhaps one of the oldest recorded medical illnesses in history (WAHAB 2010). In fact,
the origin of the word “epilepsy”, derived from Latin and Greek words for “seizure” or “to seize upon”, evidence the ancient provenance of this disorder (WORLD HEALTH ORGANIZATION 2005;
GOLDENBERG 2010). In all civilizations, epilepsy can be traced as far back as medical records exist (WORLD HEALTH ORGANIZATION 2005). As a disease entity, epilepsy has first been mentioned by the ancient Egyptians who called it nesejet, or by the ancient Babylonians who called it the
bennu disease (WAHAB 2010). In these ancient times, the disease was described as a condition
representing an evil state of mind or possession, requiring exorcism, incantations or other religious or social approaches, while on the other hand, in some cultures, patients with epilepsy were regarded as people who had mystical or spiritual powers, and it was even thought to be contagious (WORLD HEALTH ORGANIZATION 2005; WAHAB 2010). Nevertheless, although Hippocrates
linked the seizures to a problem in brain function more than 2,000 years ago, the first modern definition of epilepsy was given in 1875 by Hughlings Jackson, who recognized a seizure as being due to disordered brain electricity, which can alter consciousness, sensation and behaviour (WORLD HEALTH ORGANIZATION 2005; WEIERGRÄBER ET AL. 2010; WAHAB 2010). The discovery of the
human electroencephalography in the 1920s helped in correlating the neuronal activities to the behavioural disorders, and the remarkable advances in molecular biology, neurophysiology, genetics, functional imaging and numerous neurochemical techniques have contributed to deep the understanding of the basic mechanisms underlying seizures and epilepsy, allowing the exploitation of the concepts behind excitability, inhibition, modulation, neurotransmission and synchronisation (WORLD HEALTH ORGANIZATION 2005). Notwithstanding, although epilepsy is recognized as a neurological disorder since the 19th century, despite the considerable developments on neurophysiology and neurochemistry, the understanding of the molecular and cellular mechanisms underlying the genesis and progression of epileptic seizures (ictogenesis) remains unclear, as well as those mechanisms involved in transforming the normal brain tissue into a seizure-prone brain tissue (epileptogenesis) (BLAUWBLOMME ET AL. 2014; BOISON 2016).
Nevertheless, it is recognised that -aminobutyric acid (GABA) and glutamate are the brain’s most plentiful inhibitory and excitatory neurotransmitters, respectively, working together to control the brain's overall level of excitability. Regarding this, it is broadly acknowledged that an imbalance between inhibitory GABAergic system and excitatory glutamatergic system is a potential mechanism underlying seizure activity and cell death; on the other hand, changes in voltage- and receptor-gated ion channels also appear to be involved in the pathogenesis of epilepsy(KWAN ET AL. 2001; BRODIE 2010; LASOŃ ET AL. 2013).
General Introduction
6
I.1.2. Epidemiology and costs
With an increased risk of morbidity and mortality that significantly affects the patients’ quality of life, epilepsy is one of the most prevalent non-communicable neurological conditions (LHATOO AND SANDER 2005; NGUGI ET AL. 2011) and the third most common neurological disorder, positioning itself just behind the stroke and Alzheimer’s disease (SARMA ET AL. 2016; MULA AND
SANDER 2016). This disorder affects almost 70 million people worldwide (KAUR ET AL. 2016).
The prevalence of epilepsy in low- and middle-income countries is about twice that of high-income countries, being estimated an overall prevalence of 0.7% (SCHMIDT AND SCHACHTER 2014).
In Europe, the prevalence of this illness was reported to range between 4.3 and 7.8 per 1,000 (PUGLIATTI ET AL.2007).On the other hand, the overall annual incidence of epilepsy ranges from
40 to 70 cases per 100,000 people in industrialised countries (SANDER 2003; DUNCAN ET AL. 2006; LAXER ET AL. 2014). The few incidence studies performed in developing countries show rates from 49.3 to 190 per 100,000 population (WORLD HEALTH ORGANIZATION 2005). The reported epilepsy
incidence and prevalence vary widely despite this medical disorder is amongst the most common serious neurological conditions (BELL AND SANDER 2002). Epilepsy knows no geographical,
ethnic or social boundaries (BELL AND SANDER 2002; WORLD HEALTH ORGANIZATION 2005).
Nevertheless, prevalence and incidence of epilepsy differ by demographic factors including age, gender, race and socioeconomic status (DUNCAN ET AL. 2006; BANERJEE ET AL. 2009). Indeed,
the incidence rate of epilepsy varies considerably with age showing a bimodal distribution characterized by steeply increases in childhood and in the elderly (BEGHI ET AL. 2009).
An initial estimative in Europe reported a total economic cost for epilepsy of €15.5 billion, with total costs per case ranging from €2,000 to €11,500 showing a high variability among countries. The costs are believed to be increased in western countries not only due to the overall number of cases, but also to the quality of their health system (PUGLIATTI ET AL. 2007). It is also
recognised that drug-refractory epilepsy can increase the cost per patient, with indirect costs rising to more than three times when comparing with seizure-free patients (VAN HOUT ET AL.
1997; JACOBY ET AL. 1998).
I.1.3. Epilepsy and epileptic seizures
Epilepsy was conceptually defined in 2005 by the International League against Epilepsy (ILAE) as “a disorder of the brain characterized by an enduring predisposition to generate epileptic seizures and by the neurobiological, cognitive, psychological, and social consequences of this condition”, requiring the occurrence of at least one epileptic seizure (FISHER ET AL. 2005). In general, the diagnosis of epilepsy was reported to imply a persistent epileptogenic abnormality of the brain that is able to spontaneously generate paroxysmal activity (ENGEL 2006). In turn,
an epileptic seizure was defined by ILAE as “a transient occurrence of signs and/or symptoms due to abnormal excessive or synchronous neuronal activity in the brain” (FISHER ET AL. 2017a;