The Role of Quantitative Aortographic Assessment of Aortic
Regurgitation by Videodensitometry in the Guidance of Transcatheter
Aortic Valve Implantation
Yosuke Miyazaki,
1Rodrigo Modolo,
2,3Mohammad Abdelghani,
2Hiroki Tateishi,
4Rafael Cavalcante,
1Carlos Collet,
2Taku Asano,
2Yuki Katagiri,
2Erhan Tenekecioglu,
1Rogério Sarmento-Leite,
5José A. Mangione,
6Alexandre Abizaid,
7Osama I.I. Soliman,
1,8Yoshinobu Onuma,
1,8Patrick W. Serruys,
9Pedro A. Lemos,
10Fabio S. de Brito Jr.
11Department of Cardiology - Thoraxcenter, Erasmus Medical Center Rotterdam,1 Rotterdam – Netherlands Department of Cardiology - the Academic Medical Center - University of Amsterdam,2 Amsterdam – Netherlands
Departamento de Medicina Interna - Divisão de Cardiologia - Universidade de Campinas (UNICAMP),3 Campinas, SP – Brazil
Division of Cardiology - Department of Clinical science and Medicine - Yamaguchi University Graduate School of Medicine,4 Ube, Yamaguchi – Japan Instituto de Cardiologia do Rio Grande do Sul/Fundação Universitária de Cardiologia e Universidade Federal de Ciências da Saúde de Porto Alegre,5 Porto Alegre, RS – Brazil
Hospital Beneficência Portuguesa de São Paulo,6 São Paulo, SP – Brazil Instituto Dante Pazzanese de Cardiologia,7 São Paulo, SP – Brazil Cardialysis,8 Rotterdam – Netherlands
NHLI, Imperial College London,9 London – United Kingdom Hospital Israelita Albert Einstein,10 São Paulo, SP – Brazil
Instituto do Coração (InCor), Faculdade de Medicina da Universidade de São Paulo,11 São Paulo, SP – Brazil
Mailing Address: Patrick W. Serruys • P.O. Box 2125, 3000 CC. Rotterdam – Netherlands
E-mail: patrick.w.j.c.serruys@gmail.com, patrick.w.j.c.serruys@pwserruys.com Manuscript received November 29, 2017, revised manuscript February 18, 2018, accepted March 07, 2018
DOI: 10.5935/abc.20180139
Abstract
Background: Balloon post-dilatation (BPD) is often needed for optimizing transcatheter heart valve (THV) implantation, since paravalvular leak (PVL) after transcatheter aortic valve implantation is associated with poor outcome and mortality. Quantitative assessment of PVL severity before and after BPD is mandatory to properly assess PVL, thus improving implantation results and outcomes.
Objective: To investigate a quantitative angiographic assessment of aortic regurgitation (AR) by videodensitometry before and after BPD.
Methods: Videodensitometric-AR assessments (VD-AR) before and after BPD were analysed in 61 cases.
Results: VD-AR decreased significantly from 24.0[18.0-30.5]% to 12.0[5.5-19.0]% (p < 0.001, a two-tailed p < 0.05 defined the statistical significance). The relative delta of VD-AR after BPD ranged from -100% (improvement) to +40% (deterioration) and its median value was -46.2%. The frequency of improvement, no change, and deterioration were 70% (n = 43), 25% (n = 15) and 5% (n = 3), respectively. Significant AR (VD-AR > 17%) was observed in 47 patients (77%) before and in 19 patients (31%) after BPD.
Conclusions: VD-AR after THV implantation provides a quantitative assessment of post-TAVI regurgitation and can help in the decision-making process on performing BPD and in determining its efficacy. (Arq Bras Cardiol. 2018; 111(2):193-202)
Keywords:Aortic Valve Insufficiency/diagnostic imaging; Angiography/evaluation; Heart Valve Prosthesis Implantation; Transcatheter Aortic Valve Replacement.
Introduction
Balloon post-dilatation (BPD) is often needed for optimizing transcatheter heart valve (THV) implantation, since paravalvular leak (PVL) after transcatheter aortic valve implantation (TAVI) is associated with long- term
fatal prognosis.1-5 The incidence of moderate or severe PVL following TAVI varies from 0% to 24% and that of mild PVL from 7% to 70%.6 BPD is performed in 21% to 28% of cases with the first generation THVs.7, 8 Although newer generations of THVs have been designed to reduce the PVL, BPD is still performed in up to 17% of cases receiving the new generation of THVs.7,9,10 Therefore, BPD remains one important technique to optimize implantation of the THV.
in clinical practice (i.e. the minimalist approach) restricting the usage of transesophageal echocardiography (TEE) as a guidance for TAVI and increasing the role of aortography as a screening tool to determine the severity of PVL during the procedure. We have previously reported the in vitro and in vivo validation of quantitative angiographic assessment of aortic regurgitation (AR) by videodensitometry technique after implantation of THV with an excellent reproducibility and accuracy.12 This technique provides an accurate assessment of the severity of PVL and it has been shown that a Videodensitometric-AR (VD-Videodensitometric-AR) > 17% correlates with increased mortality and impaired reverse cardiac remodelling as determined by echocardiography after TAVI.13,14 This prognostic cut-off value (VD-AR > 17%) could have the potential to guide operators in deciding the need for BPD. However, the change of VD-AR from before to after BPD has not been investigated. The aim of this study is to assess a quantitative aortographic approach of PVL by videodensitometry before and after BPD.
Methods
Study design
This is a report on patients enrolled in the the Brazilian TAVI registry including between January 2008 and January 2013. List of participating centers, inclusion and exclusion criteria and technical description of TAVI-procedure were previously reported.15 The study protocol was approved by the ethics committee at each of the participating centers and all patients provided informed written consent. Three hundred ninety-nine patients were enrolled in the Brazilian TAVI registry in that period. VD-AR was performed and found to be analysable in 228 patients.16 In this population, 102 patients underwent BPD, and in 17 cases, no angiography was available
before BPD. Out of 85 cases with available aortograms before and after BPD, VD-AR was analysable at both time points in 61 cases (Figure 1). The reasons of non-analysable are discriminated in Figure 1.
Aortographic assessment of AR
Aortic root angiography was performed before and after BPD, using at least 20 ml of non-ionic contrast injected through a pigtail catheter positioned above the prosthetic valve stent (in case of a balloon-expandable device) or within the distal third of the prosthetic valve stent (in case of a self-expanding device). The decision on the total contrast volume and speed of injection, catheter size, and the projection were left to the discretion of the operators. Visual assessment of AR was performed by experienced observers based on Sellers’ grade.17 In a blinded fashion, assessment of post-BPD aortograms was performed by observers different from those who analyzed pre-BPD aortograms.
Quantification of AR using videodensitometric technology VD-AR before and after BPD was analysed at an independent core laboratory (Cardialysis Clinical Trials Management and Core Laboratories, Rotterdam, the Netherlands) by experienced observers using a dedicated software (CAAS A-Valve 2.0.2; Pie Medical Imaging, Maastricht, The Netherlands). The details of this technique have been described elsewhere.12-14,16,18 After drawing the contours of the aortic root (i.e. reference region) and the subaortic one third of the left ventricle (i.e. region of interest [ROI]), the contrast time-density curves were generated for both regions over at least three cardiac cycles after contrast injection. The areas under these curves (AUC) are automatically calculated and represent the time-density integral. VD-AR is automatically calculated as the ratio of the AUC of the
Figure 1 – Flowchart of this study. TAVI: transcatheter aortic valve implantation; VD-RA: Videodensitometric of aortic regurgitation; TEE: transesophageal echocardiography. Post TAVI VD-AR analyzable cases n = 228
Post-dilatation cases n = 102
Post-dilatation performed without aortography: 17 cases
Post-dilatation performed with angiography, n = 85
Analyzable cases n = 61* (72%) Non-analyzable cases n = 24 (28%)
Reasons of non-analysis
• Contrast-filled descending aorta overlapping in the reference area or region of interest (n = 14) • Catheter in the LV (n = 4)
• Table motion (n = 3) • Inadequate contrast (n = 2) • Short recording of aortography (n = 2) • TEE probe (n = 1)
Figure 2 – Videodensitometric assessment of aortic regurgitation. A) Delineation of the aortic root (reference region: red area in the aortography) and the subaortic one third of LV (ROI: yellow area in the aortography) are shown by the analyser. The time-density curves are provided for both ROI (yellow) and reference (red) regions, and the AUC is automatically computed by the software time-density integrals. VD-AR corresponds to the relative AUC, which is automatically calculated as the ratio of the relative AUC in the ROI (yellow) to that in the reference area (red). Theoretically, the value of VD-AR ranges from 0 to 1. B) An example of VD-AR measurement before BPD. C) An example of VD-AR measurement after BPD. Reproduce and adopted from Tateishi et al. EuroIntervention 201614
ROI to that of the reference region (Figure 2). Theoretically, the value of VD-AR ranges from 0.0% to 100%. The relative delta VD-AR was calculated as = (VD-AR after BPD - VD-AR before BPD)/VD-AR before BPD, where a negative value indicates an improvement of the severity of AR.
THV and post-dilatation balloon diameters / annulus diameter ratios
Multislice computed tomography (MSCT) was performed following the local radiological protocol. Cover index was calculated as “(prosthesis nominal diameter – annulus diameter) / (prosthesis nominal diameter) × 100”. The post-dilatation balloon size / annulus diameter ratio was calculated as “(balloon nominal diameter – annulus diameter) / (balloon nominal diameter) × 100”.
Statistics
When continuous variables were normally distributed, we summarized data as mean ± standard deviation.19 If they were not normally distributed, median and inter-quartile range [IQR] were used. Mann-Whitney test was used to compare continuous variables between independent samples. Wilcoxon signed ranks test was performed to compare the serial changes between before and after BPD. All analyses were performed with SPSS 23 (IBM, Armonk, NY, USA). A two-tailed p < 0.05 defined the statistical significance.
Results
Baseline characteristics and echocardiographic data of this population (n = 61) are shown in Table 1. The mean age
was 81.6 ± 7.6 years, and patients had a high Society of Thoracic Surgeons (STS)-Predicted Risk Of Mortality score, 8.8(4.6-16.3). Either CoreValve (Medtronic, Minneapolis, MN, USA) (72%) or SapienXT (Edwards Lifesciences, Irvine, CA, USA) (28%) have been implanted. In most cases, TAVI was performed with general anaesthesia (98%) and transfemoral approach (97%).
Influence of BPD on VD-AR
The change of VD-AR from before- to after- BPD is shown in Figure 3 and a representative case is displayed in Figure 2 and Movie 1. VD-AR decreased significantly from 24.0[18.0-30.5]% (before BPD) to 12.0[5.5-19.0]% (after BPD) (p < 0.001). The median value of absolute delta VD-AR was -10.0%, corresponding to a relative delta of - 46.2% (range: -100% to +40%). The frequencies of any improvement or deterioration of AR (as defined by VD-AR) were 82% (n = 50) and 18% (n = 11), respectively (Figure 4). The 25th percentile of the relative delta VD-AR was 20%, and this cut-point was arbitrarily used to define “a significant change” as follows: a relative delta < -20% defined as “a significant improvement”, a relative delta of -20 to +20% as “no change”, and a relative delta > +20% as “a significant deterioration”. There were 43 patients (70%) with significant improvement, 15 patients (25%) with no change, and 3 patients (5%) with significant deterioration.
Table 1 – Baseline and echocardiographic characteristics of the study population (n = 61)
Variables Median (IQR)/Frequency
Clinical characteristics
Age, years (median[IQR]) 81.6 ± 7.6
Male gender, n (%) 37(60.7)
BMI, kg/m2 24.6 ± 3.9
NYHA II, n (%) 13(21.3)
NYHA III, n (%) 27(44.3)
NYHA IV, n (%) 21(34.4)
Hypertension, n (%) 47(77.0)
DM, n (%) 15(24.6)
Renal insufficiency*, n (%) 51(83.6)
CAD, n (%) 31(50.8)
PAD, n (%) 13(21.3)
COPD, n (%) 15(24.6)
PH**, n (%) 12(19.7)
Prior PCI, n (%) 15(24.6)
Prior CABG, n (%) 10(16.4)
Prior MI, n (%) 6(9.8)
Prior stroke, n (%) 6(9.8)
Prior BAV, n (%) 4(6.6)
Prior AVR, n (%) 1(1.6)
Prior PMI, n (%) 7(11.5)
Af/AFL, n (%) 9(15.0)
STS-PROM, % 8.8[4.6-16.3]
EuroSCORE, % 15.9[9.2-25.4]
Preprocedural echocardiographic parameters
LVDd, mm 50.0[46.0-55.0]
LVEF, 61.0[45.0-68.0]
LVM index, % 136.9[114.2-162.9]
AVA, cm2 0.6[0.5-0.8]
Peak PG, mmHg 75.0[64.0-92.5]
Mean PG, mmHg 47.0[41.0-61.0]
MR >mild, n (%) 16(26.2)
TEE guidance, n (%) 56(91.8)
General anesthesia, n (%) 60(98.4)
Transfemoral approach, n (%) 59(96.7)
Procedural characteristics
CoreValve, n (%) 44(72)
CoreValve 26mm, n (%) 9(20.5)
CoreValve 29mm, n (%) 17(38.6)
CoreValve 31mm, n (%) 18(40.9)
Sapien-XT, n (%) 17(28)
Sapien-XT 23mm, n (%) 7(41.2)
Sapien-XT 26mm, n (%) 8(47.1)
Sapien-XT 29mm, n (%) 2(11.8)
Pre-dilatation performed, n (%) 18(29.5%)
Video 1 – Videodensitometric assessment of aortic regurgitation before and after balloon post-dilatation. Left panel shows VD-AR assessment before BPD (VD-AR = 20%). Right panel shows VD-AR assessment after BPD (VD-AR = 6%).
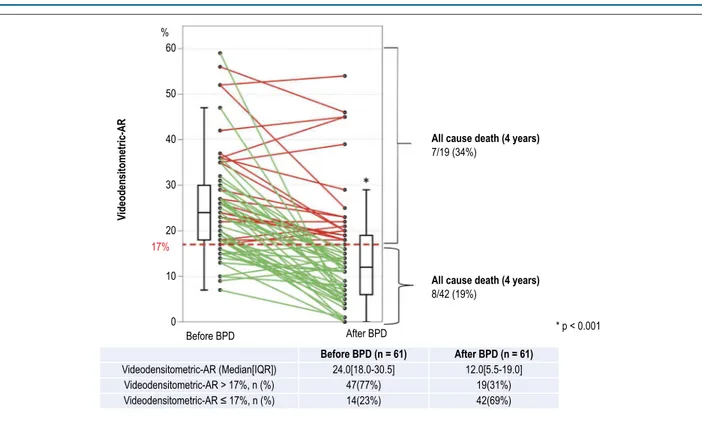
Figure 3 – Serial changes of the Videodensitometric-AR. Individual serial changes before and after balloon post-dilatation are shown in this figure. In patients with
VD-AR > 17%, 7 deaths (34%) occurred, whereas in patients with VD-AR ≤ 17%, 8 deaths (19%) were observed. %
60
50
40
30
20
10
0 17%
V
ideodensitometric-AR
All cause death (4 years)
All cause death (4 years) 7/19 (34%)
8/42 (19%)
* p < 0.001
Before BPD After BPD
Videodensitometric-AR (Median[IQR]) Videodensitometric-AR > 17%, n (%) Videodensitometric-AR ≤ 17%, n (%)
Before BPD (n = 61) After BPD (n = 61)
24.0[18.0-30.5] 12.0[5.5-19.0] 47(77%)
14(23%)
19(31%) 42(69%)
and ranged from 0.0% to 22.8% in patients with a significant improvement of AR, and 13.8[3.3,16.5], ranging -29.0% to 19.3% in those with no change or a significant deterioration of AR. Post-dilatation balloon size / annulus diameter ratio was
Figure 4 – Cumulative frequency curve of the rate of improvement or deterioration of aortic regurgitation by balloon post-dilatation. The formula of the relative delta VD-AR was “(VD-AR after BPD - VD-AR before BPD)/VD-AR before BPD”. Negative values indicate improvements of AR after BPD, whereas positive values stand for deterioration of AR after BPD. Using twenty-fifth percentile of the absolute delta VD-AR, arbitrarily we defined a relative delta of less than -20% as a significant improvement (blue), from -20 to 20% as no change (green), and 20% more as a significant deterioration (orange).
Relative delta VD-AR
Relative delta VDAR
= (VDAR after PBD – VDAR before PBD) / VDAR before PBD Median [IQR]
Range
–46.2(–75.0,–17.6)% –100% – 40% n = 61
Significant improvement
Significant deterioration No change
–100 –80 –60 –40 –20 0 20 40
Relative delta VD-AR (%)
Cumulative frequency
1.0
0.9
0.8
0.7
0.6
0.5
0.4
0.3
0.2
0.1
0
Serial change of AR based on Sellers’ grade
Before BPD, AR was visually classified as Sellers’ III in 36 patients (59%), and as Sellers’ II in 25 patients (41%). After post-dilatation, there were 3 (5%) cases with Seller’ III, 19 (31%) cases with Sellers’ II, 34 (56%) cases with Sellers’ I and 5 (8%) cases with Sellers’ 0. Out of 36 patients with Sellers’ III before BPD, 34 patients had their Sellers’ grade reduced (to Sellers’ II in 16, Sellers’ I in 17, and Sellers’ 0 in one patient. Out of 25 patients with Sellers’ II before BPD, PVL improved to Sellers’ I in 17 patients and to Sellers’ 0 in 4 patients, deteriorated to Sellers’ III in one patient, and remained unchanged (Sellers’ II) in three patients (Figure 5).
Efficacy of BPD
Before BPD, VD-AR > 17%, a value that has a prognostic significance in long-term follow-up, was observed in
47 patients (77%). Fourteen cases (23%) had a VD-AR ≤ 17%,
eleven (11/14, 79%) were evaluated as Sellers’ II before BPD and 3 (3/14, 21%) as Sellers’ III. After BPD, VD-AR > 17% was observed in 19 patients (falling from 77% to 31% of subjects) – 3 patients (16%) in Seller’s III, 10 patients (53%) in Sellers’ II, and 6 patients in Sellers’ I (32%) (Figure 6). In addition, in these patients with VD-AR > 17%, 7 deaths (34%) occurred during follow-up period, whereas among 42 patients with
VD-AR ≤ 17%, 8 patients (19%) died.
Predilatation was performed in 18 patients and had no impact on the reduction of AR assessed by VD-AR. VD-AR was 25.5% (19.5%-36.0%) with predilatation and 23.0% (16.0%-29.0%) without predilatation (p = 0.159) before PBD, and 16.5% (9.5%-22.8%) with predilatation and 11.0% (5.0%-17.0%) without predilatation (p = 0.106) after PBD. Normalized delta
VD-AR was -44.5 (-60.1 – -13.0) with predilatation and -50.0(-75.0 – -17.9) without predilatation (p = 0.569).
Discussion
This is the first study to report the value of VD-AR in assessing periprocedural changes in AR. In clinical practice, echocardiogram and aortography are the standard tools to define the device success. As mentioned in the Valve Academic Research Consortium-2 (VARC-2) consensus document, quantitative and semi-quantitative hemodynamic assessment are recommended to assess AR severity by echocardiogram and moderate-to-severe AR is defined as valve failure.11, 20
Nombela-Franco et al.8 reported serial changes using semi-quantitative grading based on echocardiogram and showed a reduction of at least 1 degree of AR in 71% of patients. To make a decision whether BPD is needed or not, echocardiogram is an important tool to evaluate the severity of AR. However, we must consider that with the increasing minimalist TAVI approach, the usage of TEE as a guidance of TAVI is becoming unfeasible. Moreover, low inter-observer agreement for the PVL 4-class grading (kappa 0.481) and the 7-class grading (kappa 0.517) has been reported,21 making a more reliable technique necessary.18 These facts support the value of aortography with VD assessment as the most practical and objective screening tool to determine the severity of PVL during the procedure. The technique has a median time of execution of 3 minutes.
Figure 6 – Videodensitometric- assessment of aortic regurgitation and Sellers’ grade before and after balloon post-dilatation.
60
50
40
30
20
10
0
V
ideodensitometric-AR
Before post dilatation After post dilatation
Sellers’ 0 Sellers’ I Sellers’ II Sellers’ III
Before post dilatation
After post dilatation
NA NA
1.0[0.0–9.0] 8.0[5.0–13.3] 18.0[14.0–23.0] 45.0[23.0–.]
18.0[13.5–22.5] 27.0[23.0–35.0]
could be decisive in helping the operator to make a decision as whether BPD should be performed during the procedure. When BPD was performed, we showed that before BPD, 77% of patients had a VD-AR > 17%, and the other patients
(VD-AR ≤ 17%) (23%) would not require BPD. This finding
is important, since BPD is associated with higher rate of
cerebrovascular events compared to the patients without BPD.8,22 Avoiding unnecessary BPD would possibly reduce the risk of cerebrovascular events as well as procedural costs.
Moreover, most cases of VD-AR ≤ 17% before BPD were
found in Sellers’ II, suggesting that the visual assessment of the Sellers’ classification could lead to unnecessary PBD.
Figure 5 – Serial changes of visual aortographic assessment.
%
100
90
80
70
60
50
40
30
20
10
0
59%
41%
56% 31% 5%
8%
Before post dilatation
After post dilatation
Sellers III Sellers II Sellers I Sellers 0
Sellers’ grade
n = 2
n = 1
n = 16
n = 3
n = 4
n = 1 n = 17 n = 17 III
n = 36
II n = 25
II n = 19
I n = 34
0 n = 5
III n = 3
After BPD, VD-AR > 17% was still seen in 31% of patients. Based on current available data, for patients with residual AR (VD-AR > 17%), additional measures should be taken. We found higher mortality in patients with VD-AR > 17%
compared to patients with VD-AR ≤ 17% during the follow-up
(34% vs. 19%). Although the difference in mortality was not significant (log rank p = 0.273) in this small population with BPD, a tendency for high mortality was previously reported in patients with VD-AR > 17% in a large population.14,16
VD-AR deteriorated numerically in 11 patients, and this deterioration was significant in 3. This comes in agreement with previous studies which also reported AR deterioration in a small proportion of patients after BPD,8 and could be due to prosthetic overexpansion with secondary leaflet maladaptation and transvalvular regurgitation.23
Serial changes of VD-AR showed predominantly improvement of AR. A reduction of the regurgitation by BPD was reported in 68%-91% in the literature.8,24 The mechanisms of regurgitation after implantation of THV are multifactorial as, for example, calcification of the native aortic annulus and left ventricular outflow tract (LVOT) and cover index are well known predicting factors of regurgitation after implantation of a THV.19,26-34
To make a decision whether BPD is needed or not and to judge its efficiency, repeated injections of large doses of contrast medium would be needed. Contrast medium volume used in this population was 150[131-209] ml/procedure. In the setting of TAVI, peri-procedural acute kidney injury (AKI) develops in 12% to 57% of cases and portends a significant increase in early and late mortality.34,35 The mechanisms of AKI following TAVI are multifactorial, and the role of the contrast medium volume is controversial.36 However, there is some evidence suggesting that a larger contrast volume is related to an increased risk of AKI after TAVI.34,37 Taking into account the important role of aortography in the minimalist TAVI era, repeated aortograms cannot be avoided. However, the possibility of reducing contrast medium is reported using a diastolic phase-synchronized injection of only 8 ml of contrast medium in an in-vitro setting.12 This technique could enable the reduction of the total amount of contrast medium during the procedure.
Limitations
After implantation of the THV, the guidewire is frequently left in the left ventricle and may produce artificial transvalvular regurgitation.38 However, the effect of the guidewire on AR during TAVI is variable according to the weight of the wire. Most operators decide whether to perform BPD with or without a guidewire in LV by using echocardiography and aortography. Indeed, in the present study, VD-AR before BPD was analysed either with (n = 49) or without (n = 12) the guidewire being left in the left ventricle.
One limitation of our study is the absence of data on aortic regurgitation index, thus lacking the possibility of comparing this to our method. Limitations of VD-AR assessment are its feasibility. The current report is a retrospective study so that the acquisition of aortography was not dedicated for VD-AR assessment. In order to perform videodensitometric assessment appropriately, the acquisition of aortography should be done without overlapping ROI with contrast filled ascending/descending aorta. Recently, Teng et al.39 reported
A dedicated acquisition protocol would achieve a high feasibility of assessment. We tried to overcome this limitation by choosing the cases that did had an adequate acquisition of images, lowering our sample size. However, a prospective clinical study is needed to confirm this hypothetical assumption. So far, CAAS-A-valve software is available as an offline system. Currently, attempts are being made to allow online assessment.40 In the near future, online system will probably foster the VD-AR as guidance for TAVI.
In this registry, no echocardiographic parameters recorded were reported after THV deployment but before BPD. The information of calcification of the native aortic valve, annulus and LVOT from computed tomography were not available.
Conclusion
VD-AR after THV implantation enables the operator to assess quantitatively regurgitation, to rationalise BPD and to assess its efficacy.
Acknowledgements
We thank Jean-Paul Aben for preparing the supporting movie.
Author contributions
Conception and design of the research: Miyazaki Y, Modolo R, Abdelghani M, Tateishi H, Cavalcante R, Collet C, Asano T, Tenekecioglu E, Mangione JA, Abizaid A, Soliman OII, Onuma Y, Serruys PW, Lemos PA, Brito Jr. FS; Acquisition of data: Miyazaki Y, Modolo R, Abdelghani M, Tateishi H, Cavalcante R, Katagiri Y, Sarmento-Leite R, Mangione JA, Abizaid A, Soliman OII, Onuma Y, Serruys PW, Lemos PA, Brito Jr. FS; Analysis and interpretation of the data: Miyazaki Y, Modolo R, Abdelghani M, Tateishi H, Cavalcante R, Collet C, Asano T, Katagiri Y, Tenekecioglu E, Mangione JA, Abizaid A, Soliman OII, Onuma Y, Serruys PW; Statistical analysis: Miyazaki Y, Modolo R, Abdelghani M, Cavalcante R, Collet C, Asano T, Katagiri Y, Mangione JA, Abizaid A, Soliman OII, Serruys PW, Brito Jr. FS; Writing of the manuscript: Miyazaki Y, Modolo R, Abdelghani M, Asano T, Mangione JA, Abizaid A, Serruys PW; Critical revision of the manuscript for intellectual content: Miyazaki Y, Modolo R, Abdelghani M, Tateishi H, Cavalcante R, Collet C, Asano T, Katagiri Y, Tenekecioglu E, Sarmento-Leite R, Mangione JA, Soliman OII, Onuma Y, Serruys PW, Lemos PA, Brito Jr. FS.
Potential Conflict of Interest
Rogério Sarmento-Leite, José A. Mangione, and Fabio S. de Brito Jr are proctors for Medtronic and Edwards Lifesciences. Pedro A. Lemos is a proctor for Edwards Lifesciences and Boston Scientific. All other authors have no relevant conflicts of interest to declare.
Sources of Funding
There were no external funding sources for this study.
Study Association
Ethics approval and consent to participate
This study used data from the Brazilian TAVI Registry. This Registry was approved by the Ethics Committe of all the
1. Kodali SK, Williams MR, Smith CR, Svenson LG, Webb JG, Makkan RR, et al. Two-year outcomes after transcatheter or surgical aortic-valve replacement. N Engl J Med. 2012; 366(18): 1686-95.
2. Kodali S, Pibarot P, Douglas PS,Williams M, Yu K, Thourani V, et al. Paravalvular regurgitation after transcatheter aortic valve replacement with the Edwards sapien valve in the PARTNER trial: characterizing patients and impact on outcomes. Eur Heart J. 2015; 36(7): 449-56.
3. Athappan G, Patvardhan E, Tuzcu EM, Svenson LG, Lemos PA, Fraccaro C, et al. Incidence, predictors, and outcomes of aortic regurgitation after transcatheter aortic valve replacement: meta-analysis and systematic review of literature. J Am Coll Cardiol. 2013; 61(15): 1585-95.
4. Reardon MJ, Van Mieghem NM, Popma JJ, Kleimar NS, Sondergaacd L,et al. Surgical or Transcatheter Aortic-Valve Replacement in Intermediate-Risk Patients. N Engl J Med. 2017; 376(14): 1321-31.
5. Abdelghani M, Serruys PW. Transcatheter Aortic Valve Implantation in Lower-Risk Patients With Aortic Stenosis: Is It Justified to Be the Preferred Treatment? Circ Cardiovasc Interv.2016;9(4): e002944.
6. Pibarot P, Hahn RT, Weissman NJ, Monaghan MJ. Assessment of paravalvular regurgitation following TAVR: a proposal of unifying grading scheme. JACC Cardiovasc Imaging. 2015;8(3):340-60.
7. Schulz E, Jabs A, Gori T, von Bardeleben S, Hink U, Kasper-Konig W, et al. Transcatheter aortic valve implantation with the new-generation Evolut R: Comparison with CoreValve(R) in a single center cohort. Int.J Cardiol Heart Vasc. 2016 Jul 5;12: 52-6.
8. Nombela-Franco L, Rodes-Cabau J, DeLarochelliere R, Larose F, Doyle D, Villeneuve J, et al. Predictive factors, efficacy, and safety of balloon post-dilation after transcatheter aortic valve implantation with a balloon-expandable valve. JACC Cardiovasc Interv. 2012; 5(5): 499-512.
9. Schymik G, Schrofel H, Heimeshoff M, Luik A, Thoenes M, Mandinov L. How to adapt the implantation technique for the new SAPIEN 3 transcatheter heart valve design. J Interv Cardiol. 2015; 28(1): 82-9.
10. Soliman OI, El Faquir N, Ren B,Spitzer E, van Gils L, Jonker H, et al. et al. Comparison of valve performance of the mechanically expanding Lotus and the balloon-expanded SAPIEN3 transcatheter heart valves: an observational study with independent core laboratory analysis. Eur Heart J Cardiovasc Imaging. 2018;19(2):157-67.
11. Kappetein AP, Head SJ, Genereux P, Piazza N, van Mieghem NM, Blackstone EH, et al. Updated standardized endpoint definitions for transcatheter aortic valve implantation: the Valve Academic Research Consortium-2 consensus document. J Thorac Cardiovasc Surg. 2013;145(1):6-23.
12. Soliman OII, Miyazaki Y, Abdelghani M, Brugmans M, Witsenburg M, Onuma Y, et al. Mid-term performance of a novel restorative pulmonary valved-conduit: preclinical results. EuroIntervention. 2017;13(12):e1418-27.
13. Abdelghani M, Tateishi H, Miyazaki Y, cavalcante R, Soliman OI, Tijssen JG, et al. Angiographic assessment of aortic regurgitation by video-densitometry in the setting of TAVI: Echocardiographic and clinical correlates. Catheter Cardiovasc Interv. 2017;90(4):650-9.
14. Tateishi H, Campos CM, Abdelghani M, Leite RS, Mangione JÁ, Bary L, et al. Video densitometric assessment of aortic regurgitation after transcatheter aortic valve implantation: results from the Brazilian TAVI registry. EuroIntervention. 2016; 11(12): 1409-18.
15. de Brito FS Jr, Carvalho LA, Sarmento-Leite R, Mangione JÁ, Lemos P, Siciliano A, et al. Outcomes and predictors of mortality after transcatheter aortic valve implantation: Results of the Brazilian registry. Catheter Cardiovasc Interv. 2015; 85(5): E153-62.
16. Tateishi H, Abdelghani M, Cavalcante R, Miyazaki Y, Campos CM, Collet C, et al. The interaction of de-novo and pre-existing aortic regurgitation after TAVI: Insights from a new quantitative aortographic technique. EuroIntervention. 2017;13(1):60-8.
17. Sellers RD, Levy MJ, Amplatz K , Lillehei CW. Left Retrograde Cardioangiography in Acquired Cardiac Disease: Technic, Indications and Interpretations in 700 Cases. Am J Cardiol. 1964 Oct 14(12):14:437-47.
18. Schultz CJ, Slots TL, Yong G,Aben JP, Van Mieghem, Swamaans M, et al. An objective and reproducible method for quantification of aortic regurgitation after TAVI. EuroIntervention. 2014;10(3):3 55-63.
19. Reinohl J, Psyrakis D, Kaier K,Kodinov V, Siepe M, Gutmann A, et al. et al. Aortic root volume is associated with contained rupture of the aortic annulus in balloon-expandable transcatheter aortic valve replacement. Catheter Cardiovasc Interv. 2016; 87(4): 807-17.
20. Abdelghani M, Tateishi H, Spitzer E, Kodirov V, Siepe M, Gutmann A, et al. Echocardiographic and angiographic assessment of paravalvular regurgitation after TAVI: optimizing inter-technique reproducibility. Eur Heart J Cardiovasc Imaging. 2016; 17(8): 852-60.
21. Hahn RT, Pibarot P, Weissman NJ, Rodriguez L, Jaber WA. Assessment of paravalvular aortic regurgitation after transcatheter aortic valve replacement: intra-core laboratory variability. J Am Soc Echocardiogr. 2015; 28(4):415-22.
22. Wang N, Lal S. Post-dilation in transcatheter aortic valve replacement: A systematic review and meta-analysis. J Interv Cardiol. 2017; 30(3): 204-11.
23. Shibayama K, Mihara H, Jilaihawi H, Berdeio J, Harada K, Itabashi Y, et al.et al. 3D Assessment of Features Associated With Transvalvular Aortic Regurgitation After TAVR: A Real-Time 3D TEE Study. JACC Cardiovasc Imaging 2016; 9(2):114-23.
24. Hahn RT, Pibarot P, Webb J, Rodes Cabau J, Hermann HC, Williamset al. Outcomes with post-dilation following transcatheter aortic valve replacement: the PARTNER I trial (placement of aortic transcatheter valve). JACC Cardiovasc Interv. 2014;7(7): 781-9.
25. Nazif TM, Dizon JM, Hahn RT, Babaliaros V, Douglas OS, El Chami ES, et al. Predictors and clinical outcomes of permanent pacemaker implantation after transcatheter aortic valve replacement: the PARTNER (Placement of AoRtic TraNscathetER Valves) trial and registry. JACC Cardiovasc Interv. 2015;8(1Part A):60-9.
26. Pasic M, Unbehaun A, Buz S, Drews T, Hetzer R. Annular rupture during transcatheter aortic valve replacement: classification, pathophysiology, diagnostics, treatment approaches, and prevention. JACC Cardiovasc Interv. 2015;8(1 Part A):1-9.
27. Condado JF, Corrigan FE, 3rd, Lerakis S, Parastatidis I, Stellman AE, Binongo JN, et al. Anatomical risk models for paravalvular leak and landing zone complications for balloon-expandable transcatheter aortic valve replacement. Catheter Cardiovasc Interv. 2017; 30(4):690-700.
28. Barbanti M, Yang TH, Rodes Cabau J, Tamburino C, Wood DA, Jilaihawi H, et al. Anatomical and procedural features associated with aortic root rupture during balloon-expandable transcatheter aortic valve replacement. Circulation. 2013; 128(3):244-53.
References
29. Buellesfeld L, Stortecky S, Kalesan B, Gloekler S, Khattab AA, Nietlispach F, et al. et al. Aortic root dimensions among patients with severe aortic stenosis undergoing transcatheter aortic valve replacement. JACC Cardiovasc Interv. 2013;6(1):72-83.
30. Mihara H, Shibayama K, Berdejo J, Haradak K, Itabashi Y, Siegel RJ, et al. t al. Impact of device landing zone calcification on paravalvular regurgitation after transcatheter aortic valve replacement: a real-time three-dimensional transesophageal echocardiographic study. J Am Soc Echocardiogr. 2015;28(4):404-14.
31. Ewe SH, Ng AC, Schuijf JD, van der Kley F, Colli A, Palmen M, et al. Location and severity of aortic valve calcium and implications for aortic regurgitation after transcatheter aortic valve implantation. Am J Cardiol. 2011;108(10):1470-7.
32. Yang TH, Webb JG, Blanke P, Dvir D, Hansson NC, Norgaard BL, et al. Incidence and severity of paravalvular aortic regurgitation with multidetector computed tomography nominal area oversizing or undersizing after transcatheter heart valve replacement with the Sapien 3: a comparison with the Sapien XT. JACC Cardiovasc Interv. 2015;8(3):462-71.
33. Binder RK, Webb JG, Willson AB, Urena M, Hannson NC, Norgaard BL, et al. The impact of integration of a multidetector computed tomography annulus area sizing algorithm on outcomes of transcatheter aortic valve replacement: a prospective, multicenter, controlled trial. J Am Coll Cardiol. 2013;62(5):431-8.
34. Yamamoto M, Hayashida K, Mouillet G, Chevalier B, Meguro K, Watanabe Y. Renal function-based contrast dosing predicts acute kidney injury following transcatheter aortic valve implantation. JACC Cardiovasc Interv. 2013;6(5):479-86.
35. Dvir D, Webb JG, Piazza N, Blanke P, Barbanti M, Bleizffer S, et al. Multicenter evaluation of transcatheter aortic valve replacement using either SAPIEN XT or CoreValve: Degree of device oversizing by computed-tomography and clinical outcomes. Catheter Cardiovasc Interv. 2015;86(3):508-15.
36. Thongprayoon C, Cheungpasitporn W, Podboy AJ, Gillaspie EA, Greason KL, Kashani KB. The effects of contrast media volume on acute kidney injury after transcatheter aortic valve replacement: a systematic review and meta-analysis. J Evid Based Med. 2016; 9(4):188-93.
37. Giannini F, Latib A, Jabbour RJ, Slarvich M, Benincasa S, Chieffo A, et al. The ratio of contrast volume to glomerular filtration rate predicts acute kidney injury and mortality after transcatheter aortic valve implantation. Cardiovasc Revasc Med. 2017;18(5)349-55.
38. Otto CM, Kumbhani DJ, Alexander KP, Calhoon JH, Desai MY, Kaul S, et al. 2017 ACC Expert Consensus Decision Pathway for Transcatheter Aortic Valve Replacement in the Management of Adults With Aortic Stenosis: A Report of the American College of Cardiology Task Force on Clinical Expert Consensus Documents. J Am Coll Cardiol. 2017;69(10):1313-46.
39. Teng J, Nijenhuis V, Swaans M, Yong G, Schultz C. How to plan an Overlap Free Projection on CTA or fluoroscopy to facilitate quantitative analysis. EuroIntervention. 2018;13(14):1652-4.
40. Abdelghani M, MacCarthy P, Miyazaki Y, Piazza N, Sahyoun C, Serruys PW. TAVI procedural guidance by angiography-Quantification by video-densitometry (Video-densitometric assessment of aortic regurgitation. Standardising acquisition and implementation into daily practice). In:EuroPCR 2017_ 16-19 May 2017. Paris: European Association of Percutaneous Cardiovascular Intervention(EAPCI);2017.