Vol.61, no.spe: e18000300, 2018
http://dx.doi.org/10.1590/1678-4324-smart-2018000300 ISSN 1678-4324 Online Edition
BRAZILIAN ARCHIVES OF
BIOLOGY AND TECHNOLOGY
A N I N T E R N A T I O N A L J O U R N A L
Assessment of the Potential Implementation of Solar Energy
Generation in State Schools in Curitiba/PR
Juliano da Silva Pereira
1*; Daniele Abe Ribeiro
1; Francielle Henrique Lucena
1; Jair
Urbanetz Júnior,
1,21Programa de Pós-Graduação em Engenharia Civil, Universidade Tecnológica Federal do Paraná, Curitiba, Brasil;
2 Programa de Pós-Graduação em Sistemas de Energia, Universidade Tecnológica Federal do Paraná, Curitiba, Brasil.
ABSTRACT
Solar energy as a form of electric power generation is gaining ground in Brazil, being the subject of worldwide discussions on sustainability. The electric energy, a right of all citizens, represents a consumption of natural resources on a large scale. State schools in Paraná invested more than R$ 46 million to guarantee electricity and thus provide essential running conditions to the system in 2016. Through open data, 15 schools from "Regional Administrativa do Cajuru", in Curitiba/PR, were evaluated in consumption and expenses of electric energy from January to May of 2017 and a solar photovoltaic system was dimensioned to supply the demand of each school. From that, it was estimated the total saving from the electricity that would no longer be spent on electricity which could be directed to other educational programs and projects of interest to the community towards sustainability within the school. The savings estimated totalized more than R$ 435 thousand annually.
Keywords: Photovoltaic Solar Energy; Renewable energy; Education for Sustainability; State Schools; Public Administration.
INTRODUCTION
Since April 2012, when the Agência Nacional de Energia Elétrica - ANEEL
[1]
published its Resolution nº 482, the first to regulate the policies on energy credit for distributed generation in Brazil, there was an expressive growth in the electrical energy yield through photovoltaic systems.
However, according to the ANEEL`s Banco de Informações de Geração
[2]
, those systems represent only 0.04% of the total amount of the Brazilian electrical power generation. Currently, 71.82% and 28.18% account for its renewable and non-renewable sources, from which 64.72% of the total supply comes from hydric sources. Therefore, and also considering the recent events of energy rationing due to the droughts in some power plants reservoirs, it is clear that the need for energy supply diversification from renewable sources ought to be greatly encouraged.Thus, it is also intended to explore the sustainability in its three pillars - environmental, economic and social – reason why the adoption of grid connected PV systems for power supply in public schools of the State of Paraná.
The use of electric power through PV systems does not contribute to Greenhouse Gas Emissions, during energy generation
[3]
. Also, as a result of its modular characteristic, the PV systems can be used in the urban area, creating the proximity between the generation source and the consumer unit, thus reducing transmission losses.Last but not least, the implementation of a photovoltaic system can take a short period of time, if compared to other renewable energy sources, as power plants, for example
[4]
.Weather conditions in Brazil enhance the potential regarding the use of solar photovoltaic systems. The national standard NBR 10899 defines solar irradiance as the rate by which solar irradiation occurs in a surface, by a unit area of the surface, usually measured in watt per square meter (W/m²)
[5]
. The annual average solar irradiation in Brazil is 1,986 kWh/m²/year, while Germany, world leader in installed capacity of grid-connected solar photovoltaic systems, has only 1,251 kWh/m² year.Because of the current economic scenario in Brazil a lot of retrenchments from the government have been made, affecting all public domains, including the educational system. According to the online database from the Secretaria de Educação do Estado do Paraná - SEED, the amount spent with electrical power in all state schools of Parana in the year of 2016 was of R$ 46,843.046.00, corresponding to 208,375 GWh
[6]
consumption.
There are studies related to the feasibility of the use of photovoltaic power in schools in countries with lower solar irradiation than Brazil. It is generally agreed that due to the fact that the low-rise typology of most of these school buildings allow enough non shaded areas to generate power to its self-sufficiency, which might not be viable to all urbanized areas.
In 2015, Brazil Greenpeace Organization was responsible for the implementation of a solar photovoltaic system in a Municipal School located in the State of Minas Gerais. After one year running the system, a 70% saving in the energy bill was verified. The economy is reallocated to fund educational projects in the school, including extracurricular activities. Nonetheless, the users, especially the teachers, believe that the main importance of the project was beyond the economic factor, emphasizing the knowledge that the subject brings and how it can be explored and applied in the learning process of the students
[7]
.installation is expected to happen in the second semester of this year, although no technical data on the systems have been released until the present moment.
As a socioeconomic impact it is still possible to mention the creation of both direct and indirect jobs, consequence of the use of PV power. It is foreseen that this sector will be responsible for the employment of 100 thousand workers until 2020
[9]
. This information supports and evidences the need for the knowledge dissemination through the use of this technology in elementary education, not segregating it inside the academy and to specific sectors.Thereby, to assist the potential of the photovoltaic energy generation implementation in State Schools and estimate its impacts on sustainability in education for the students, a sample of 15 schools belonging to the Administração Regional do Cajuru was evaluated.
The general data of these schools as well as those regarding the students, such as number of classes and enrollments were assessed. Also, the information about the consumption and the cost of electrical energy of the months January - May 2017 was collected. The potential for the implementation of the photovoltaic solar system was verified for 14 of these schools and a total saving of over R$ 435 thousand was estimated annually, which represents the amount spent on the electricity bills.
MATERIALS AND METHODS
The methodology used in this article consists of bibliographic and documental research, aiming to lay the theoretical and technical foundation for this research
[10]
. The State schools were chosen due to their public administration. From the total amount of 163 State schools, 15 were picked as the sample. Those represent the schools located in the Administração Regional do Cajuru. This Regional was selected by the fact that this location has the largest number of homes with 2,616 people living with the lowest monthly nominal wage of R$ 70, which is considered as extreme poverty[11]
. The open data from these schools were collected through the online system "Consulta Escolas" made available by SEED[6]
, which contains detailed information about the schools, such as name, neighborhood, address, number of classes and enrollments. Data related to the energy consumption and the cost of the electricity bills from all 15 units from January to May 2017 were also collected.The assessment of the electric energy consumption didn't take into account the figures of tariff flag and public lighting. All the evaluated schools are considered as low voltage energy consumers (LV) considered in the tariff group as "B3 conventional". Therefore, they don't have contracted demand, nor have they a differentiation in the peak and off-peak tariff. The measurement units used in the analysis were the kilowatt hour (kWh), for the energy consumption, and the Real (R$), which is the currency in Brazil. All data were tabulated and analyzed.
RESULTS
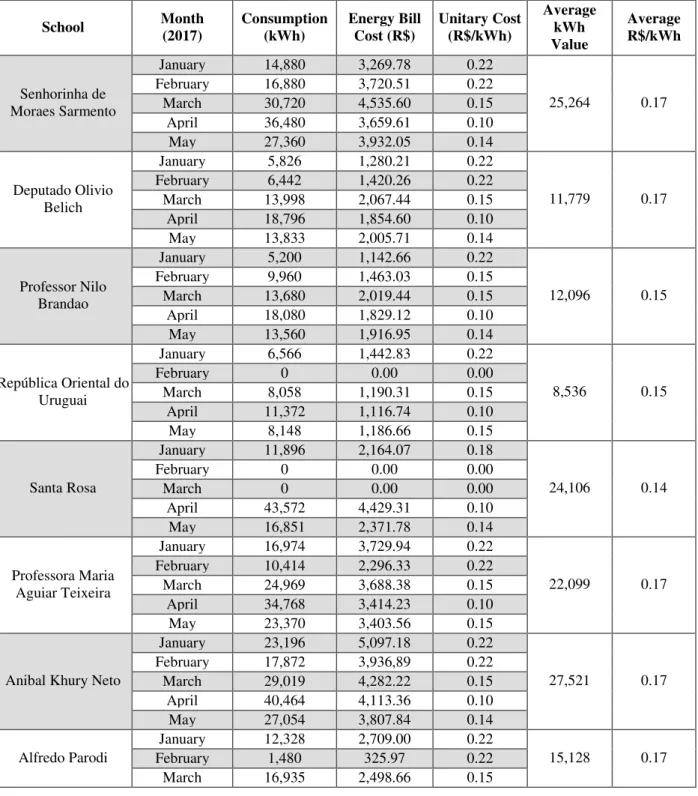
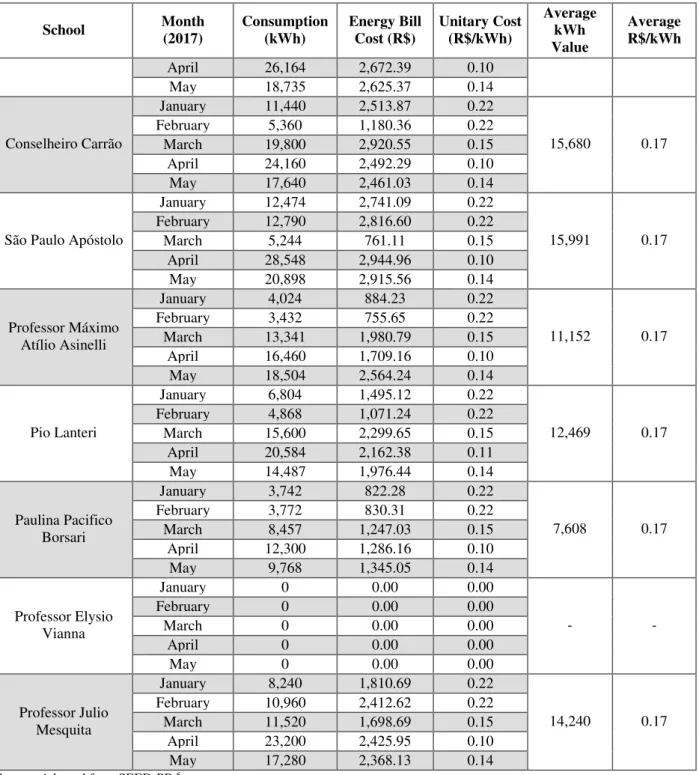
In the data analysis regarding the consumption (kWh) and the cost of electric energy (R$), for each school assessed, the value for the kilowatt hour (R$/kWh) was calculated. That was obtained from dividing the cost of the electricity bill by the energy consumption. It is possible to observe a variation of the monthly tariff for each school, which however, for calculation purpose, was considered as the average value, as a matter of simplification.
to May 2017. Also, the data from February from the República Oriental do Uruguai State School and the one from February and March from Santa Rosa State School were not registered at the "School Consultation" online system, so these months were dismissed from the analysis as well.
Next, the average monthly consumption (kWh) from each school and its respective cost of the average monthly tariff (R$/kWh), disregarding the months when the data were not registered, are shown in Table 1.
Table 1 - Unitary and Average kWh values by School
School Month (2017) Consumption (kWh) Energy Bill Cost (R$) Unitary Cost (R$/kWh) Average kWh Value Average R$/kWh Senhorinha de Moraes Sarmento
January 14,880 3,269.78 0.22
25,264 0.17
February 16,880 3,720.51 0.22
March 30,720 4,535.60 0.15
April 36,480 3,659.61 0.10
May 27,360 3,932.05 0.14
Deputado Olivio Belich
January 5,826 1,280.21 0.22
11,779 0.17
February 6,442 1,420.26 0.22
March 13,998 2,067.44 0.15
April 18,796 1,854.60 0.10
May 13,833 2,005.71 0.14
Professor Nilo Brandao
January 5,200 1,142.66 0.22
12,096 0.15
February 9,960 1,463.03 0.15
March 13,680 2,019.44 0.15
April 18,080 1,829.12 0.10
May 13,560 1,916.95 0.14
República Oriental do Uruguai
January 6,566 1,442.83 0.22
8,536 0.15
February 0 0.00 0.00
March 8,058 1,190.31 0.15
April 11,372 1,116.74 0.10
May 8,148 1,186.66 0.15
Santa Rosa
January 11,896 2,164.07 0.18
24,106 0.14
February 0 0.00 0.00
March 0 0.00 0.00
April 43,572 4,429.31 0.10
May 16,851 2,371.78 0.14
Professora Maria Aguiar Teixeira
January 16,974 3,729.94 0.22
22,099 0.17
February 10,414 2,296.33 0.22
March 24,969 3,688.38 0.15
April 34,768 3,414.23 0.10
May 23,370 3,403.56 0.15
Anibal Khury Neto
January 23,196 5,097.18 0.22
27,521 0.17
February 17,872 3,936,89 0.22
March 29,019 4,282.22 0.15
April 40,464 4,113.36 0.10
May 27,054 3,807.84 0.14
Alfredo Parodi
January 12,328 2,709.00 0.22
15,128 0.17
February 1,480 325.97 0.22
March 16,935 2,498.66 0.15
School Month (2017)
Consumption (kWh)
Energy Bill Cost (R$)
Unitary Cost (R$/kWh)
Average kWh Value
Average R$/kWh
April 26,164 2,672.39 0.10
May 18,735 2,625.37 0.14
Conselheiro Carrão
January 11,440 2,513.87 0.22
15,680 0.17
February 5,360 1,180.36 0.22
March 19,800 2,920.55 0.15
April 24,160 2,492.29 0.10
May 17,640 2,461.03 0.14
São Paulo Apóstolo
January 12,474 2,741.09 0.22
15,991 0.17
February 12,790 2,816.60 0.22
March 5,244 761.11 0.15
April 28,548 2,944.96 0.10
May 20,898 2,915.56 0.14
Professor Máximo Atílio Asinelli
January 4,024 884.23 0.22
11,152 0.17
February 3,432 755.65 0.22
March 13,341 1,980.79 0.15
April 16,460 1,709.16 0.10
May 18,504 2,564.24 0.14
Pio Lanteri
January 6,804 1,495.12 0.22
12,469 0.17
February 4,868 1,071.24 0.22
March 15,600 2,299.65 0.15
April 20,584 2,162.38 0.11
May 14,487 1,976.44 0.14
Paulina Pacifico Borsari
January 3,742 822.28 0.22
7,608 0.17
February 3,772 830.31 0.22
March 8,457 1,247.03 0.15
April 12,300 1,286.16 0.10
May 9,768 1,345.05 0.14
Professor Elysio Vianna
January 0 0.00 0.00
- -
February 0 0.00 0.00
March 0 0.00 0.00
April 0 0.00 0.00
May 0 0.00 0.00
Professor Julio Mesquita
January 8,240 1,810.69 0.22
14,240 0.17
February 10,960 2,412.62 0.22
March 11,520 1,698.69 0.15
April 23,200 2,425.95 0.10
May 17,280 2,368.13 0.14
Source: Adapted from SEED-PR 6
The power of a PV system was calculated according to the Equation 1.
𝑃𝑃𝑉=𝐻𝑇𝑂𝑇𝐸.𝐺.𝑃𝑅 (1)
Where: E - daily energy load demand (Wh/day); G - solar irradiance in STC conditions (Wh/m²); HTOT - solar incident irradiation in the surface of the PV modules (kWh/m².day); PR - performance ratio
The daily energy load demand (E) was calculated considering the monthly average consumption of each School and is presented in Table 4.
The solar irradiance in STC conditions (G) is 1,000 Wh/m². As recommended by Pinho and Galdino
[12]
, in order to achieve the optimal solar electric generation throughout the year, the tilt angle of the photovoltaic array system design should be the same as the local latitude and it should be oriented facing the equatorial line.Curitiba is located at latitude 25°25' South; longitude 49°16' West. Therefore, to calculate the solar incident irradiation in the surface of the PV modules (HTOT) it was
established that all the array systems would be installed facing north with a 25º inclination. In the analysis it was considered that there would be no shaded areas in the systems during operating time.
The average irradiation data for the inclined plane at 25° facing north was collected from the software SunData
[13]
, resulting in a 4.62 kWh/m²/day. The performance ratio (PR) adopted was 0.75.Therefore, the power of the photovoltaic system for each school was calculated using Equation 1.
For dimensioning the PV system, the calculation was made considering the model JKM320PP from Jinko Solar, a polycrystalline module with 72 cells, an output of 320 Wp and an efficiency of 16.49% under STC conditions.
Then, it was verified the area necessary to the installation of each system, according to the size of the array of the modules, and for that Equation 2 was used
[14]
.𝑛𝑝=𝐴𝑚𝑃∗1000𝑃𝑉 (2) (kWp); Where: 𝐴𝑛𝑝– conversion efficiency (%); 𝑃𝑃𝑉– power of the system to be installed
𝑚– photovoltaic module required area (m²)
To verify if the area available in each school roof was big enough to fit the photovoltaic module area (Am), the distance measurement tool from Google Maps was applied. All
schools presented area availability for the system, as shown in Table 2.
Next, the total annual amount paid by the schools regarding the electricity consumption was estimated using Equation 3.
𝑉𝑎= 𝑇𝑚𝑚∗ 𝐶𝑚𝑚∗ 𝑛 (3) monthly consumption (kWh); n Where: – annual value (R$); 𝑇𝑚𝑚– number of months = 12 – mean monthly tariff (R$/kWh); 𝐶𝑚𝑚 – mean
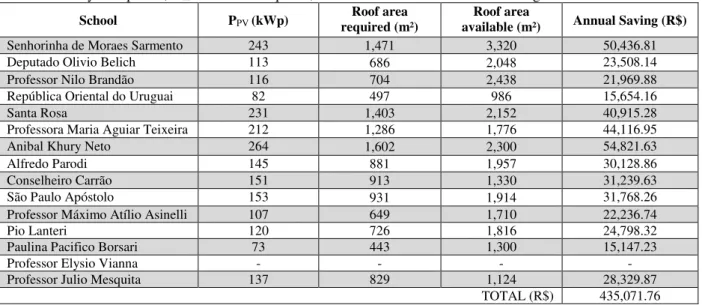
Table 2 - PV system power, Am - roof area required, roof area available and annual saving estimation
School PPV (kWp)
Roof area required (m²)
Roof area
available (m²) Annual Saving (R$)
Senhorinha de Moraes Sarmento 243 1,471 3,320 50,436.81
Deputado Olivio Belich 113 686 2,048 23,508.14
Professor Nilo Brandão 116 704 2,438 21,969.88
República Oriental do Uruguai 82 497 986 15,654.16
Santa Rosa 231 1,403 2,152 40,915.28
Professora Maria Aguiar Teixeira 212 1,286 1,776 44,116.95
Anibal Khury Neto 264 1,602 2,300 54,821.63
Alfredo Parodi 145 881 1,957 30,128.86
Conselheiro Carrão 151 913 1,330 31,239.63
São Paulo Apóstolo 153 931 1,914 31,768.26
Professor Máximo Atílio Asinelli 107 649 1,710 22,236.74
Pio Lanteri 120 726 1,816 24,798.32
Paulina Pacifico Borsari 73 443 1,300 15,147.23
Professor Elysio Vianna - - - -
Professor Julio Mesquita 137 829 1,124 28,329.87
TOTAL (R$) 435,071.76 Source: The authors
Thence, in the case of the installation of the PV systems, considering the whole demand would be supplied by it, the values set out would no longer be used to pay for electricity bills. The estimated amount for the total savings in present currency is R$ 435,071.76 a year, which corresponds to an average annual saving of R$ 29.90 and R$ 863.88, per student and per class, respectively. This represents a relief of 2.684 GWh from the grid demand, considering only the 14 schools that were assessed, out of the potential 163 others, run by the government, only in the city of Curitiba.
The average power of the photovoltaic systems calculated for the installation is 150 kWp. According to the Greener report
[15]
, the average unitary price for a Wp for systems of 150 kWp is R$ 4.31 R$/Wp. In this way, an estimation for the average cost of each system is around R$ 646,500.00. The Empresa de Pesquisa Energética - EPE[16]
considers the yearly maintenance cost of a solar photovoltaic system to be low, not over 1% of the total amount of its implementation value. Thus, in this case, the annual average maintenance cost for all the systems would be under R$ 6,465.00, per school.DISCUSSION
By incorporating the PV systems to the assessed Schools, it is intended to reduce the electric energy demand on the part of the State, relieving the demand in the Brazilian interconnected electric system. Considering the future scenario around 2050, when energy consumption is foreseen to almost double, going from 600 TWh/year to 1,024 TWh/year, according to EPE
[17]
, every measure towards electric demand reduction should be considered.Along with that, these installations would provide approximately R$ 435 thousand in savings. This amount could be redirected to provide for the implementation of sustainability educational programs within the Schools, as the project developed by Greenpeace Brazil in 2015 and 2017.
CONCLUSION
The regulation of the PV systems collaborated to the exponential growth in the number of units installed in Brazil in the last few years. The renewable and alternative sources of energy have become increasingly attractive for sustainability in its three pillars: environmental, economic and social.
Grid-connected solar photovoltaic systems for power supply do not contribute to Greenhouse Gas Emissions during power generation; still, they provide the possibility for reduction of the cost of energy; they create job opportunities both directly and indirectly; besides the other social and cultural aspects, due to the contact with technology.
The potential for the implementation of a PV system in 14 schools located at the Administração Regional do Cajuru, comprised by the neighborhoods of Cajuru, Capão da Imbuia, Jardim das Américas and Uberaba, was attested in the present study. With the installation of this technology an annual saving of over R$ 435 thousand was predicted for the current electrical consumption. In the case of the State of Paraná, one of the four remaining State that is still keeping the taxes (ICMS) charged over the energy injected into the grid. That means that the saving costs could be even greater if the tax was suppressed, like in the other 23 Brazilian States.
The amount that would be no longer spent with electricity bills could be invested in educational programs and extracurricular activities within the schools, based on sustainability principles.
The online data base had only made a few months of information available, from January to May 2017. For a more consistent analysis, a scenario with a larger historic series of data should be made available. A 3-year series, or at least a 12 month period, is usually considered to evaluate the demand curve and to optimize the sizing of the system. Yet, regarding the design of the array of the modules, as a suggestion for further research, it is recommended to verify the real slope of the roofs and their orientation towards north, as well as the existence of shaded areas over it. Also, there is a need to create an index to assess the consumption within the schools.
All considered, a great potential was noticed among this sector, so as schools can achieve their self-sufficiency and thus help mitigate social and environmental impacts of energy generation. Although these two aspects of sustainability are hard to measure, if compared to the economic pillar, they should be taken into consideration as variables to the future analysis of technical solutions.
REFERENCES
1- Agência Nacional De Energia Elétrica (Brazil). Resolução n°. 482, de 17 de abril de 2012. Estabelece as condições gerais para o acesso de micro geração e minigeração distribuída aos sistemas de distribuição de energia elétrica, o sistema de compensação de energia elétrica, e dá outras providências. Diário Oficial; 2012 Apr 19.
2- Agência Nacional De Energia Elétrica (Brazil). BIG: banco de informações de geração: fontes de energia exploradas no Brasil [Internet]. 2017 [cited 2017 Jul 3]. Available from: http://www2.aneel.gov.br/aplicacoes/capacidadebrasil/capacidadebrasil.cfm.
3- Campos HMVB. Geração distribuída de energia solar fotovoltaica na matriz elétrica de Curitiba e região: um estudo de caso [dissertation]. PPGEC UTFPR; 2015.
4- Alencar CA, Urbanetz Junior J. Usinas solares fotovoltaicas no brasil: panorama atual e perspectivas futuras. In: 12th IEEE/IAS International Conference on Industry Applications, 2016. 2016 Nov 20-23, Curitiba: INDUSCON; 2016.
6- Secretaria do Estado da Educaçao do Paraná (Brazil). SEED em números: Consumo Total de Energia Elétrica das Escolas do Estado por Mês - Ano de 2016 [Internet]. 2017 [cited 2017 Jun 25]. Available from: http://www4.pr.gov.br/escolas/numeros/frame_geralluz.jsp?ano=2016 7- Greenpeace. Evento comemora um ano de painéis solares em escola de Uberlândia [Internet]. 2016 Apr 16 [cited 2017 Jun 18]. Available from:
http://www.greenpeace.org/brasil/pt/Noticias/Evento-comemora-um-ano-de-paineis-solares-em-escola-de-Uberlandia/
8- Borges A. Energia solar começa a ganhar espaço em escolas públicas. 2017 Jan 16 [cited 2017 Jun 15]. In: O Estado de São Paulo [Internet]. Brasília, 2017. Available from:
http://economia.estadao.com.br/noticias/geral,energia-solar-comeca-a-ganhar-espaco-em-escolas-publicas,10000100462
9- Benelli AC. Setor de energia solar promete criar 100 mil novos empregos no Brasil até 2020. 2016 Nov 16 [cited 2017 Jun 15]. In: Gazeta do Povo [Internet]. Curitiba, 2016. Available from: http://www.gazetadopovo.com.br/economia/energia-e-sustentabilidade/setor-de-energia-
solar-promete-criar-100-mil-novos-empregos-no-brasil-ate-2020-e11hokzez2v883qx8ipp0wfun
10- Gil AC. Como elaborar projetos de pesquisa. São Paulo: Atlas; 2010.
11- Instituto De Pesquisa E Planejamento Urbano De Curitiba (Brazil). Pobreza: Análise do Censo 2010. Curitiba: IPPUC, 2012 [Internet]. 2012 [cited 2017 Jun 26]. Available from: http://www.ippuc.org.br/
12- Pinho JT, Galdino MA. Manual de Engenharia para Sistemas Fotovoltaicos. Rio de Janeiro, RJ: CEPEL – CRESESB; 2014.
13- Centro de Referência para Energia Solar e Eólica Sérgio Brito (Brazil). Potencial Solar – SunData, 2017 [Internet]. 2017 [cited 2017 Jun 25]. Available from: http://www.cresesb.cepel.br/index.php?section=sundata
14- Villalva MG. Energia Solar Fotovoltaica - Conceitos e Aplicações. São Paulo, 2015. 15- Greener. Análise do Mercado Fotovoltaico de Geração Distribuída – 2º Semestre de 2017 [Internet]. 2017 Jul [cited 2017 Jul 15]. Available from: http://www.greener.com.br/wp- content/uploads/2017/07/anlise-estratgica-do-mercado-fotovoltaico-de-gerao-distribuda-2o-semestre-2017-greener.pdf
16- Empresa de Pesquisa Energética (Brazil). Nota Técnica EPE: Análise da Inserção da Geração Solar na Matriz Elétrica Brasileira. Rio de Janeiro; 2012.
17- Empresa de Pesquisa Energética (Brazil). Nota Técnica DEA 13/14: Demanda de Energia 2050. Rio de Janeiro; 2014.