ASSESSMENT OF SFRC FLAT SLAB PUNCHING BEHAVIOUR – PART I: MONOTONIC VERTICAL LOADING
Nuno D. Gouveia
PhD student, Department of Civil Engineering, Faculdade de Ciências e Tecnologia, Universidade NOVA de Lisboa, CERIS, 2829-516 Caparica, Portugal, [email protected]
Duarte M. V. Faria
Structural Engineer, Lausanne, Switzerland, [email protected]
António Pinho Ramos
Professor, Department of Civil Engineering, Faculdade de Ciências e Tecnologia, Universidade NOVA de Lisboa, CERIS, 2829-516 Caparica, Portugal, [email protected]
Corresponding author:
Nuno D. Gouveia
Address: Universidade NOVA de Lisboa, Faculdade de Ciências e Tecnologia, Departamento de Engenharia Civil, Campus da Caparica, 2829-516 Caparica, Portugal. Tel: +351 212 948 580 Fax: +351 212 948 398 email: [email protected]
Abstract
This paper presents a study of the behaviour and load capacity of Steel Fibre Reinforced Concrete (SFRC) flat slabs under monotonically increased concentrated vertical loads. The SFRC was used only in the local region of the slab-column connection, as the rest of the slab was cast using normal concrete (NC) without fibres. The six experimental test specimens had a thickness of 150 mm with different longitudinal reinforcement ratios, using a non-uniform distribution over the slab width. The concretes used were made with different Dramix® 4D 65/60 BG steel fibre contents (0%, 0.5 %, 0.75% and 1.0% volume
content). The slab tests were complemented by flexural tests on notched-beams. This made it possible to determine the tension behaviour of the different concretes used, through a linear post-cracking behavior and inverse analysis. The inverse analysis made it possible to define the stress-crack opening relationship that characterize the tension behaviour of SFRC and to relate it to the observed behaviour and load capacity of the tested slabs. The tests results show that the tensile behaviour of the SFRC plays an important role in the behavioural and load capacity of the slabs and that it can be considered relevant to physically based models.
Highlights:
Improvement in punching shear and deformation capacity of SFRC slabs;
Benefits obtained in terms of ductility are extremely important in flat-slabs to avoid the brittle failure mechanisms;
The presence of SFRC in the connection zone increases the moment and deformation capacity of slab-column connections.
Keywords: Punching; Failure; Fibre-reinforced concrete; Slabs & plates; Testing,
Notation:
cc factor that accounts for long term effects on the compressive strength and
unfavorable effects from the way load is applied
β1 factor relating depth of equivalent rectangular compressive stress block to
neutral axis depth
δ deflection
δmáx,beam maximum central deflection of the beam
δu,exp slab displacement at maximum load capacity
εy yield extension of longitudinal reinforcement
ρf fibre volume content
ρ longitudinal reinforcement ratio
uniaxial tensile stress
ϕ experimental load capacity divided by estimated flexural capacity
slab rotation
u,exp slab rotation at maximum load capacity
ai parameter of the adopted σ-w relationship
b0 perimeter of the critical section
bq horizontal distance from the column face to the applied load point
c column width
cSFRC SFRC region width
ci parameter of the adopted σ-w relationship
d effective depth
dg maximum diameter of the aggregate
dg0 reference aggregate size
fccm mean value of concrete compression strength on cubes (150x150x150mm)
fctm,sp mean value of concrete split tensile strength on cylinders (300x150 mm)
fct2,f tensile stress in fibre reinforced concrete for w=3mm
fL average limit of proportionality
fR,j flexural tensile strength beam corresponding to CMODj
ft tensile strength of matrix
fy average steel yield strength (top longitudinal reinforcement)
h slab depth
hsp distance between the tip of the notch and the top of the test specimen in
the mid-span section
mR nominal moment capacity per unit width
mR,NC nominal moment capacity per unit width for normal concrete
mR,SFRC nominal moment capacity per unit width of SFRC
r0 radius of the critical shear crack
rc column radius
rq radius of load introduction at the perimeter
rs radius of isolated slab element
rSFRC radius of the SFRC zone
w crack opening
wu ultimate crack opening
E deformation energy capacity of slab specimens
Ec mean value of concrete modulus elasticity
F load
Pexp experimental load values of notched-beam tests
Pmod model load values of notched-beam tests
V shear force
VR punching shear strength
Vu,exp experimental failure load of slab
CMOD crack mouth opening displacement
MC2010 Model Code 2010
NC normal concrete
FRC fibre reinforced concrete
1. INTRODUCTION
The use of flat slabs in buildings is widespread nowadays as, for this structural solution, the slabs are directly supported by the columns, without the need for beams, which has inherent advantages. However, this type of construction has also some disadvantages; the punching phenomenon being one of the most important. Punching failures are brittle, occurring suddenly without warning and therefore need to be prevented. Further, poor shear design of flat slabs may lead to a progressive collapse, when lower floors fail to support the impact loading initiated from collapsed floors above.
Several alternatives for increasing the punching shear resistance of slab-column have been evaluated in the past decades, namely, bent-up bars (Islam and Park, 1976), stirrups (Islam and Park, 1976 and Lips et al, 2012), shearheads (Corley and Hawkins, 1968), shear studs (Dilger and Ghali,1981 and Lips et al, 2012), post-installed shear bolts (Inácio et al, 2012 and Silva et al, 2013), using prestress (Faria et al, 2011; Ramos et al, 2011; Clément at al, 2014 and Ramos et al, 2014), using bonded fibre reinforced polymers (Faria et al, 2014) or using High Performance Concretes (Inácio et al, 2015).
Another solution that could present great potential for the improvement of punching capacity is the use of discontinuous, randomly oriented fibers, which can be added to the concrete in the connection region. Because of their random orientation, this type of reinforcement has the advantage of being effective for bridging cracks in any direction. This solution is potentially more cost-effective and less “intrusive” when compared to the ones previously mentioned, avoiding costs for handling and placing of reinforcement. Some research investigations have been performed in the last 30 years regarding the monotonic punching behavior of slab-column connections using FRC (Harajli et al, 1995; Cheng and Parra-Montesinos, 2010; Nguyen-Minh et al, 2012 and Gouveia et al, 2014). Results have clearly shown that the addition of modest amounts of deformed steel fibers to the concrete leads to an increase in the punching capacity and ductility of the slab. The main objective of this research was to investigate the behaviour and load capacity of SFRC flat slab-column connections subjected to combined constant vertical and cyclic horizontal loading, simulating actions induced by earthquakes, which will be exhibited in Part II (Gouveia et al, 2018). However, before evaluating the behaviour of flat slab-column connections under combined vertical and cyclic horizontal loading, it was decided to investigate slabs subjected to monotonic vertical loads first, using the same
longitudinal reinforcement ratio and layout and the same concrete mixes. Since the SFRC is a more expensive material to produce than normal concrete (NC), its use should be rationalized to be more cost-effective. Having this in mind the SFRC was only used in the area of the slab-column connection, whilst the rest of the slab was cast using NC. The main mechanical characteristics of the SFRC mixtures and the behaviour and load capacity of the slabs was evaluated.
2. EXPERIMENTAL PROGRAM 2.1 Materials
For this study different types of concrete mixtures with and without steel fibres were used. The SFRC mixtures used different fibres contents: 0.5%; 0.75% and 1.0% by volume and were denominated: F0.5; F0.75 and F1.0, respectively, where the number after the letter F corresponds to the fibre content. Table 1 presents the concrete mixture compositions.
Table 1: Concrete mixtures compositions.
Mixture F0 F0.5 F0.75 F1.0 Cement (kg/m3) 430 430 430 430 Sand 0/2 (kg/m3) 375 375 375 375 Sand 0/4 (kg/m3) 445 445 445 445 Coarse aggregate 6/12 (kg/m3) 455 450 450 445 Coarse aggregate 11/22 (kg/m3) 440 435 430 430 Water (kg/m3) 158 158 158 158 Plasticizer (kg/m3) 5.2 5.2 5.2 5.2 Fibres (% vol.) 0 0.5 0.75 1.0
The cement used was Portland cement CEM II/B-L 32.5 N in conformity with EN 197-1 (2011). Two fine aggregates (sand 0/2 and 0/4 mm) and two coarse aggregates (crushed limestone 6/12 and 11/22 mm) were used in accordance with EN 12620 (2008). The plasticizer was Sika Viscocrete® 3008, in accordance with EN 934-2 (2012). The
steel fibres used were hooked-end Dramix® 4D 65/60 BG, 60 mm long, with a diameter
of 0.90 mm and a tensile strength of 1500 MPa conforming to EN 14889-1 (2006). The steel longitudinal reinforcement rebars used in slab specimens were 10, 12 and 16 mm in diameter. Tensile tests were performed on steel coupons taken from the same
batch, were the average values of the steel yield strength (fy) of rebars for longitudinal
reinforcement were 534, 530 e 529 MPa for 10, 12 and 16 mm in diameter, respectively.
2.2 Concrete Compressive and Tensile Strengths
For each SFRC mixture, six cubes (150x150x150 mm), six cylinders (ϕ150x300 mm) and nine notched beams (600x150x150 mm) were cast and tested, to determine the mechanical properties of the concrete.Tests were carried out approximately 60 days after the specimens were cast and on the same days of the slab specimen tests. The average concrete compressive strengths of cubes and cylinders, tensile splitting strengths and modulus of elasticity are summarized in Table 2.
Table 2: Concrete compressive and tensile splitting strength and modulus of elasticity.
Misture 𝒇𝒄𝒄𝒎 (MPa) 𝒇𝒄𝒎 (MPa) 𝒇𝒄𝒕𝒎,𝒔𝒑 (MPa) Ec (GPa) F0 63.3 66.3 7.4 42.4 F0.5 70.7 69.7 8.2 42.8 F0.75 70.7 67.6 8.7 44.2 F1.0 73.5 66.0 10.7 42.8
fccm - mean value of concrete compression strength on 150 mm sided cubes (150x150x150 mm);
fcm - mean value of concrete compression strength on cylinders (ϕ150x300 mm);
fctm,sp - mean value of concrete split tensile strength on cylinders (ϕ150x300 mm);
Ec - mean value of concrete modulus of elasticity.
2.3 Concrete Tensile Behaviour and Inverse Analysis
The most common tests to determine the tensile behavior of SFRC are direct tension tests and flexural tests. As direct tension tests are difficult to carry out, most tests are performed as flexural tests on a notched-beam. In this study it was decided to perform tests on notched beams according to the fib Model Code (2013), which covers this type of test to determine the tensile behaviour of SFRC. Consequently, tests were carried out on a SFRC three-point loading notched beam according to EN 14651 (2005) in the Bekaert concrete laboratory in Zwevegem, Belgium. Figure 1 shows the test set-up of notched beams used. The notched-beams measured 600×150×150 mm, with a sawcut (notch) of 25 mm in the middle of the beam, and they were supported by two steel cylinders positioned 500 mm apart (Figure 1). The test is deflection controlled by the speed of the LVDT measurement device: a) deflection from 0 to 0.1 mm: 0.05 mm/min; b) deflection from 0.1 to 3.5 mm: 0.2 mm/min. The test stops at a deflection of 3.5 mm.
Considering the results of the notched-beam tests for each mixture, the average limit of proportionality (fL)and residual flexural strength (fR,j) according to EN 14651 (2005) were
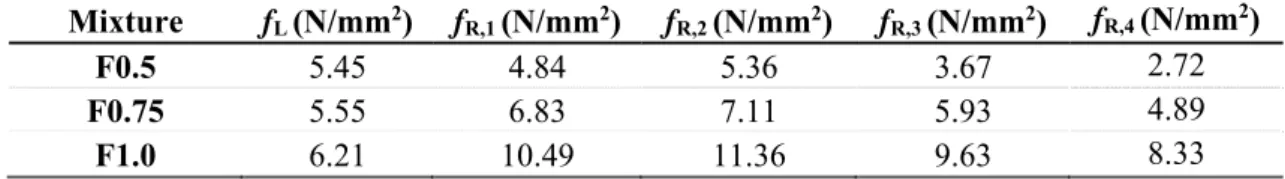
obtained. Table 3 and Figure 2 shows the respective values of fL and fR,j for each mix. Table 3: Average limit of proportionality and residual flexural strength of notched-beams.
Mixture fL (N/mm2) fR,1 (N/mm2) fR,2 (N/mm2) fR,3 (N/mm2) fR,4 (N/mm2)
F0.5 5.45 4.84 5.36 3.67 2.72
F0.75 5.55 6.83 7.11 5.93 4.89
F1.0 6.21 10.49 11.36 9.63 8.33
From Figure 2 it is possible to conclude that the increase in fibre volume content implied a slight increase in the average limit of proportionality and a more pronounced increase for the average residual flexural strength of notched-beams.
According to fib Model Code (2013), a stress () - crack opening (w) constitutive laws in uniaxial tension can be defined for the post-cracking behavior of SFRC. These laws can be deduced from the bending test results. In this paper it was decided to use a linear post-cracking behavior (Eq. 1).
𝜎 𝑤 0.45 ∙ 𝑓 𝑤
2.5 ∙ 0.45 ∙ 𝑓 0.5 ∙ 𝑓 0.2 ∙ 𝑓 (1)
where fR1 and fR3 are the residual flexural strengths for CMOD1 = 0.5 mm and
CMOD3 = 2.5 mm, respectively, and wu is the ultimate crack opening. Figure 3 presents
the respective stress-crack opening relationships for each mix.
Inverse Analysis
The inverse analysis was conducted adopting the formulation proposed by Zhang and Stang (1998), assuming a quadrilinear type σ-w relation. The tensile behaviour of SFRC can be described in terms of a tensile stress versus the opening of a crack in the tensile area (Zhang and Stang, 1998; Kooiman et al, 2000; Voo and Foster, 2004; Sousa and Gettu, 2006 and De Montaignac et al, 2012), where fibres bridge both sides of a crack. So, a quadrilinear model was adopted in this study for the σ-w relationship, described by Eq. (2):
𝜎 𝑤 𝑓 𝑎 𝑐 𝑤 𝑎 𝑐 𝑤 𝑎 𝑐 𝑤 𝑎 𝑐 𝑤 𝑖𝑓 𝑤 𝑤 𝑖𝑓 𝑤 𝑤 𝑤 𝑖𝑓 𝑤 𝑤 𝑤 𝑖𝑓 𝑤 𝑤 𝑤 (2)
The σ-w relationship is determined through an inverse analysis using the experimentally obtained response of the SFRC notched beams. In an inverse analysis, the σ-w relationship is obtained in such that it allows the best simulation of the element response, in this case, the load-central deflection relationship obtained experimentally. The shape of the σ-w relationship is prescribed and during the inverse analysis a load-central deflection relationship is obtained and compared with the corresponding experimental result. The tensile stress-crack opening (σ-w) is modified through an iterative process, until the load-displacement curve predicted by the model is close to the measured one. In this study the optimization of the model was performed using a derivative-free method, through a solver for constrained nonlinear optimization problems, named SID-PSM (Custódio and Vicente, 2007). SID-PSM corresponds to the implementation of a generalized pattern search method, combining its global convergence properties with the efficiency of the use of quadratic polynomials (Custódio et al, 2010) to enhance the search step and of the use of simplex gradients for guiding the function evaluations of the poll step.
The optimization of the σ-w relationship is performed by minimizing the error of load-central deflection relationship, through the function exhibited in Eq. (3):
𝑒𝑟𝑟𝑜𝑟 , 𝑃 𝛿 𝑃 𝛿 𝑑𝛿 (3)
where 𝛿 , is the maximum central deflection of the beam and 𝑃 and 𝑃 are
the experimental and model load values corresponding to the same abscissa. An error was obtained below 2% for all curves.
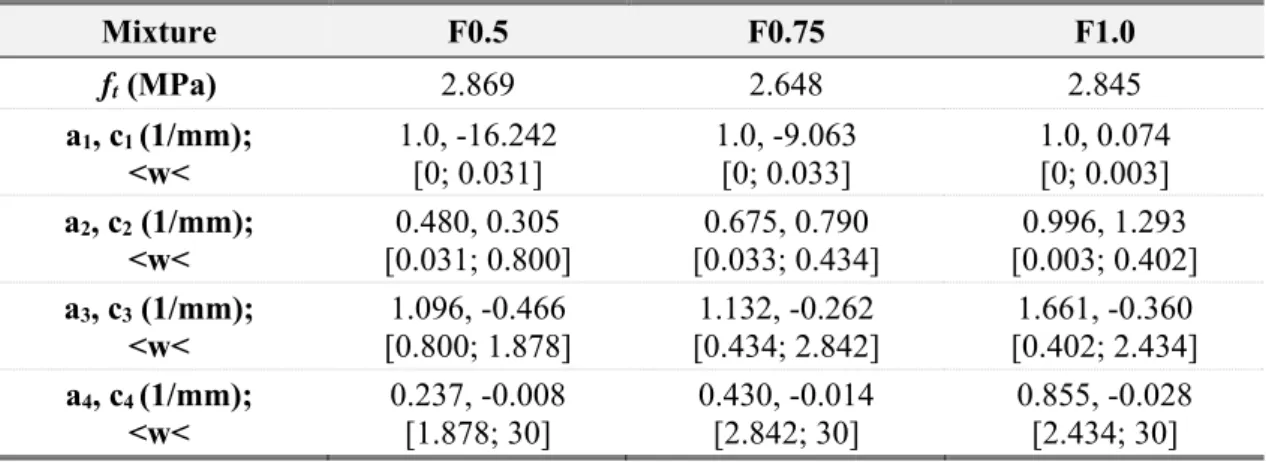
Figure 4 presents the load-deflection relationships of experimental and model curves obtained in this study. Table 4 and Figure 5 presents the σ-w relationship adopted in this study from inverse analysis that represents the tensile behaviour of SFRC specimens.
Table 4: Material parameters used in four linear models for σ-w relationships obtained from notched beams. Mixture F0.5 F0.75 F1.0 ft (MPa) 2.869 2.648 2.845 a1, c1 (1/mm); <w< 1.0, -16.242 [0; 0.031] 1.0, -9.063 [0; 0.033] 1.0, 0.074 [0; 0.003] a2, c2 (1/mm); <w< 0.480, 0.305 [0.031; 0.800] 0.675, 0.790 [0.033; 0.434] 0.996, 1.293 [0.003; 0.402] a3, c3 (1/mm); <w< 1.096, -0.466 [0.800; 1.878] 1.132, -0.262 [0.434; 2.842] 1.661, -0.360 [0.402; 2.434] a4, c4 (1/mm); <w< 0.237, -0.008 [1.878; 30] 0.430, -0.014 [2.842; 30] 0.855, -0.028 [2.434; 30] ft - tensile strength of matrix;
w - crack width;
ai, ci - parameters of the adopted σ-w relationship.
The results exhibited in Figure 5 show a relatively sudden decrease in the tensile stress after cracking for mixtures F0.5 and F0.75, followed by a hardening stage up to the maximum stress. Mixture F1.0 had a hardening behaviour for the tensile stress after cracking. Afterwards, there is a gradual softening response. Three important advantages of the exhibited inverse analysis method are that they better describe all the post-cracking behavior of SFRC, can be applied for other types of flexural tests with respective adaptations, and more importantly, it provides fracture energy values closer to the real ones. However, although useful in research for assessing the influence of using refined constitutive models in the modelling of flexural and shear behaviour, this approach was also some practical limitations, as the results are only valid for a particular concrete mix.
2.4 Flat Slab Specimens
The six slab specimens were cast with the concrete mixtures described above, one with no fibres added, two with the F0.5 concrete mixture, two with F0.75 and one with F1.0. Besides the variation of the fibre volume content, the longitudinal reinforcement ratio was also changed. Slab specimens were named F0_R1.0, F0.5_R1.0, F0.5_R1.5, F0.75_R1.0, F0.75_R1.5 and F1.0_R1.0, where the number after the letter F denotes the fibre content and the number after letter R denotes the flexural reinforcement ratio in the slab region within 3d from the column.
Among the six slab specimens, five were cast with SFRC around the central perimeter of the slab-column connection zone with a square area of 0.9 x 0.9 m (which is about the
column size plus 3d for each side) in order to guarantee a failure through the SFRC zone, whilst the remaining portion was cast with normal concrete without fibres. First the SFRC was poured in the middle of the slab. The zone was limited by a steel mesh that served as both formwork and to improve the interface behaviour between the two different concretes. The normal concrete without fibres was then poured to cast the outer region of the slab specimens. The remaining specimen was a reference slab (F0_R1.0), which was constructed using only normal concrete without fibres. In Figure 6 it is possible to observe both regions of the slabs.
The bottom steel reinforcement was similar in all the slab specimens and consisted of 10 mm rebars spaced every 10 mm, uniformly distributed over the slab at right angles to each other. The top longitudinal reinforcement rebars were non-uniformly distributed throughout the slab. The specimens F0_R1.0, F0.5_R1.0, F0.75_R1.0 and F1.0_R1.0 were reinforced with 16 x 12 mm rebars at right angles to each other while in specimens F0.5_R1.5 and F0.75_R1.5 14 x 16 mm rebars were used in both directions. The concrete cover of both the top and bottom longitudinal reinforcement was 20 mm. Figure 7 presents the longitudinal reinforcement configuration used.
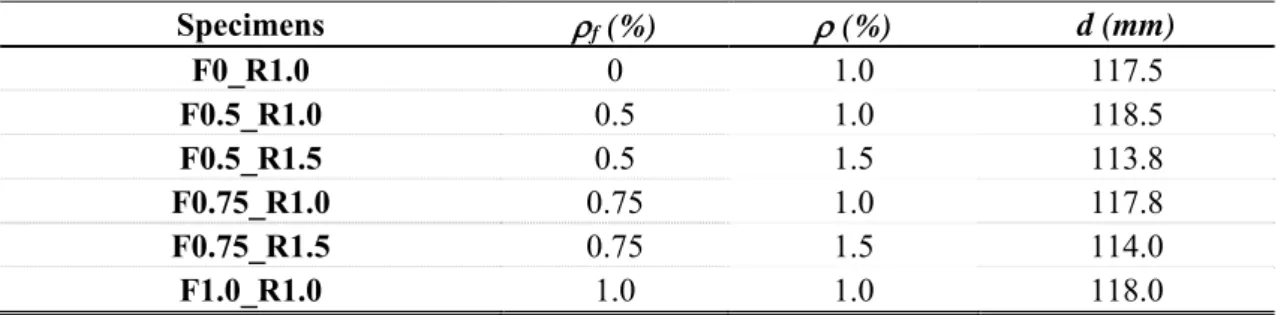
Before casting, the actual effective depths of the longitudinal reinforcement were measured, and later confirmed in the slab saw cuts. Table 5 presents the average effective depth (for both reinforcement directions).
Table 5: Average effective depth of longitudinal reinforcement of slab specimens.
Specimens f (%) (%) d (mm) F0_R1.0 0 1.0 117.5 F0.5_R1.0 0.5 1.0 118.5 F0.5_R1.5 0.5 1.5 113.8 F0.75_R1.0 0.75 1.0 117.8 F0.75_R1.5 0.75 1.5 114.0 F1.0_R1.0 1.0 1.0 118.0
f – fibre reinforcement ratio;
– longitudinal reinforcement ratio within 3d of column face;
d – average effective depth.
2.5 Slab Test Setup
Slab specimens were representative of the slab area located around an interior column up to the zero bending moment lines and were tested under a concentrated load. This load was applied in the center of the specimens by a hydraulic jack with a 250x250 mm steel
plate located at the bottom of the specimens. The tests were performed under load control by increasing the applied force at a constant rate of 285 N/s up to failure. The specimens, working as simply supported, were connected to the strong floor of the laboratory by means of eight strands and four spreader beams. Figure 8 shows the test setup.
Eight load cells were used to quantify the vertical load applied to the specimens, one at each support point, located at the zero bending moment line (Figure 9). Eleven displacement transducers were also used to measure the vertical displacements (Figure 9). Eight strain gauges were glued to four rebars of the top longitudinal reinforcement with the greatest effective depth. Two diametrically opposed strain gauges at mid-height were glued to each instrumented rebar. The position of strain gauges in specimens are shown in Figure 7.
3. ANALYSIS OF THE EXPERIMENTAL RESULTS FROM THE SLAB TESTS 3.1 Load capacity and Failure Mode
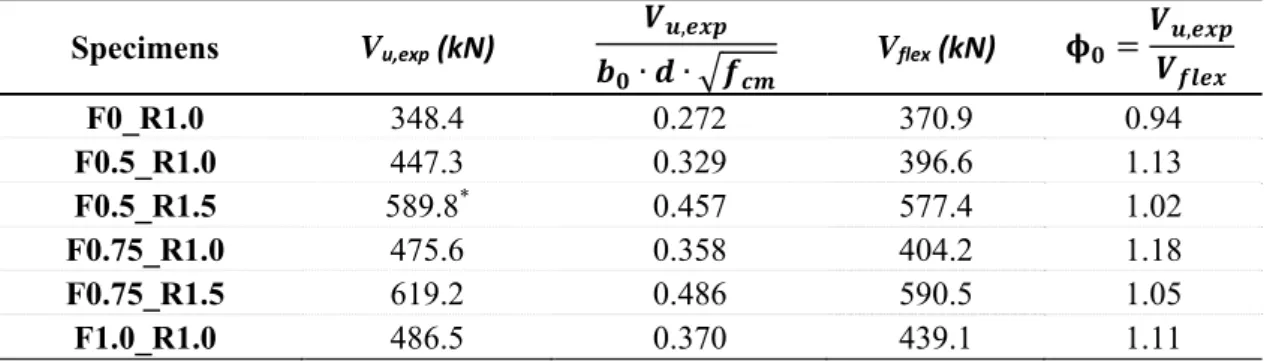
Table 6 presents the experimental failure load and the flexural load capacity of slab specimens calculated from the governing yield-line mechanisms for each specimen. To obtain the normalized punching shear stress for each slab specimen, the respective maximum load is divided by the square root of the concrete cylinder strength and by the critical perimeter at d/2 from the faces of the column and also by the effective depth of slab. Table 6 also shows the load normalized by the flexural load capacity from the adopted yield-line mechanism.
Table 6: Experimental failure load and flexural load capacity.
Specimens Vu,exp (kN) 𝑽𝒖,𝒆𝒙𝒑 𝒃𝟎∙ 𝒅 ∙ 𝒇𝒄𝒎 Vflex (kN) 𝛟𝟎 𝑽𝒖,𝒆𝒙𝒑 𝑽𝒇𝒍𝒆𝒙 F0_R1.0 348.4 0.272 370.9 0.94 F0.5_R1.0 447.3 0.329 396.6 1.13 F0.5_R1.5 589.8* 0.457 577.4 1.02 F0.75_R1.0 475.6 0.358 404.2 1.18 F0.75_R1.5 619.2 0.486 590.5 1.05 F1.0_R1.0 486.5 0.370 439.1 1.11
Vu,exp – experimental load capacity of slab specimens;
Vflex – flexural capacity of slab specimens;
𝛟𝟎 – experimental load capacity divided by estimated flexural capacity;
* – experimental failure load limited by premature shear failure at one edge loading point.
The assessment of the flexural capacity of slab specimens was conducted by the yield-line mechanism. The assumed governing mechanism has yield yield-lines in both directions,
considering in this case that the specimens have equal displacements applied at eight points on the zero bending moment line (Figure 10), close to the specimen edge (statically undetermined elements). So, the flexural capacity (Eq. 4) can be estimated approximately as:
𝑉 8 ∙ 𝐵
2 ∙ 𝑏 𝑏 ∙ 𝑚 (4)
The nominal moment capacity mR (Eq. 5) per unit width is given by two contributing
zones, the SFRC and normal concrete zones, as:
𝑚 𝑚 , ∙ 𝑐 𝑚 , ∙ 𝐵 𝑐
𝐵 (5)
According to Maya et al (2012), the nominal moment capacity per unit width of SFRC (mR,SFRC) (Eq. 6) is: 𝑚 , 𝑓 ∙ 𝜌 ∙ 𝑑 ∙ 1 𝛽2 ∙ 𝑓 ∙ 𝜌 𝑓 , ∙ ℎ 𝑑 𝛼 ∙ 𝑓 𝑓 , 𝑓 , 2 ∙ ℎ ∙ 1 𝑓 ∙ 𝑑 ∙ 𝜌 ℎ 𝑓 , 𝛼 ∙ 𝑓 𝑓 , ∙ 1 𝑓 ∙ 𝑑 ∙ 𝜌 ℎ 𝑓 , 𝛼 ∙ 𝑓 𝑓 , ∙ 1 𝛽 (6)
And for the NC, the nominal moment capacity per unit width (mR,NC) (Eq. 7) is:
𝑚 , 𝑓 ∙ 𝜌 ∙ 𝑑 ∙ 1
𝛽 ∙ 𝑓 ∙ 𝜌
2 ∙ 𝑓 (7)
In equations (6) and (7) the parameter 𝛽 defines the depth of the equivalent rectangular stress block, which according to fib Model Code (2013) is: 𝛽 0.80 𝑓 50 /400; 𝛼 is a coefficient taking account of long term effects on the compressive strength and of unfavourable effects from the way the load is applied (𝛼 = 1.0 [19]) and the 𝑓 , is
the tensile stress in SFRC for a crack opening of 3 mm (Maya et al, 2012).
The results exhibited in Table 6 show that the addition of SFRC to the slab-column connection zone led to an increase in load capacity. Comparing the specimens with 1.0% of longitudinal reinforcement, an increase of up to 36% was observed in load capacity when changing the fibre content from 0 to 1.0%. As expected the two specimens with 1.5% of longitudinal reinforcement exhibited higher load capacity in comparison with the remaining specimens.
Comparing the three SFRC specimens with 1.0% of longitudinal reinforcement, an increase of about 12% in load capacity was obtained when the fibre volume content
changed from 0.5% to 1.0%. The variation in longitudinal reinforcement of 1.0% to 1.5%, for the same fibre volume content, resulted in an increase of normalized load capacity of about 36-39%.
After testing, all the slabs were saw cut at the mid-point of the central loaded area, in the perpendicular direction of the greatest effective depth of the longitudinal reinforcement. This was to observe the failure surface. The experimental failure shape of each specimen is exhibited in Figure 11.
Specimen F0_R1.0, experienced a brittle punching failure while specimen F0.5_R1.0 experienced a flexural-punching failure which was more ductile than the F0_R1.0 specimen. The specimens F0.75_R1.0 and F1.0_R1.0 reached their flexural capacity, where the increase in punching strength permitted the specimens to develop a failure mode that was influenced by their flexural capacity leading to a typical flexural failure. This type of failure was even more ductile than the flexural-punching failures.
The slabs with 1.5% of longitudinal reinforcement were more ductile than the reference specimen. The specimen F0.75_R1.5 experienced a punching failure, while failure of specimen F0.5_R1.5 was by shear punching at one of the eight edge supports. However, observing the high level of cracking and deformation of specimen F0.5_R1.5 (Figure 11 (c)), it was evident that this specimen was near its load and deformation capacity limit. Also, an inclined crack, which would eventually lead to a punching failure can be noticed in the saw cuts (Figure 11 (c)). For specimen F0.75_R1.5 the eight edge supports were modified from 150x150 mm to 200x200 mm plates to avoid support failures.
Analysing the values of ϕ0 (experimental load capacity divided by estimated flexural
capacity) exhibited in table 6 and the experimental failure mode (Figure 11), it can be concluded that they are in accordance with Criswell and Hawkins (1974) and Cheng and Parra-Montesinos (2010). They verified that slab-specimen ductile-behaviour was related to values of ϕ0, where values below 1.1 represent a brittle punching failure. Values greater
than 1.1 generally mean a more ductile behaviour and larger deformations, resulting in flexural-punching or flexural failure.
One other aspect to note is that specimens tested in this study exhibited good behaviour at the interface between SFRC and normal concrete without fibres, showing that the use of SFRC in a region until 3d of column face (the zone where it is most needed) is adequate
in improving the load and deformation capacity of the slab-column connection, without causing problems at the interface between the two types of concrete (see Figure 11).
3.2 Load/displacement
Figure 12 presents the load-displacement test results for the six slab specimens. The applied load was obtained from the sum of the eight load cells added to the weight of the slabs and the equipment above it. The displacements were obtained from the relative displacement between the average of pairs of values measured by displacement transducers 8 and 11 to the displacement transducer 1 (in the centre of the slabs).
In Figure 12 it can be observed that all slab specimens exhibited a similar initial stiffness until cracking. There was a slight increase in the cracking load of specimens related to the increase of fibre content. As expected post-cracking behaviour with higher stiffness was measured in specimens with the greatest longitudinal reinforcement, whilst also exhibiting higher load capacity. The increase in load capacity is significant when the SFRC is only applied in the slab-column connection region, but the increase in deformation capacity is the main advantage of this solution.
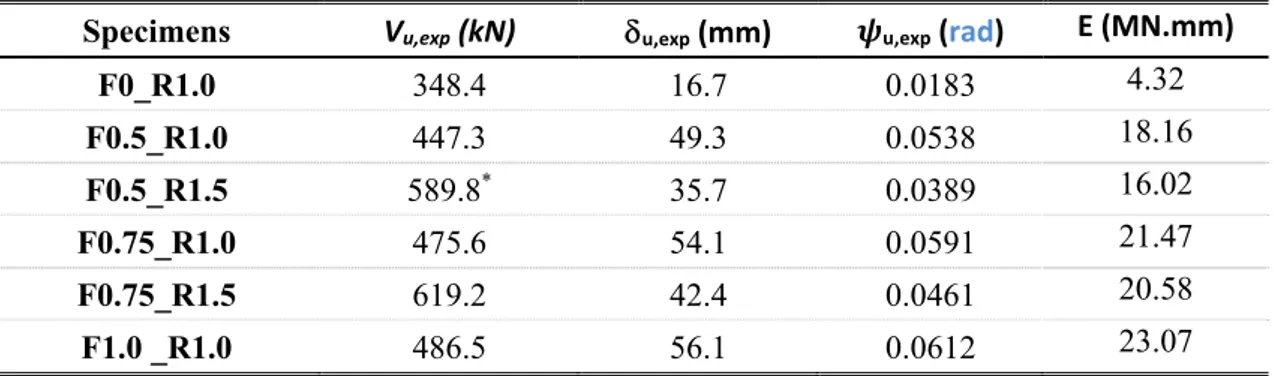
Table 7 presents the experimental failure load, displacement and rotation at failure and deformation energy capacity for each slab specimen. The deformation energy capacity was defined as the area under the load-displacement relationship until the failure of each specimen.
Table 7: Maximum experimental load, displacement, rotation and deformation energy capacity of slab specimens.
Specimens Vu,exp (kN) u,exp (mm) 𝝍u,exp (rad) E (MN.mm)
F0_R1.0 348.4 16.7 0.0183 4.32 F0.5_R1.0 447.3 49.3 0.0538 18.16 F0.5_R1.5 589.8* 35.7 0.0389 16.02 F0.75_R1.0 475.6 54.1 0.0591 21.47 F0.75_R1.5 619.2 42.4 0.0461 20.58 F1.0 _R1.0 486.5 56.1 0.0612 23.07
Vu,exp – experimental load capacity of slab specimens;
u,exp– slab displacement at maximum load capacity;
𝝍u,exp – slab rotation at maximum load capacity;
E – deformation energy capacity of slab specimens;
Figure 12 and Table 7 showed that the SFRC specimens with a 1.0% longitudinal reinforcement ratio exhibited higher load and deformation capacities compared with the reference specimen without fibres. There was also a higher deformation capacity although a lower load capacity in comparison with the SFRC slabs with 1.5% of longitudinal reinforcement. A maximum increase of 234% in rotation capacity was observed when specimens F1.0_R1.0 and F0_R1.0 were compared. It can also be concluded that for slabs with the same longitudinal reinforcement, increased fibre volume content resulted in higher failure loads and deformation capacities.
The SFRC specimens also exhibited a greater deformation energy capacity than the reference specimen without fibres.
3.3 Load Capacity Predictions
The experimental failure loads were compared to the design approach exhibited in
fib Model Code (2013). This design approach leads to punching failure at the intersection
of the load-rotation relationship and the failure criterion curves.
Considering the Level III of approximation, the load-rotation relationship is approximated to (Eq. 8): 𝜓 1.2 ∙𝑟 𝑑 ∙ 𝑓 𝐸 ∙ 𝑉 𝑉 / (8) where 𝑉 is the flexural capacity of the slab. In this study the slabs contain different types of concrete in the same slab, having a region with SFRC and the rest of the slab with normal concrete (NC). So the flexural capacity of the slabs is obtained considering both concretes (Eq. 4 and 5).
The failure criterion, considering the characteristic expressions, is defined according to
fib Model Code (2013) by (Eq. 9):
𝑉 ,
2 3 ∙ 𝑓
1 19.2 ∙ 𝑑𝜓 ∙ 𝑑𝑑 𝜎 𝑤 ∙ 𝑏 ∙ 𝑑 (9)
The stress-crack opening (𝜎 𝑤 ) relationship, exhibited in Eq. 9, is defined in this study according to two different methodologies to consider contribution of the fibres to the failure criterion, one exhibited by fib Model Code (2013) (Eq. 1), and other obtained from
the inverse analysis presented in this study (Table 4). In both cases it was considered for the ultimate crack opening wu = ∙ d / 6 according to fib Model Code (2013).
The ratio between the obtained experimental loads and the predicted ones using the adapted fib Model Code (2013) model is shown in Table 8.
Table 8: Ratio Vu,exp / VR,MC2010 according to fib Model Code (2013) (Eq. (8) and Eq. (9)).
Specimens Vu,exp / VR,MC2010 σMC2010 σI.A. F0_R1.0 1.04* 1.04* F0.5_R1.0 1.13 1.13 F0.5_R1.5 1.02 1.02 F0.75_R1.0 1.15 1.18 F0.75_R1.5 1.03 1.05 F1.0_R1.0 1.10 1.11 Average1 1.09 1.10 COV1 0.05 0.06 5% fractile1 1.02 1.03
* predicted capacity limited by the punching strength of the specimen;
1 calculated considering only the SFRC slabs.
The results shown in Table 8, using the fib Model Code (2013) methodology to determine the specimen load capacity, were calculated considering a linear post-cracking model (𝜎MC2010) or an inverse analysis procedure (𝜎I.A.), for the stress-crack opening (𝜎 𝑤 )
relationship, both obtained through the flexural tests on notched beams. Both approaches lead to conservative results, with the 5% fractile greater than 1.
Using the quadrilinear σ-w relationships through the inverse analysis, the results are similar to the ones using the linear post-cracking model recommended by fib Model Code (2013). The advantage of the quadrilinear σ-w relationships is that it better describes the SFRC mechanical behavior and can be applied to other types of flexural tests, as it is more appropriate for characterizing the mechanical behavior of the SFRC.
4. CONCLUSIONS
This paper presents the results of SFRC slab-column connection tests subjected to monotonically increasing concentrated loads. Flexural tests in notched-beams were also carried out making it possible to determine the tension behaviour of the different concretes. Six slab specimens were cast and tested with five with SFRC in the
slab-column connection region and one reference slab without fibres. Three different fibre volume contents (0.5%, 0.75% and 1.0%) and two different longitudinal reinforcement ratios using a non-uniform distribution were used throughout the slab. The tensile properties of SFRC are evaluated through tension-crack (σ-w) opening diagrams, determined from SFRC notched beam tests using an inverse analysis procedure.
For the notched-beam tests and analysing the obtained results, the conclusions are: - The increase in fibre volume content is accompanied by an increase of the average
residual flexural strength of notched-beams. The largest fibre volume content in mixes results in an improvement in flexural behaviour making it possible to obtain greater strength.
- The inverse analysis methodology made it possible to obtain the σ-w relationship of each mix. This σ-w relationship can enable the correct computation of the contribution of fibres to some analyses where this behavior can be applied through physical models.
Through the analysis of slab-column connection test results, the main conclusions are that:
- Using SFRC in the localized slab-column connection region resulted in an increase of the load and deformation capacities of the slabs, potentially increasing the energy dissipation capacity of this type of structures.
- The use of SFRC to improve the punching capacity of slab-column connections can result in changes of type of failure. In this study, SFRC permitted some slabs to change from the typical brittle punching failure to a flexural-punching or even flexural failure.
- From the analysis of test results, it can be seen that the use of SFRC in an area up to 3d of column face is adequate to improve the load and deformation capacity of the slab-column connection.
ACKNOWLEDGEMENTS
This work received the support from the Fundação para a Ciência e a Tecnologia - Ministério da Ciência, Tecnologia e Ensino Superior through scholarship number SFRH/BD/109073/2015. The authors would like to thank Ing. Erik Ulrix from BIU, Portugal, Ing. Ana Maria Proença from FEUP, Portugal and Ing. Sarah Van Bergen from Bekaert, Belgium for all the support. The authors are also grateful to Sonangil, SA and Sika Portugal, SA for providing the aggregates and plasticizer, respectively.
REFERENCES
Cheng, M.Y. and Parra-Montesinos, G.J. (2010): Evaluation of steel fiber reinforcement for punching shear resistance in slab-column connections, part I: monotonically increased load. ACI Structural Journal, Vol. 107, pp. 101-109.
Clément, T.; Ramos, A.; Ruiz, M. and Muttoni, A. (2014): Influence of prestressing on the punching strength of post-tensioned slabs. Engineering Structures. Vol. 72, pp. 56-69. DOI: 10.1016/j.engstruct.2014.04.034.
Corley, W. and Hawkins, N. (1968): Shear head reinforcement for slabs. ACI Journal, Vol. 65, pp. 811-824.
Criswell, M. and Hawkins, N. (1974): Shear strength of slabs: basic principle and their relation to current methods of analysis. American Concrete Institute, Vol. 42, pp. 641-676.
Custódio, A. and Vicente, L. (2007): Using sampling and simplex derivatives in pattern search methods. SIAM Journal on Optimization, Vol. 18, pp. 537-555.
Custódio, A.; Rocha, H. and Vicente, L. (2010): Incorporating minimum Frobenius norm models in direct search. Computational Optimization and Applications, Vol. 46, pp. 265-278.
De Montaignac, R.; Massicotte, B.; Charron, J-P. and Nour. A. (2012): Design of SFRC structural elements: post-cracking tensile strength measurement. Materials and
Structures Vol. 45, pp. 609-622.
Dilger, W. and Ghali, A. (1981): Shear reinforcement for concrete slabs. Journal of the
structural division, ASCE, Vol. 107, pp. 2403-2420.
European Committee for Standardization (2005), EN 14651: Test method for metallic fibered concrete - measuring the flexural tensile strength (limit of proportionality (LOP), residual), 17 pages.
European Committee for Standardization (2006), EN 14889-1: Fibres for concrete - Part 1: Steel fibres - Definitions, specifications and conformity, 30 pages.
European Committee for Standardization (2008), EN 12620: Aggregates for concrete, 60 pages.
European Committee for Standardization (2011), EN 197-1: Cement - Part 1: Composition, specifications and conformity criteria for common cements, 50 pages.
European Committee for Standardization (2012), EN 934-2: Admixtures for concrete, mortar and grout - Part 2: Concrete admixtures - Definitions, requirements, conformity, marking and labelling, 28 pages.
Faria, D.; Einpaul, J.; Ramos, A.; Ruiz, M. and Muttoni, A. (2014): On the efficiency of flat slabs strengthening against punching using externally bonded fibre reinforced polymers. Construction and Building Materials, Vol. 73, pp. 366-377.
DOI: 10.1016/j.conbuildmat.2014.09.084.
Faria, D.; Lúcio, V. and Ramos, A. (2011): Strengthening of flat slabs with post-tensioning using anchorages by bonding. Engineering Structures, Vol. 33, pp. 2025-2043. DOI: 10.1016/j.engstruct.2011.02.039
Fédération International du Béton (2013), fib Model Code for Concrete Structures 2010. Ernst e Sohn, 434 pages, isbn: 978-3-433-03061-5.
Gouveia, N.; Faria, D. and Ramos, A. (2018): Assessment of SFRC flat slab punching behaviour – Part II: reversed horizontal cyclic loading. Magazine of Concrete
Research, submitted for publication.
Gouveia, N.; Fernandes, N.; Faria, D.; Ramos, A. and Lúcio, V. (2014): SFRC flat slabs punching behaviour – experimental research. Composites: Part B, Vol. 63, pp. 161-171. DOI: 10.1016/j.compositesb.2014.04.005
Harajli, M.H.; Maalouf, D. and Khatib, H. (1995): Effect of fibres on the punching shear strength of slab-column connections. Cement & Concrete Composites, Vol. 17, pp. 161-170.
Inácio, M.; Almeida, A.; Faria, D.; Lúcio, V. and Ramos, P. (2015): Punching of high strength concrete flat slabs without shear reinforcement. Engineering Structures, Vol. 103, pp. 275-284. DOI: 10.1016/j.engstruct.2015.09.010.
Inácio, M.; Ramos, A. and Faria, D. (2012): Strengthening of flat slabs with transverse reinforcement by introduction of steel bolts using different anchorage approaches.
Engineering Structures, Vol. 44, pp. 63-77. DOI: 10.1016/j.engstruct.2012.05.043
Islam, S. and Park, R. (1976): Tests of slab-column connections with shear and unbalanced flexure. Journal of the Structural Division, ASCE, Vol. 102, pp. 549-569. Kooiman, A.; Veen, C. and Walraven, J. (2000): Modelling the post-cracking behavior of steel fibre reinforced concrete for structural design purposes. Heron, Vol. 45, pp. 275-307.
Lips, S.; Fernandez, R.M. and Muttoni, A. (2012): Experimental investigation on punching strength and deformation capacity of shear-reinforced slabs. ACI Structural
Journal, Vol. 109, pp. 889–900.
Maya, L.; Ruiz, M.; Muttoni, A. and Foster, S. (2012): Punching shear strength of steel fibre reinforced concrete slabs. Engineering Structures, Vol. 40, pp. 83-94.
Muttoni, A. (2008): Punching shear strength of reinforced concrete slabs without transverse reinforcement. ACI Structural Journal, Vol. 105, pp. 440-450.
Nguyen-Minh, L.; Rovñák, M. and Tran-Quoc, T. (2012): Punching shear capacity of interior SFRC slab-column connection. Journal of Structural Engineering, ASCE, pp. 613-624. DOI: 10.1016(ASCE)ST.1943-541x.0000497.
Ramos, A.; Lúcio, V. and Faria, D. (2014): The effect of the vertical component of prestress forces on the punching strength of flat slabs. Engineering Structures, Vol. 76, pp. 90-98. DOI: 10.1016/j.engstruct.2014.06.039.
Ramos, A.; Lúcio, V. and Regan, P. (2011): Punching of flat slabs with in-plane forces.
Engineering Structures, Vol. 33, p.894–902. DOI: 10.1016/j.engstruct.2010.12.010 Silva, R.; Faria, D.; Ramos, A. and Inácio, M. (2013): A physical approach for
considering the anchorage head size influence in the punching capacity of slabs strengthened with vertical steel bolts. Structural Concrete, Vol. 14, pp. 389-400. DOI: 10.1002/suco.201200051.
Sousa, J. and Gettu, R. (2006): Determining the tensile stress-crack opening curve of concrete by inverse analysis. Journal of Engineering Mechanics, Vol. 132, pp. 141-148.
Voo, J. and Foster, S. (2004). Tensile fracture of fibre reinforced concrete: variable engagement model. In: 6th Rilem symposium of fibre reinforced concrete (FRC), Varenna, Italy, pp. 75-84.
Zhang, J. and Stang, H. (1998): Applications of stress crack width relationship in predicting the flexural behavior of fibre-reinforced concrete. Cement & Concrete
CAPTIONS
Figure 1: Notched beam test: a) test set-up and b) arrangement of loading and position of notch.
Figure 2: Limit of proportionality and residual flexural strength for each mix according EN 14651, 2005.
Figure 3: Linear post-cracking behavior of SFRC according fib Model Code, 2013. Figure 4: Load-deflection relationships of experimental and model for each mix. Figure 5: Adopted quadrilinear σ-w relationships.
Figure 6: Regions of different concretes inside the specimens: a) central region with SFRC and b) normal concrete without fibres on the outside region.
Figure 7: Top and bottom reinforcement used in specimens: a) F0_R1.0, F0.5_R1.0, F0.75_R1.0, F1.0_R1.0 and b) F0.5_R1.5, F0.75_R1.5.
Figure 8: Test setup of specimens: a) top view and b) section A-A´.
Figure 9: Position of load cells and displacements transducers in the tested specimens. Figure 10: Yield-line pattern for a statically undetermined octagonal specimen.
Figure 11: Photos of the failure shapes of the specimens (vertical dashed lines are the limits of the SFRC region).