André Ribeiro da Graça Lima Mozes
“TOWARD THE ISOLATION OF EXOSOMES BY FLOW
CYTOMETRY”
André Ribeiro da Graça Lima Mozes
“TOWARD THE ISOLATION OF EXOSOMES BY FLOW
CYTOMETRY”
Master in Biomedical Sciences
Project Supervised by:
Gisou van der Goot, PhD (EPFL SV GDI)
Rui Gonçalo Martinho (UALG DCBM CBMR)
Declaração de Autoria do Trabalho
“TOWARD THE ISOLATION OF EXOSOMES BY FLOW CYTOMETRY”
Declaro ser o autor deste trabalho, que é original e inédito. Autores e trabalhos consultados estão devidamente citados no texto e constam da listagem de referências incluída.
André Ribeiro da Graça Lima Mozes
Copyright, André Ribeiro da Graça Lima Mozes
A Universidade do Algarve tem o direito, perpétuo e sem limites geográficos, de arquivar e publicitar este trabalho através de exemplares impressos reproduzidos em papel ou de forma digital, ou por qualquer outro meio conhecido ou que venha a ser inventado, de o divulgar através de repositórios científicos e de admitir a sua cópia e distribuição com objetivos educacionais ou de investigação, não comerciais, desde que seja dado crédito ao autor e editor.
i
Acknowledgements
I would like to thank my supervisors, Professor Gisou van der Goot and Professor Rui Gonçalo Martinho, for giving me the opportunity to perform this experimental work, and for sharing their knowledge.
A special word to Oksana Sergeeva because she was absolutely amazing, being always there to answer all my questions and to help me in many different tasks involved in this project. For sure, she was a priceless help and made this project possible.
To my team from the flow cytometry core facility, Miguel Garcia, Loïc Tauzin and Valérie Glutz for their support and motivational help during the entire project.
To all the members of the EPFL community, which one way or another were involved in this project, mainly the people from the different core facilities and the members from the “exosome group”.
To all my friend who always believed that one day I would get to this final stage of my Master degree and helped me relax in some difficult moments
Of course I would also like to thank my family, specially my Mother, for all their support over the years and for always pushing me forward. A big thank to a very important person that will miss this moment, my Grandmother, who was always there with a motivational word when my motivation was down, being able to find a wise word in the right moment. A source of inspiration not only for me, but for everyone who had the change to know her.
At last but not least, there are no words to thank to my girlfriend Ângela, for being always there when I needed some motivation and for not being mad with me for all the weekends that I had to work for this project, especially during the summer time when it is always better to be outside.
ii
Abstract
In the last two decades the Extracellular Vesicles (EVs) field has attracted a lot of attention from the scientific community, especially after the discovery that EVs can shuttle functional proteins and nucleic acids between cells. Some recent studies have shown an association between tumorigenesis and increased exosomes production. Exosomes and their influence has also been reported in the establishment of new metastatic niches.
Besides that, the EV field remains confusing due to numerous and ambiguous definitions, specially caused by the huge heterogeneity of the vesicles, both in composition and function.
Extracellular vesicles are divided into microvesicles which are originated from the plasma membrane and exosomes which have an endosomal origin. For now, it is technically challenging to obtain a pure exosome fraction, free from non-vesicular components, due to the fact the extracellular milieu is quite complex and can contain microvesicles or apoptotic bodies similar in size and structure to exosomes. The two most used methods, ultracentrifugation and commercial kits, don’t show a good efficiency when distinguishing the exosomes fraction specifically from the microvesicles fraction. Due to this sub-optimal efficiency demonstrated by these two methods, we have decided to use Flow Cytometry to see if we can achieve better exosome purification. We will use Fluorescence-activated cell sorting (FACS) to purify endogenous exosomes.
This would be quite challenging especially due to the exosomes size and heterogeneity but on the other hand, if we have success with our approach, it would be possible to do downstream analysis in order to know their protein composition, functions and elaborate some more studies to try to find some “exosome-specific” marker. This would have a huge impact in the pharmaceutical industry, both for diagnosis and therapy.
iii
Resumo
Durante as últimas duas décadas, a investigação desenvolvida sobre Vesículas extracelulares (VE), atraíu o bastante interesse por parte da comunidade científica, especialmente após ter sido descoberto que as VE podem transportar proteínas funcinais e ácidos nucleicos entre diferentes células. Estudos mais recentes mostraram uma relação entre tumorogenese e um aumento na produção de exosomas. Estes foram também associados ao estabelecimento de novas metástases.
Apesar de todas estas descobertas, o domínio das VE continua significativamente confuso, nomeadamente devido às numerosas e ambíguas definições utilizadas, especialmente devido ao facto da imensa heterogeneidade entre as diversas VE, tanto a nível de composição como de função.
Vesículas extracellulares estão divididas em microvesículas, que são originárias da membrana plasmática, e exosomas que têm uma oigem endossomal. No presente, é tecnicamente bastante complicado de obter uma fracção de pura exosomas que não apresente componentes não vesiculares, principalmente pelo facto do meio extracellular ser bastante complexo e poder conter microvesícula e corpos apoptóticos semelhantes em termos de tamanho e estrutura. Os dois métodos mais usados, a ultracentrifugação e kits comerciais, não apresentam uma boa eficiência na distinção de exosomas, especialmente das microvesículas. Devido a esta eficiência sub-óptima demonstrada por estes dois métodos, decídimos usar a separação celular por citometria de fluxo (FACS) para proceder ao isolamento de exosomas endógenos.
Este objectivo será bastante desafiador especialmente pelo tamanho e heterogeneidade dos exosomas mas, por outro lado, se formos suficientemente bem sucedidos na nossa abordagem, será possível realizar análises posteriores, de modo a conhecer a sua composição proteica, funções e partir para novos estudos de modo a tentar identificar um marcador molecular específico para exosomas. Isto teria um impacto significativo na indústria farmacêutica, tanto a nível de diagnóstico como terapêutico.
iv
List of Figures
Figure 1.1 Evolution of the number of publications containing “Extracellular Vesicles”
on PubMed over the years. ... 2
Figure 1.2 Extracellular vesicles origin. Adapted from www.abcam.com/ primary-antibodies/extracellular-vesicles-an-introduction. ... 3
Figure 1.3 Different terms used to designate EVs by different scientific societies ... 6
Figure 1.4 EV’s role in immune response. ... 8
Figure 1.5 Oligodendroglial exosomes in neuron-glia communication... 9
Figure 1.6 Proteins and RNAs transfer by EVs. ... 11
Figure 1.7 Schematic of in vivo-derived EVs isolated from body fluids... 12
Figure 1.8 Schematic representation of how the 3 main parts of a flow cytometer work together. ... 17
Figure 1.9 How FSC and SCC scattered light is measured by a flow cytometer ... 19
Figure 1.10 Schematic of how FACS are able to isolate different particles ... 20
Figure 1.11 Schematic of swarming detection ... 21
Figure 3.1 The Beckman Coulter MoFlo Astrios EQ optical configuration. ... 24
Figure 4.1 Gating strategy to sort Apogee beads with two specific sizes. ... 29
Figure 4.2 Purity control results from the sorted beads. ... 30
Figure 4.3 Purity control result after excluding the background level. ... 30
Figure 4.4 NTA analysis from the 100nm sorted beads. ... 31
Figure 4.5 mCherry expression of the RPE-1 used cells. ... 32
Figure 4.6 Gating strategy applied on the sort ... 33
Figure 4.7 Western blot results from sorted EVs. ... 35
Figure 4.8 Relative size comparison between mCherry positive sorted EVs and Apogee beads ... 36
Figure 4.9 (A) Apogee beads dispersion with new scatter settings. (B) Apogee beads sizes and fluorescence. ... 36
Figure 4.10 Schematic diagram of a beam filter localization and function. ... 37
v Figure 4.12 Median Intensity Fluorescence of the Apogee beads in the FSC
channel. ... 38 Figure 4.13 Differences in the background between using 0.1 µm (A) or 0.22 µm (B) filtered PBS as sheath fluid ... 39 Figure 4.14 Definition of the mCherry positive gate according to the background
level. ... 40 Figure 4.15 (A) Populations inside the “mCherry pos” gate dispersion in 488 FSC versus 488 SSC. (B) Background on these two channels. ... 41 Figure 4.16 (A) Populations inside “mCherry pos”. (B) Dot plot showing 2 populations easily distinguishable. ... 41 Figure 4.17 Visualization of sorted EVs by TEM. ... 43 Figure 4.18 Raw data visualization using Scaffold from Proteome Software, Inc. ... 45 Figure 4.19 String analysis from the identified proteins, showing the interactions
vi
List of Tables
Table 1.1 Most used characteristics applied to classify EVs. ... 4 Table 4.1 Genes, protein’s full name and localization of all identified proteins from Human origin. ... 47
vii
List of Abbreviations
FACS – Fluorescence-activated cell sorting EV – Extracellular vesicle
RNA – Ribonucleic acid
tRNA – Transfer ribonucleic acid miRNA – microRNA
mRNA – Messenger RNA
MHC – Major histocompatibility complex MVB – Multivesicular body
ILV – Intraluminal vesicle MV – Microvesicle
ApoBD – Apoptotic bodies
ISEV – International society for extracellular vesicles CSF – Cerebrospinal fluid
CNS – Central nervous system IL-1β – Interleukin 1 Beta
PNS – Peripheral nervous system TF – Tissue factor
BALF – Bronchoalveolar lavage fluid DCs – Dendritic cells
GPIb – Glycoprotein Ib
DGC – Density gradient centrifugation h – Hour
UC – Ultracentrifugation WB – Western blot
TEM – Transmission electron microscopy NTA – Nanoparticle tracking analysis
GAPDH – Glyceraldehyde 3-phosphate dehydrogenase SSC – Side-scattered light
viii FSC – Forward-scattered light
FCS – Flow cytometry standard MFI – Mean fluorescence intensity RPE-1 – Retinal pigmented epithelial FBS – Fetal bovine serum
PBS – Phosphate-buffered saline
EDTA – Ethylenediaminetetraacetic acid DMEM – Dulbecco's Modified Eagle Medium SDS – Sodium dodecyl sulfate
ddH2O – Double-distilled water BCA – Bichinchoninic Acid OM – Opti-MEM
LC-MS/MS – Liquid chromatography-tandem mass spectrometry CryoEM – Electron cryomicroscopy
nm – nanometer µm – micrometer µg – microgram mW – milliwatt kV – Kilovolt kDa – Kilodalton mbar – Millibar mL – Milliliter ºC – Degree Celsius
ix
Table of Contents
Acknowledgements ... i
Abstract ...ii
Resumo ... iii
List of Figures ...iv
List of Tables ...vi
List of Abbreviations ... vii
Table of Contents ...ix
1. Introduction ... 1
1.1. A brief historical timeline of extracellular vesicles ... 1
1.2. Extracellular vesicles origin ... 2
1.3. Extracellular vesicles characteristics ... 4
1.4. Nomenclature problems and the search for consensus ... 5
1.5. Functions of extracellular vesicles ... 7
1.5.1 Immunology ... 7
1.5.2. Neuroscience ... 9
1.5.3. Liver homeostasis ... 10
1.6. Interactions of extracellular Vesicles with recipient cells ... 10
1.7. Isolation of extracellular vesicles ... 12
1.7.1. Body fluids ... 12
1.7.1.1. Nasal fluid ... 12
1.7.1.2. Saliva ... 13
1.7.1.3. Bronchoalveolar lavage fluid (BALF) ... 13
1.7.1.4. Blood ... 13
1.7.1.5. Urine ... 14
1.7.2. Methods used to isolate extracellular vesicles ... 15
1.7.2.1. Ultracentrifugation ... 15
x
1.7.2.3. Commercial Kits ... 16
1.7.2.4. Techniques applied to evaluate EVs isolations ... 16
1.7.3. Flow cytometry as a method to isolate extracellular vesicles ... 17
1.7.3.1. Flow Cytometry ... 17
1.7.3.2. Fluorescent activated cell sorting ... 19
1.7.4. FACS of EVs ... 20
1.7.4.1. Limitations ... 21
1.7.4.2. Advantages ... 22
2. Aim of the project ... 23
3. Materials and Methods ... 23
3.1. Sample Preparation ... 23
3.1.1. Cell culture ... 23
3.1.2. Cell suspension ... 23
3.2. Fluorescent activated cell sorting (FACS) ... 24
3.2.1. Equipment configuration... 24
3.2.2. Sheath fluid ... 25
3.2.3. Sample tubes ... 25
3.2.4. Commercial beads ... 25
3.3. Western Blot ... 26
3.4. Nanoparticle Tracking Analysis (NTA) ... 26
3.5. Transmission Electron Microscopy ... 27
3.5.1. Sample preparation ... 27
3.5.2. Equipment used ... 27
3.6. Mass Spectrometry ... 27
4. RESULTS ... 29
4.1. Is it possible to sort so small? ... 29
4.2. First Sorting Attempt ... 32
4.2.1. Cells ... 32
4.2.2. Gating strategy ... 33
xi
4.3. Further optimization ... 37
4.3.1. Using or not a beam splitter ... 37
4.3.2. Measure the SSC from the 488 nm or from the 405 nm laser ... 39
4.3.3. Sheath fluid filtration at 0.1 or 0.22 µm ... 39
4.4. Final Sorting strategy ... 40
4.5. Transmission electron microscopy data ... 43
4.6. LC – MS/MS results ... 45
5. Discussion and Conclusion ... 50
1
1. Introduction
1.1. A brief historical timeline of extracellular vesicles
One of the most critical processes of multicellular organisms is intercellular communication. Until two decades ago, this communication was divided into direct cell-cell signaling that can be mediated by a membrane–anchored stimulus, deciphered by receptors located in other cells or by junctional complexes and, the transfer of secreted molecules such as hormones, growth factors and cytokines. Over the last few years, a third mechanism was added to this list: intracellular transfer of extracellular vesicles (EVs).1,2
Extracellular vesicles are membrane-contained vesicles released by a wide range of organisms, from prokaryotes to higher eukaryotes. The transfer of information from cell to cell, and downstream changes in the recipient cell function are probably the most important characteristics of extracellular vesicles.2
Despite being consider a “hot topic” during the last few years, EVs were first observed and reported in 1946 by Chargaff and West as procoagulant platelet-derided particles in normal plasma3. Some years later, those EVs were characterized as “platelet dust” by Wolf in 1967.4
In 1995, Raposo G and colleagues were able to demonstrate that small externalized vesicles, termed exosomes, exhibited abundant MHC class II molecules and were able to specifically present antigenic peptides to T cells. In the same paper, it was also suggested to further explore the usefulness of exosomes as biological vehicles.5
In 2006-2007, the EVs field received a huge boost after a number of different papers described the presence of mRNA and miRNA inside EVs which renewed interest in the role of EVs as mediators of cell-to-cell communication.6,7 More recently, using deep sequencing to analyze RNA from EVs, it was shown that EVs also contain a large variety of small noncoding RNA species such as RNA transcripts, protein coding regions, structural RNAs, tRNA fragments and small interfering RNAs.8,9
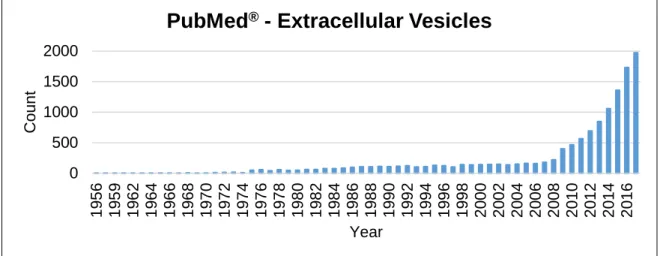
2 The interest in the EVs field has increased over the last years, as demonstrated in the following graphic, showing the publication rate that contains the words “Extracellular Vesicles” on PubMed® over the years.
1.2. Extracellular vesicles origin
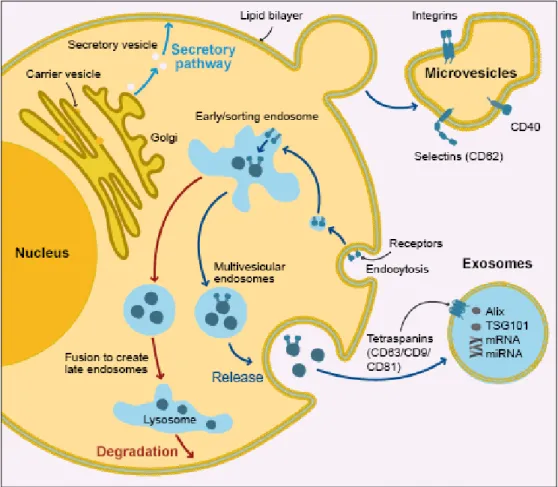
Today’s most accepted classification of extracellular vesicles divide them in three main classes: exosomes, microvesicles/microparticles/ectosomes and apoptotic bodies. Exosomes are formed within the endocytic pathway in a two-step process. First, as endosomes mature from early endosomes to late endosomes, they become multivesicular bodies (MVBs) upon accumulation of intraluminal vesicles (ILVs). These intraluminal vesicles contain proteins and nucleic acids that come from the cytosol as the endosomal membrane invaginates, or they can contain receptors from the plasma membrane that shuttle through the early endosome upon endocytosis. MVBs are either destined for fusion with the lysosome where their contents will undergo lysosomal degradation, or with the plasma membrane where their contents are released into the extracellular space. The ILVs of MVBs become exosomes upon their release.3,10
0 500 1000 1500 2000 19 56 19 59 19 62 19 64 19 66 19 68 19 70 19 72 19 74 19 76 19 78 19 80 19 82 19 84 19 86 19 88 19 90 19 92 19 94 19 96 19 98 20 00 20 02 20 04 20 06 20 08 20 10 20 12 20 14 20 16 C ount Year
PubMed
®- Extracellular Vesicles
Figure 1.1 Evolution of the number of publications containing “Extracellular Vesicles” on PubMed®
3 Microvesicles (MVs) are produced by outward budding and fission of the plasma membrane while apoptotic bodies (ApoBDs) are released as blebs of cells undergoing apoptosis.1,2 (Figure 1.2)
Even if these extracellular vesicles formation processes continue to be the most consensual, new data seems to show that EVs indistinguishable from exosomes were released directly from the plasma membrane.11
Within recent publications, several different EVs were described, from both hematopoietic and non-hematopoietic origin such as, cytotoxic T Cells, platelets, mast cells, neurons, oligodendrocytes, Schwann cells, intestinal epithelial cells and prostate epithelial cells.12,13
Figure 1.2 Extracellular vesicles origin. Adapted from www.abcam.com/primary-antibodies/extracellular-vesicles-an-introduction.
4
1.3. Extracellular vesicles characteristics
Other characteristics like the size, shape, membrane markers and sedimentation were also generally accepted to characterize different EVs. The following table contains a brief summary of those characteristics.13
Exosomes Microvesicles Apoptotic bodies
Size (nm) 50 - 100 100 - 1000 400 - 1000
Appearance in
EM Cup-shaped Irregular shape
Heterogeneous shape
Markers Tetraspanins, Alix, TSG101, ESCRT
Selectins, integrins,
CD40 ligand Histones, organelles
Sedimentation 100,000 x g 1200 x g to 100,000 x g
1200 x g to 100,000 x g
Table 1.1 Most used characteristics applied to classify EVs.
Like the extracellular vesicles origin presented before, these “specific” characteristics have seen a lot of contradictory data in the last years.
Exosome characteristics have recently been questioned due to three new reports: tetraspanins are also plasma membrane vesicles and are not specific for vesicles derived from MVB; knockout studies suggest MVB-derived vesicles represent only a portion of the 50-200 nm vesicles; exosomes up to 250 nm were recently reported.11,14 Probably the most important finding that contradicts several highly ranked publish papers, was the fact that the widely accepted cup-shaped morphology could be in fact an experimental artefact.15
In the case of microvesicles, the main criticisms are: in vivo, larger vesicles than 200 nm are generally not observed, being the most circulating vesicles range between 50-200 nm; it is impossible to distinguish 50-200 nm microvesicles from exosomes based
5 on sedimentation; tetraspanins can be detected on vesicles of all size ranges; and, the microvesicle “specific” markers were demonstrated on vesicles derived from B cells and may not be relevant to those microvesicles derived from other cell types.
1.4. Nomenclature problems and the search for consensus
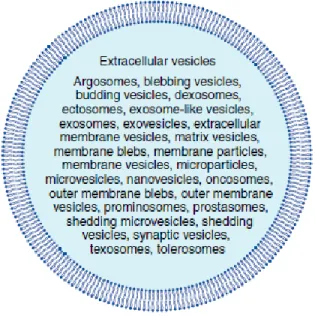
All these new findings give rise to some confusion on the origin and nomenclature of EVs, mainly because most of the studies rely on just one of the EVs characteristic, like size or morphology. Researchers have also applied different names for secreted vesicles, most of them reflecting specific functions (i.e. calcifying matrix vesicles)16 or their cell of origin (i.e. platelet dust)4.
Standardization was suggested to use more generic terms like exosome and microvesicle that could have a wider utility. Unfortunately, generic terms can mean different things for different investigators, easily seen if we take the word exosome as an example. At least three different uses of the word exosome can be found on the literature. Some investigators base themselves in a biogenetic definition (i.e. vesicles that bud into endosomes and are released when the resulting multivesicular bodies fuse with the plasma membrane)5,17, others keep using the original broad definition (i.e. vesicles that may serve a physiologic function)18,19 and even some base themselves on differential centrifugation (i.e. vesicles that sediment only after centrifugation at about 70000 – 100000 x g)20.
Adding to all this misunderstanding, it has also been published that a single cell type can release both exosomes and microvesicles. Cells like platelets21, endothelial cells22 and breast cancer cells23 are examples of that. Another problem is the nomenclature for EVs that can be found throughout the literature, even with different scientific societies using different terms for EVs.11 (Figure 1.3)
6 To try to solve this problem, since 2011, collaborative work has been done by the members of the International Society of Extracellular Vesicles (ISEV) in order to unify the nomenclature on the field. Even so, there is still no consensus about the EV nomenclature. The current inability to reach consensus for extracellular vesicles nomenclature reflects differences of opinion about the value of scientific precedent, the relative merits of empirical versus biogenetics systems for naming extracellular vesicles and also scientific disagreement on the current paradigms of EV biogenesis. 11,24
In summary, identification criteria have led to confusion rather than consensus, with the ISEV suggesting the use of the term “extracellular vesicles” as a generic term for all secreted vesicles.
7
1.5. Functions of extracellular vesicles
Very diverse biological functions have been attributed to EVs, from being a mechanism to eradicate non-necessary molecules, to the capacity of EVs to act as antigen-presenting vesicles in order to stimulate antitumoral immune responses or even to induce tolerogenic effects.25–27 Moreover, if the EV number and constitution from healthy individuals is known, it may allow the identification of altered patterns and possibly help in a differential diagnosis. Therefore, EVs have also been considered valuable biomarkers.
Some of the most relevant and well described functions of EVs in different fields are described below. We have chosen these three examples of functions because they are consensual and well described in different articles but, this is not an exhaustive list and many other functions are identified over the literature.2
1.5.1 Immunology
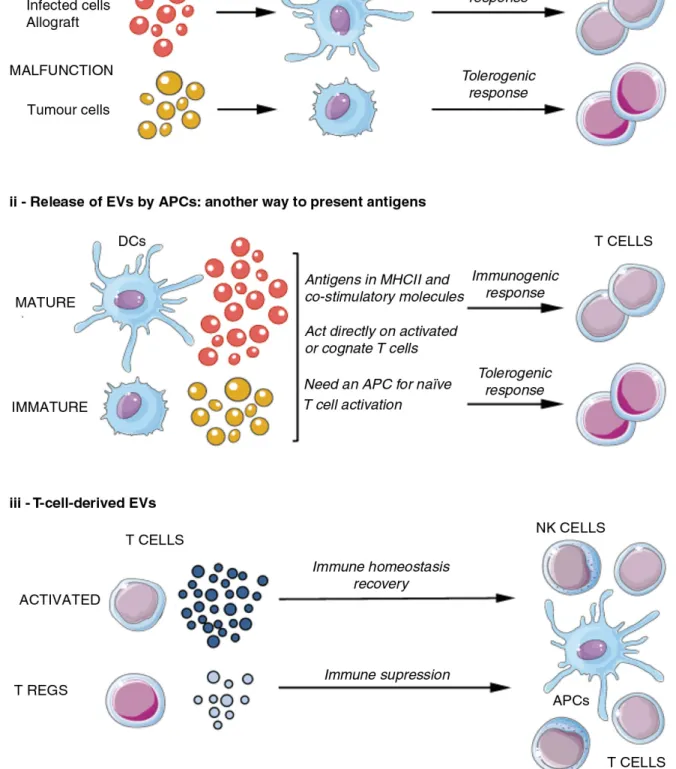
In immunology, it is known that tumor cells as other cells in the tumor microenvironments secrete EVs, and some studies relate this fact to tumor progression, by promoting angiogenesis and metastases.28,29 T lymphocytes and natural killer cells may be inactivated by tumor-derived vesicles containing immune-suppressive molecules, therefore inhibiting normal immune response.30 On the other hand, it has also been described that EVs bearing MHC-II were able to activate T cell responses.5 Macrophages and dendritic cells can release EVs with the ability to promote T cells responses.31–33 This ability of EVs to influence immune response (Figure 1.4) is attracting a lot of attention, especially in the tumor immunology field. Unique EV cargo contents may be used in the future as potential predictive biomarkers, allowing a better follow-up from patients both before and during treatment.34
8
9
1.5.2. Neuroscience
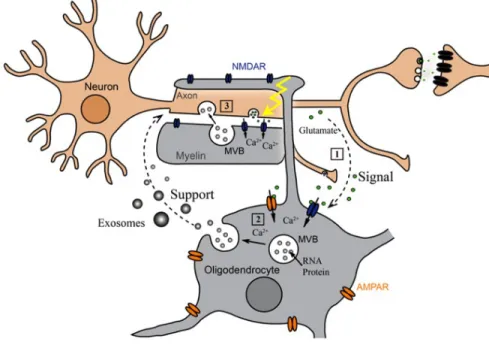
Neuroscience is another field in which EVs have received a lot of attention and exciting questions are still waiting for an answer. EV exchange may be a common mode of neural cell communication as EVs of distinct size and origin can be found in the cerebrospinal fluid (CSF) with different studies suggesting the ability to cross the blood-brain barrier in both directions, even if it is not clear how EVs do that.35–39 Inflammatory condition facilitate the entry of peripheral EVs into the brain resulting in genetic modulation of the cells of the central nervous system (CNS).40 Microglia, which contribute to CNS homeostasis, respond to ATP-mediated P2X7 receptor activation by shedding EVs from their plasma membrane. Microglia EVs seem to modulate neurotransmission at excitatory glutamatergic as well as inhibitory GABA-ergic synapses. In addition, since these EVs carry the pro-inflammatory cytokine IL-1β and were increased in CSF during inflammation, they were associated with inflammation propagation in the CNS.37,41–43 Moreover EVs seem to be involved in the communication between myelinating oligodendrocytes and neurons. Electrically active neurons could trigger the release of oligodendroglial EVs by neurotransmitter signaling and, furthermore, internalize these EVs by endocytosis. (Figure 1.5)36
10 In the nervous system, Schwann cells in the peripheral nervous system (PNS) also secret EVs, which are able to enhance axonal regeneration after nerve damage. Regenerative functions were also seen in EVs that enter the CNS from the periphery, by transfer neuroregenerative miRNAs to astrocytes and neurons in a rat stroke model. Myelination enhancement, as well as remyelination was also suggested as possible consequences of their uptake.44–46
The role of EVs in spreading neuropathological agents in neurodegenerative diseases as well as in promoting the growth of brain tumors is being studied by several research groups.47,48
1.5.3. Liver homeostasis
Even though EVs in the brain have received a lot of attention, EVs in the liver are proving to be very interesting as well. Their importance has been mainly associated with liver homeostasis. EVs are a way used, by either immune or non-immune cells, to communicate between themselves, in order to give the appropriate response both for stimuli and insults.
Hepatocyte-derived EVs were able to activate Ito cells to mediate a response to liver damage and also EVs from a resident liver population were shown to accelerate the morphological and functional recovery of liver in partially hepatectomized rats.49–51
1.6. Interactions of extracellular Vesicles with recipient cells
EVs functions are dependent on their ability to interact with recipient cells in order to deliver their cargo of proteins, lipids and RNAs. Besides the cellular and molecular basis for EV targeting still undetermined, the specificity of target cells binding has already been described in different occasions. Target cell specificity for binding is likely to be determined by adhesion molecules, such as integrins. Differences in tetraspanins complexes may also influence target cell selection by modulating the functions of integrins.52–54
11 Once bound to the recipient cells, EVs have three different options. They may remain stably associated with the plasma membrane, fuse directly with the plasma membrane or be internalized through distinct endocytic pathways. In case they are endocytosed, EVs become ILVs and may then fuse with the endosomal limiting membrane and deliver their cargo into the cytosol, or be sent to lysosomes for degradation.1 (Figure 1.6)
Figure 1.6 Proteins and RNAs transfer by EVs. MVs and exosomes may dock at the plasma membrane of a target cell [1]. Bound vesicles may either fuse directly with the plasma membrane [2] or be endocytosed [3]. Endocytosed vesicles may then fuse with the limiting membrane of an endocytic compartment [4]. Adapt from (1)
12
1.7. Isolation of extracellular vesicles
1.7.1. Body fluids
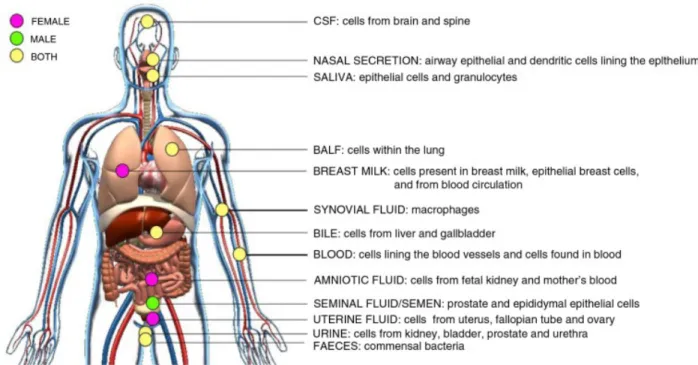
EVs have been reported to be present in a wide range of body fluids, namely blood55, semen56,57, urine58, saliva59, breast milk60, bile61, ascites fluid62, cerebrospinal fluid63, amniotic fluid64, etc. (Figure 1.7)
Thanks to the lipid membrane that encapsulates and protects EVs contents from degrading enzymes, EVs can be sent over long distances within bodily fluids.2
Figure 1.7 Schematic of in vivo-derived EVs isolated from body fluids. Adapted from (2).
1.7.1.1. Nasal fluid
EVs have been detected in the nasal secretions of healthy humans. For now, the functional significance of nasal EVs is far from being well understood, but researchers suggest they might have immune modulatory effects. The field of vaccine development is
13 actively looking to these EVs to evaluate their therapeutic effects in the brain, lungs and intestines.65–67
1.7.1.2. Saliva
Saliva-derived contain proteins and different RNA species which can be internalized by both oral keratinocytes and macrophages. The source of these EVs is mainly from epithelial cells and partly from granulocyte origin. Exosomes and microvesicles have both been identified, each one with their characteristic size and RNA content. Interestingly, EVs isolated from saliva of healthy donors contain tissue factor (TF) which can initiate blood coagulation and this factor is associated with the fact that humans and other animals lick a bleeding wound to promote coagulation and the subsequent wound healing.59,68–73
1.7.1.3. Bronchoalveolar lavage fluid (BALF)
The main role for EVs released by cells residing in the lung, is linked to lung immunity in response to different stimuli. Upon exposure to magnetic iron oxide nanoparticles, secretion of EVs was shown to increase in a dose-dependent manner. These EVs were then quickly eliminated from alveoli into systemic circulation and their signals transferred to the immune system. Once transferred to the immune system, maturation of DCs and activation of splenic T cells were also observed. In addition to the presence of RNA and miRNA, BALF EVs expression of the scavenger receptor CD36, was also reported. This receptor has been implicated in bacterial recognition.74–77
1.7.1.4. Blood
The main breakthroughs in EV field have been first described in blood. From the first EVs observed, the ones named “platelet dust” to the first time the term exosomes was originally applied. This article published in 1980s, described that in the maturation process, reticulocytes are able to selectively remove proteins, such as the transferrin
14 receptor as well as other membrane-associated enzymes through the formation of exosomes. Due to this work, it has been recommended that EV studies should be conducted on plasma and not in serum because EVs could be generated during blood clotting, after collection.3,4,78–80
About 25% of the total blood EVs are positive for platelet specific markers (CD41a, CD61 and GPIb), which in healthy individuals are mostly derive from megakaryocytes.81,82 This might be a versatile way for platelets to participate in physiological maintenance functions such as haemostasis, immunity or development, because different activatory mechanisms are able to induce platelets to form EVs.83
In the future, blood EVs might have an important role in the identification of changes in the physiological state, such as pregnancy or in diagnosis of several pathological states like tumors. It has been shown that the number, as well as the RNA content of plasma-derived EVs, is modified by both of these states.84,85
1.7.1.5. Urine
After the first descriptions of lipid membrane presence in urine in the 1990s, more recent work in this field was able to characterize urinary-derived EV content in detail.86,87 Despite the fact that CD24 has been proposed as a good urinary EV marker, it is good to keep in mind that EVs found in urine might not all come from the kidney but also from the ureters, the bladder, the urethra or even from the prostate.88,89
The analysis of RNA content from urinary EVs revealed that the entire genitourinary system might be mapped within EVs, pointing to a role in cell regulation. Different Na+ transporter proteins were also found in urinary EVs, which in association with EV-resident proteins, such as the angiotensin-converting enzyme may suggest a role of these EVs in water balance.90–92
Still another role suggested for these EVs is as innate immune effectors once they are enriched in antimicrobial proteins and peptides, bacterial and viral receptors. Coagulations and haemostasis might also be regulated in the genitourinary system by the urinary EVs containing tissue factor (TF).93,94
15 Like other fluids EVs, urine EVs are being studied to access their cargo’s potential usage as biomarkers. Urine is the least invasive body fluid to obtain, which makes urine a good candidate compared to other body fluids.
1.7.2. Methods used to isolate extracellular vesicles
Since there is no consensus on a “gold-standard” method to isolate and/or purify EVs, the ISEV claim that there is no optimal method that should be uniformly used. ISEV also state that the most efficient isolation method probably depends on the scientific question asked and downstream application.95 Moreover, it is becoming clear that some of the described “specific” markers of EVs subsets are just enriched in some of those subsets, being possible to find them in other secreted EVs. This lack of specific markers of the different subsets of EVs is also a major limitation towards their specific isolation.
1.7.2.1. Ultracentrifugation
Ultracentrifugation is the most widely used technique to isolate EVs being even, as described before, used to classify different EVs classes according to their pellet formation. The main criticism to this method is the fact that size/weight is the only criteria making it possible to isolate a certain EV class, but impossible to discriminate specific EVs inside the same class. A huge loss of EVs is also commonly reported when using this method. Other criteria that makes this a difficult method to standardize is its high sensitivity to multiple parameters such as, the force of acceleration (g-force), rotor type, the angle of rotor sedimentation, radius of the centrifugal force and solution viscosity.96
1.7.2.2. Density Gradient Centrifugation
In order to improve the results from the classical ultracentrifugation method, some groups are using density gradient centrifugation (DGC).20,57,97 In addition to the required time that can go from 6 to 90 hours, the gradients used are hyperosmotic which, together with the high g-forces, may lead to disruption and loss of biological activity. Another huge
16 limitation from this method is the fact that it is not possible to discriminate EVs and HDL when plasma is used, since both have similar densities.98 Also the argument that this would be the best approach to discriminate different EVs subsets has been criticized, mainly after knowing that different EVs subsets may have overlapping densities making them hard to isolate by this method.57,99
1.7.2.3. Commercial Kits
Another option to isolate EVs is to use commercial kits. There are different kits available on the market, with the most used ones being the ExoQuick® (Systems Biosciences™) and the Total Exosome Isolation (Life Technologies™). Recent studies showed comparable yield results between commercial kits and UC in exosomes isolation. Having multiple, less tedious alternatives to isolate exosomes will promote more exosome-related studies, helping better understanding of exosomes functions.100,101
The main limitations of this polymer-based methods are: the fact that they co-isolate non-vesicular contaminants, including lipoproteins and, once co-isolated, the presence of the polymer material may not be compatible with down-stream applications.79,96,102
1.7.2.4. Techniques applied to evaluate EVs isolations
There are different techniques used to evaluate EV the isolation and/or purity. According to the literature, the most used are Western Blot (WB), Transmission Electron Microscopy (TEM) and Nanoparticle Tracking Analysis (NTA).103–107
In terms of WB, among the most used markers to identify exosomes, we can find: Alix, Flotillin 1, Caveolin, CD9, CD63, CD81, GAPDH, etc.107–109
TEM is especially useful because it enables the researcher to visualize the approximate size and purity of their purified EVs. However, the size might be slightly overestimated due to sample preparation when using negative staining.110,111
17 Another common way to evaluate EVs isolation, is to use an NTA device which combines the properties of both light scattering and Brownian motion, to evaluate the size distribution and concentration of particles in a liquid suspension.100
1.7.3. Flow cytometry as a method to isolate extracellular vesicles
1.7.3.1. Flow Cytometry
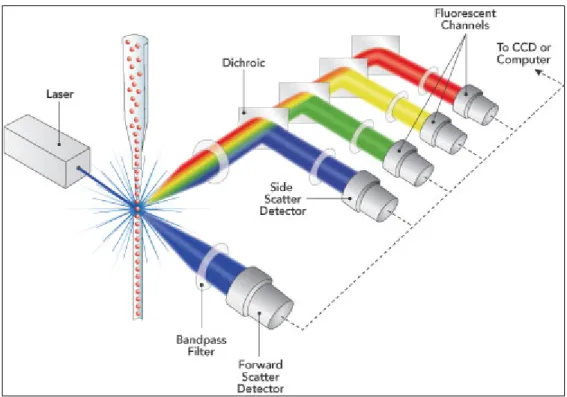
Flow cytometry is a technique that allows the analysis of thousands of particles per second (such us cells, bacteria, yeast, picoplankton, chromosomes and nuclei) detecting multiple parameters of each individual particle within heterogeneous populations. In order to archive that, the flow cytometer is traditionally divided in three different parts: the fluidics, the optical pathway and the electronics.
Figure 1.8 Schematic representation of how the 3 main parts of a flow cytometer work together. Adapted from www.semrock.com/flow-cytometry.aspx.
18 The main goal of the fluidics part is to take the particles from the sample tube and allow them to cross the laser beam one-by-one. The laminar flow and the hydrodynamic focusing are the two principles behind the fluidics part.
The optics are responsible for collecting the light, both scatter and fluorescence that each particle emits when it is at the interrogation point (the point where the particle crosses the laser beam). While the number of fluorescent channels will be dependent on each machine’s configuration, two scatter parameters will always be collected with every equipment. These two scatter parameters are the forward scatter (FSC) and the side scatter (SSC). While the FSC can only be measured from the reference laser (conventionally the 488 nm one), the SSC may be measured with every laser line available on the machine.
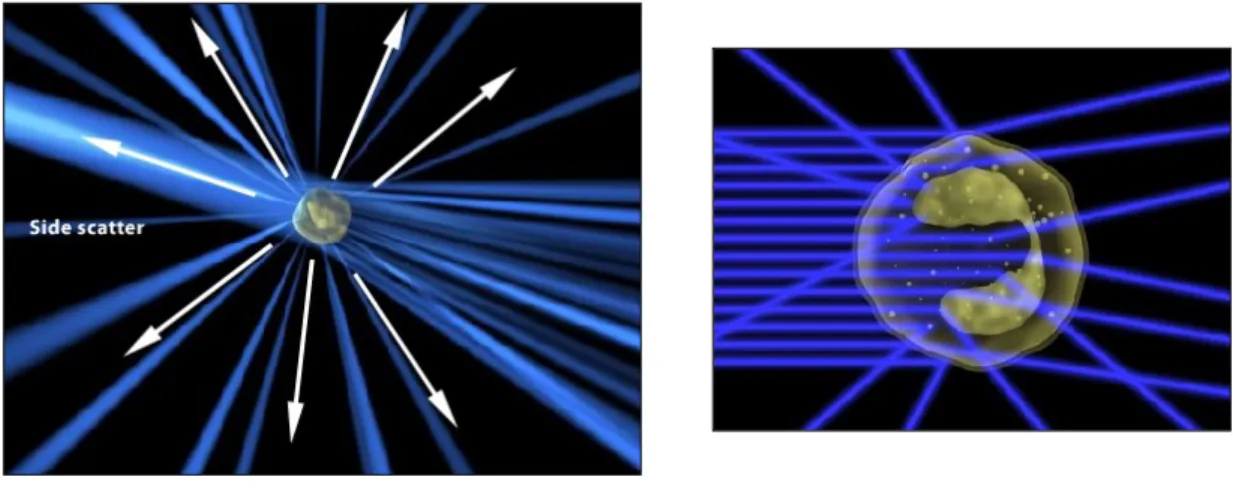
The FSC is the measurement of the refraction light measured in the same direction as the laser light is travelling (forward) and the intensity of this signal is roughly proportional to the particle size and membrane integrity.
19 The SSC is the measurement of the light scattered at 90˚ from the laser’s axis. Side scatter is mainly caused by granularity and structural complexity inside the cell/particle.
Figure 1.9 How FSC and SCC scattered light is measured by a flow cytometer. Adapted from https://www.bnitm.de/seeis2010/presentations/introduction_flowcytometry.pdf
The electronics are responsible for quantifying and converting the signal from light to digital values, creating a spreadsheet that generates a flow cytometry standard (FCS) data file. These FCS files allow the final user to analyze the data using specific software.
1.7.3.2. Fluorescent activated cell sorting
Fluorescence activated cell sorting (FACS) machines came to the market in the early 1970s and were well accepted because they allowed researchers to simultaneously stain, analyze and sort defined populations from different tissues or fluids.
The number of fluorescent parameters that can be detected simultaneously has increased over the years. Nowadays, we are able to measure eighteen different fluorescent parameters, plus two scatter parameters.
In terms of equipment, a FACS machine is roughly a flow cytometer as described before with an extra module that allows breaking of the continuous stream into droplets that may be charged and posteriorly deflected, if the drop contains a particle of interest.
20
Figure 1.10 Schematic of how FACS are able to isolate different particles. Adapted from www.abcam.com/protocols/fluorescence-activated-cell-sorting-of-live-cells.
1.7.4. FACS of EVs
Although flow cytometry has already been used to characterize different EV subsets, not many researchers are relying on this technology to isolate EVs. As all the other methods described before, fluorescence activated cell sorting presents both advantages and disadvantages.
Within the most cited disadvantages are the swarming detection, low sensitivity on scatter channels and difficulty to standardize protocols and analysis. On the other hand, the promise of increased specificity and high purity of isolated EVs makes researchers
21 aware of FACS and follow its evolution. Both of these disadvantages and advantages will be more thoroughly discussed below.
1.7.4.1. Limitations
1.7.4.1.1. Swarming detection
First described in 2012, this term is used when more than one EV crosses the laser beam at the same time. This is due to the fact that EVs diameter is much smaller than the laser’s beam (Figure 1.11). The easiest way to avoid swarm detection is to dilute the sample which will decrease EVs concentration, making it less probable to have multiple EVs crossing the laser at the same time.112–114
Figure 1.11 Schematic of swarming detection. Adapted from (111).
1.7.4.1.2. Low sensitivity on scatter channels
It was commonly accepted that a classical flow cytometer could detect polystyrene beads of about 200 nm, so this is considered the sensitivity of the instrument regarding the scatter parameters. Nowadays, new machines come with an improved sensitivity that may detect as low as 100 nm polystyrene beads. An important concept here is that polystyrene beads have a refractive index of 1.61, while EV refractive index is lower than 1.4, meaning that in terms of EVs, the sensitivity proposed is about 180 nm. In order to
22 avoid this limitation there is the valid option of using a fluorescent channel to set the threshold instead of using the size detector (FSC).115–117 This approach may not be always possible because, at least for now, there is no such thing as a generic fluorescent label for all EV subsets.115
1.7.4.1.3. Standardization problems
As different flow cytometers have different optical configurations and different sensitivities, data interpretation and data comparison between laboratories is not straightforward. Different research societies are currently working on it and they were able to create a software (available at www.exometry.com) to correct these differences between laboratories. The main problems are that this software is not easy to use and also from the thirty-three laboratories participating in those studies, about 1/3 was not able to detect EVs with ≤ 1µm.
1.7.4.2. Advantages
1.7.4.2.1. Specificity
FACS is already widely used due to the capacity of detecting and differentiating specific fluorescent wavelengths even when their emission is quite close between them. When different subsets of EVs would be clearly characterized and specific fluorescent markers would be available, FACS could be a way to isolate a specific subset of EVs better than a bulk isolation method such as ultracentrifugation.
1.7.4.2.2. Purity
Everyone’s dream would be to be able to isolate different subsets of EVs the same way we are able to isolate different cell populations now. If, in the future, FACS achieves the same performances sorting EVs as sorting cells today, the EVs isolated by FACS could potentially be about 99% pure.
23
2. Aim of the project
The aim of this project is to evaluate the possibility to consider FACS as a reference technology to isolate EVs and even their different subsets.
3. Materials and Methods
3.1. Sample Preparation
3.1.1. Cell culture
Retinal pigment epithelial 1 (RPE-1) cells (RRID: CVCL_4388) were used throughout. Cells were grown in DMEM GlutaMAX™ (Gibco® 31966) supplemented with 10% Fetal Bovine Serum (FBS; Pan Biotech™) and 2 mM antibiotics (P/S: Penicillin and Streptomycin). Cells were infected with virus containing mCherry-CD9 (Squadrito ML et all118) and were sorted to isolate cells with high expression of mCherry. Aliquots of cells were frozen down after sorting and then each aliquot was thawed and only used for 4-5 passage to keep high expression of mCherry-CD9. For passage, cells were washed once with PBS-EDTA (Bio Concept™ 5-32F00-I) and trypsinized (Gibco® 25300-054).
3.1.2. Cell suspension
Cells were passed as normally to 50% confluency and then media was switched to DMEM GlutaMAX™ with 10% GroPro® (Zenbio SER-HPL-GROPRO) and 2 mM antibiotic (P/S). After 24-48 hours at 37 °C, conditioned media was removed and spun 10 minutes at 4000 rpm. Supernatant was carefully removed and saved for sorting.
For the mass spectrometry analysis, two additional samples were prepared. The first one was conditioned media from cells that were exposed to OptiMEM® (OM; ThermoFisher™ Scientific CN: 31985062) supplemented with 2mM antibiotic (P/S) overnight. The second sample, was conditioned media from cells that were exposed to
24 the media for cell growth (DMEM GlutaMAX® with 10% FBS and 2 mM antibiotics) for 48h.
3.2. Fluorescent activated cell sorting (FACS)
3.2.1. Equipment configuration
A Beckman Coulter MoFlo Astrios EQ™ with 4 laser lines spatially separated was used for this work. It gives the possibility to go up to seventeen fluorescence parameters and two FSC due to a beam splitter option. SSC detection from the violet laser (405 nm) by changing the band pass filter in the first detector from that laser is another advantage of using this cell sorter. Being a jet-in-air cell sorter makes it faster and more suitable for long sorts when compared to a cuvette cell sorter.
Laser BP Filter Laser BP Filter
Violet 405 nm 55 mW 795/70 Yellow/Green 561 nm 200 mW 795/70 710/45 710/45 664/22 664/22 625/15 620/29 600/14 586/15 526/52 488/59 Red 640 nm 100 mW 795/70 Blue 488 nm 200 mW 710/45 722/44 526/52 671/30
25 Different options like using or not the FSC beam splitter, the best laser line to capture the SSC, which nozzle to use or even what should be the best pressure applied were among the discussed and/or tested parameters.
Final configuration was without the beam splitter on the FSC in order to collect as much light as possible on the FSC 1. This allowed us to have the best separation possible between the background and the smaller vesicles. No significant difference was found between using the SSC from the 488 nm or from the 405 nm laser, so we used the former to try to avoid as many configuration changes as possible from the default configuration. The 100 µm nozzle was used mainly due to convenience for the facility. This machine is used for a large number of users with different applications and changing a nozzle in a machine like this is very time consuming and laborious. Temperature applied was 4 ˚C for both sample and collection tubes.
3.2.2. Sheath fluid
The sheath fluid used is an 8x concentrate solution from BioSure® (Cat# 1027), diluted to 1x with MilliQ water and filtered using Stericup-VP 0.1 µm PES 1000ml Millipore® (Cat# SCVPU11RE). The same 1x PBS filtered at 0.22 µm was also tested
3.2.3. Sample tubes
BD™ polypropylene Falcon™ 15 mL tubes (Cat# 352097) were used for sample tubes. Home-made glass tubes were also tested.
3.2.4. Commercial beads
For size determination, Apogee Flow Systems™ mix beads (Cat# 1493) were used. Each vial consisted of beads with 8 different sizes, ranging from 110 nm to 1300 nm. The 100 nm and the 500 nm beads are made of latex and emit a green fluorescence when excited at 488 nm. All the others are plastic made and non-fluorescent.
26
3.3. Western Blot
Sorted samples were precipitated using standard acetone protein precipitation and resuspended in SDS sample buffer. The protein pellet was denatured by addition of SDS sample buffer with β-mercaptoethanol and incubation for 5-10 min at 95 °C. Samples were migrated on precast Novex 4-20% or 4-12% polyacrylamide gels (ThermoFisher Scientific™), then transferred to Novex nitrocellulose membranes (ThermoFisher Scientific™) using iBlot 2. Blocking and antibody steps were performed using 5% milk in PBST (PBS with 0.5% Tween-20). Primary antibody steps were incubated overnight at 4 °C with gentle shaking while the membranes were incubated with secondary antibodies for 1 h at room temperature (RT). Antibodies used as primary included: anti-Alix (Covalab™ Cat# pab0204, RRID: AB_2716810); Flotillin1 (homemade); anti-Caveolin (Santa Cruz Biotechnology™ Cat# sc-894, RRID: AB_2072042); anti-α-actin (Millipore® Cat# MAB1501, RRID: AB_2223041); anti-GAPDH (Sigma-Aldrich™ Cat# G8795, RRID: AB_1078991); anti-α-tubulin (Sigma-Aldrich Cat# T5168, RRID: AB_477579); and anti-CD81 (Santa Cruz Biotechnology™ Cat# sc-166028, RRID: AB_2275895). Two different secondary antibodies were used, depending on the host species of the primary. For the first three, it was HRP-conjugated Donkey anti-Rabbit HRP conjugated (GE Healthcare™ Cat# NA934, RRID: AB_772206) and for the last four the secondary antibody chosen was HRP-conjugated Sheep anti-Mouse (GE Healthcare™ Cat# NA931, RRID: AB_772210). Three to five washes of PBST were performed before developing using the Super Signal West Dura solutions (Thermo Fisher Scientific™) and the Fusion Solo® chemiluminescence imaging system.
3.4. Nanoparticle Tracking Analysis (NTA)
The NanoSight® model used was the NS300 from Malvern Instruments Ltd™. The wavelength used was the 488 nm and the sample was injected using the NanoSight syringe pump, to ensure a constant flow rate.
27
3.5. Transmission Electron Microscopy
3.5.1. Sample preparation
The method selected was the Negative staining and the grids used for transmission electron microscopy (TEM) experiments were carbon film only, square mesh and standard thickness, from Electron Microscopy Sciences™ (Cat# CF400-Cu). They were glow discharged for 30s at 2.0^10-1 mbar.
Once this first step was done, the grids were prepared using the subsequent negative staining protocol. First, 15 µL were pipetted from the sample into a square of laboratory parafilm forming a drop. The microscope grid was placed on top of it with the black side down for 2 minutes. The grid was transferred to a wash container with ddH2O for 5 minutes. During that time, a drop of 15 µL of uranyl acetate was pipetted into the parafilm. Once the 5 minutes were over, the grid was removed from the wash container, and the excess of ddH2O was dried out by slightly touching a bit of paper. The grid was placed on top of the uranyl acetate drop for 30 seconds. The grid were removed from the uranyl acetate, the excess was dried as before and left to dry upside down on the tweezer. After 10 minutes, the grid was dry and could be stored for later analysis.
3.5.2. Equipment used
The electron microscope used was a Tecnai™ Spirit BioTWIN® with 120KV.
3.6. Mass Spectrometry
Sorted samples were acetone precipitated as for Western blot but then resuspended in 50 mM Tris and 2% SDS, and quantified using Bicinchoninic Acid (BCA) protein assay (Interchim Uptima™ 40840A).
Protein extracts were digested using the FASP procedure as previously described.119 Peptides were desalted using stageTips120 and dried using a vacuum
28 concentrator. For LC-MS/MS analysis, resuspended peptides were separated by reverse phase chromatography on a Dionex Ultimate™ 3000 RSLC nano UPLC system connected in-line with a Qexactive HF® (ThermoFisher Scientific™, Waltham, USA). Raw data were processed using Proteome Discoverer 2.2. Data analysis was further processed and inspected in Scaffold4 (Proteome Software™, Portland, USA).
29
4. RESULTS
4.1. Is it possible to sort so small?
In order to answer this question, the first approach was to attempt to sort small beads. We used the Apogee™ Mix beads for this experiment, because the 100 nm and the 500 nm beads have green fluorescence. In Figure 4.1 it is possible to see the gates used to sort these 2 bead sizes, when displaying FSC versus the green fluorescent channel.
The value written below the gate’s name corresponds to the percentage of events inside the gate, within the total of displayed events.
Figure 4.1 Gating strategy to sort Apogee beads with two specific sizes.
After checking that the identification of both sizes was possible, we sorted both populations into different collection tubes and, to prove that we could correctly sort them, we performed a purity control, which is acquiring the collection tubes and verifying what we actually sorted. The results are displayed in figure 4.2.
30
Figure 4.2 Purity control results from the sorted beads.
It is always important to remember, one of the problems with EVs is the background level so in order to have a more correct idea of what we have in the collection tubes, we must remove the background level from our analyses. (Figure 4.3)
31 The previous picture shows that we can achieve about 80% purity when sorting 100 nm and 500 nm beads with our instrument configuration and sorting strategy.
To confirm these results using a different technique, we decided to try the NanoSight NS300®. The result from the NanoSight analysis from the 100 nm sorted beads is shown in the following figure (Figure 4.4).
Figure 4.4 NTA analysis from the 100nm sorted beads.
The NTA analysis has shown that around 67% of the sorted 100 nm beads had sizes between 80 and 120 nm. This NTA analysis confirmed the FACS data shown previously.
32
4.2. First Sorting Attempt
4.2.1. Cells
For our experiments we decided to use RPE-1 cells because we wanted nontumor cells and also because these cells are widely used and therefore, well reported on the literature.109,121 Our RPE-1 cells expressed CD9-mCherry (Fig.1) after infection with the construct described and characterized in Squadrito ML et al.118 As seen below, most of the CD9-mCherry fluorescence is punctate in appearance, belonging to vesicle-like perinuclear and cytoplasmic regions, consistent with endosomal localization. This is reassuring as CD9 is found in MVBs and specifically in ILVs, which is why it is also a favored exosomal marker. Some more diffuse CD9-mCherry staining can also be seen at the plasma membrane, consistent with CD9 having a cell surface role, as well. Overall, labeling CD9 with the mCherry fluorescent protein does not seem to disrupt its natural localization.122,123
33
4.2.2. Gating strategy
Encouraged by the results from the beads, we continued to try to isolate EVs, namely exosomes, from the cultured cells previously described.
Figure 4.6 Gating strategy applied on the sort. “mCherry neg” and “mCherry pos” populations were sorted. “mCherry pos” selected cells have a homogeneous dispersion regarding the relative size, FSC.
34 As a starting point, the strategy was to follow a simple gating hierarchy, by combining the SSC signal from the 405 nm laser with the fluorescent channel for the mCherry expression. Then, from this “EVs” gate, we plotted mCherry versus another non-used fluorescent channel and we sorted those two populations: one that we called “mCherry neg” and the other called “mCherry pos”. On the third dot plot we could see that the particles inside the “mCherry pos” gate formed a single and homogeneous population in terms of size (FSC). 50.000 events from each population were collected.
4.2.3. Western blot results
We took those sorted samples and checked them for known exosome markers. We were able to observe a slight enrichment of different known EV markers (Alix, flotillin, tubulin, GAPDH, and caveolin) in the “mCherry pos” sorted vesicles as compared to the “mCherry neg” sorted vesicles. However, we could still see some of these markers in the “mCherry neg” sample as it could contain unlabeled exosomes or microvesicles that also contain Alix, flotillin, tubublin, GAPDH, and caveolin. Some other markers were not detected in either sample such as actin and CD81, which is not too surprising as different cells have different levels of these various markers. Two different results are shown below with both of them showing enrichment in the “mCherry pos” sample as compared to the “mCherry neg” sample for Alix, flotillin, and caveolin.
mCh
e
rr
y
mCh
e
rr
y
35
Figure 4.7 Western blot results from sorted EVs.
At this point it was clear that we were sorting EVs, but we wanted to characterize our EVs by size. We sorted identical populations as before but were consistently unable to get any accurate analysis from the NanoSight equipment, probably because the concentration of our samples was too low.
m C her ry pos m C h e rry Ce lls Ce lls P re c ip CM
36
B
To overcome this problem, we went back to flow cytometry and we ran the same Apogee beads that we had sorted before with the setting that were applied when we sorted EVs.
Figure 4.8 Relative size comparison between mCherry positive sorted EVs and Apogee™ beads.
Figure 4.9 (A) Apogee™ beads dispersion with new scatter settings. (B) Apogee™ beads sizes and fluorescence. Beads with sizes written in green emit green fluorescence.
Apogee Beads
110 nm
180 nm
240 nm
300 nm
500 nm
590 nm
880 nm
1200 nm
300 nm 100 nmA
240 nm 300 nm 500 nm 500 nm37 Results from figure 4.8 have shown that those EVs sorted before had an approximate size of 500 nm or even bigger, due to the refractive index difference between EVs polystyrene or silica beads. EVs below 200 nm would fall below the threshold, making them impossible to see and consequently to sort.
Based on those results, we realized that scatter settings needed further optimization in order to be able to see beads with size of about 100 nm. (Figure 4.9 A) It is possible to distinguish the different beads sizes based on their fluorescence due to the fact that 100 nm and 500 nm Apogee™ beads emit green fluorescence.
4.3. Further optimization
Looking at the last results from figure 4.9 (A), it became obvious that we needed to optimize our sorting conditions before being able to sort exosomes with high purity. Results that have determined the machine configuration and materials chosen are shown over this section.
4.3.1. Using or not a beam splitter
The cell sorter used in this project enables us to use a beam filter that splits the light from the 488 nm laser in two (60/40). The main advantage is that we have two different detectors for the FSC, meaning we can use one of them to set the threshold and the other one to set a gate in order to define our sorting strategy.
Figure 4.10 Schematic diagram of a beam filter localization and function.
488 nm laser 40 % 60 % Beam splitter FSC 1 detector FSC 2 detector
38 On the other hand, splitting the light from the 488 nm laser decreases the amount of light arriving at each detector. In the case of EVs it is essential to get as much light as possible into the FSC detector to discriminate them from the background in terms of FSC.
Figure 4.11 Median Intensity Fluorescence (MFI) of the background in the FSC channel. In A with the 488 nm beam splitter and in B without it. In A, MFI= 4.05 and in B, MFI= 6.27.
Figure 4.12 Median Intensity Fluorescence (MFI) of the Apogee beads in the FSC channel. In A with the 488 nm beam splitter and in B without it. Numbers 1 (300 nm), 2 (590 nm) and 3 (1200 nm) correspond to different beads size. In A, MFI 1= 64.9, MFI 2= 2699 and MFI 3= 33301. In B, MFI 1= 115, MFI 2= 5070 and MFI 3= 62152.
Beam Splitter
No Beam Splitter
1
1
2 2
3 3
Beam
Splitter
No Beam
Splitter
A B
39 These results have shown that removing the 488 nm beam splitter does not have a major impact on the background level. On the other hand, not using the beam splitter can be useful to better resolve small size populations from the background. Therefore, we chose to not use the beam splitter in further sorting procedures.
4.3.2. Measure the SSC from the 488 nm or from the 405 nm laser
From all the different tests to validate that the 405 SSC would be a better choice than the SSC from the 488 nm laser, none of them gave a clear conclusion. Some of them even seemed to point the 488 SSC as a better option. Due to these results, we have chosen to use the 488 SSC justified by the fact that it is one less change that we need to perform from the standard equipment configuration.
4.3.3. Sheath fluid filtration at 0.1 or 0.22 µm
Figure 4.13 Differences in the background between using 0.1 µm (A) or 0.22 µm (B) filtered PBS as sheath fluid. Both (A) and (B) display similar numbers of events.
40 Even though the FACS used in these experiments is already equipped with a 0.04 µm sheath filter, differences in the background given from both PBS options tested were observed. The SSC from the 488 nm laser seems to be one of the most affected detector. Based on these results we decided to use PBS filtered at 0.1 µm as sheath fluid in our experiments.
4.4. Final Sorting strategy
After going through all the optimization steps, we set the final instrument configuration and the gating strategy. In terms of equipment: no beam filter; 488 SSC channel chosen; PBS filtered at 0.1 µm as sheath fluid; and, threshold on the mCherry channel. The gating strategy was the one in the following picture.
Figure 4.14 Definition of the mCherry positive gate according to the background level.
We set the mCherry positive gate having as reference the background level for that channel (Figure 4.13). Then, from the population selected as “mCherry pos” we plot them showing 488 FSC versus 488 SSC. (Figure 4.14)
41
Figure 4.15 (A) Populations inside the “mCherry pos” gate dispersion in 488 FSC versus 488 SSC. (B) Background on these two channels.
After that, we removed the background level and defined our sorting gate. (Figure 4.15)
Figure 4.16 (A) Populations inside “mCherry pos”. (B) Dot plot showing 2 populations easily distinguishable. In both pictures we are seeing all the information minus the background information selected in figure 4.15.
A B
42 As we can see in figure 4.15 (B), we had two well defined populations above the background level. As we already knew from previous attempts, independently from the downstream application, we would always need to collect a huge number of vesicles.
Despite the “P1” population being more closely aligned with theoretical exosome size, we decided to sort only the “P2” population. Since it represents about 94% of all the mCherry positive vesicles it should give us the opportunity to recover the necessary number of vesicles.
43
4.5. Transmission electron microscopy data
Another method widely used to validate isolated EVs is TEM. Figure 4.16 was obtained from sorted EVs by FACS, using the optimized setting described in the last section.
44 When we analyzed this picture from the “P2” sorted population, we were able to see that the big majority of the identified vesicles seemed to have less than 125 nm in diameter, matching the size defined for an exosome.
We have also sorted vesicles from the “P2” population to perform mass spectrometry analysis. This sort was performed on 2 different samples, one in OptiMEM® (OM) minimal media and the other one in regular cell media with FBS. In terms of total protein concentration, we obtained about 2 ug from the OM sample, and 10 ug from the FBS. This is not too surprising as the FBS sample may have had proteins from the serum that were sticking to the exosomes and therefore increasing the protein amount in the final sample.
45
4.6. LC – MS/MS results
Figure 4.18 Raw data visualization using Scaffold® from Proteome Software™, Inc.
We started the LC – MS/MS results by deleting all the proteins whose origin was “Bovine” because they would come from the serum. As expected, it was easily seen that the FBS sample had much more bovine proteins than the OM one. After this first step, we ended up with the following protein list. (Table 4.1)
46 The next step was to look for the identified proteins on the website www.uniprot.org in order to obtain the protein’s complete name and also their subcellular location / cellular component. With this information we then eliminated the proteins which where only present in the membrane, cytosol, nucleus or extracellular region. All of those are highlighted in red in table 4.1.
Sample Gene Protein Extracellular region or secreted
OM SFN 14-3-3 protein sigma Extracellular exosome / Extracellular space
OM AMY1A Alpha-amylase 1 Extracellular exosome / Extracellular space
OM ENO1 Alpha-enolase Extracellular exosome / Extracellular space
OM ANXA2 Annexin A2 All endosomes / Extracellular exosome / Extracellular space
OM ARG1 Arginase-1 Extracellular region
FBS OM
OM CASP14 Caspase-14 Nucleus / Cytosol
OM CAT Catalase Extracellular exosome / Extracellular space
OM CSTA Cystatin-A Nucleus / Cytosol
FBS OM
OM DSC1 Desmocollin-1 Membrane / Extracellular exosome
OM DSC3 Desmocollin-3 Membrane / Cell junctions
OM DSG1 Desmoglein-1 Membrane / Cytosol
OM DSP Desmoplakin Nucleus / Extracellular exosome
OM FABP5 Fatty acid-binding protein 5 Extracellular exosome / Extracellular space
OM NCCRP1 F-box only protein 50 Cytoplasm / Extracellular exosome
FBS OM
OM FLG Filaggrin Nucleus / Cytosol
OM FLG2 Filaggrin-2 Nucleus / Cytosol
OM ALDOA Fructose-bisphosphate aldolase A Extracellular exosome / Extracellular space
FBS OM
OM GGCT Gamma-glutamylcyclotransferase Cytoplasm / Extracellular exosome
OM GSDMA Gasdermin-A Membrane / Cytosol
OM GAPDH Glyceraldehyde-3-phosphate dehydrogenase Extracellular exosome / Extracellular space
OM HSPB1 Heat shock protein beta-1 Extracellular exosome / Extracellular space
OM HSP90AB1 Heat shock protein HSP 90-beta Extracellular exosome / Extracellular space
FBS OM
OM KPRP Keratinocyte proline-rich protein Cytoplasm / Extracellular exosome
OM PRDX1 Peroxiredoxin-1 Extracellular exosome / Extracellular space
OM PRDX2 Peroxiredoxin-2 Cytoplasm / Extracellular exosome
FBS OM
Extracellular exosome / Extracellular space
HRNR Hornerin Extracellular exosome / Extracellular space
SERPINE1 Plasminogen activator inhibitor 1 Extracellular exosome / Extracellular space
Extracellular region
DCD Dermcidin Extracellular exosome / Extracellular space
FN1 Fibronectin Extracellular exosome / Extracellular space / Blood microparticle
CALML5 Calmodulin-like protein 5
![Figure 1.6 Proteins and RNAs transfer by EVs. MVs and exosomes may dock at the plasma membrane of a target cell [1]](https://thumb-eu.123doks.com/thumbv2/123dok_br/18941749.939669/25.918.136.785.345.825/figure-proteins-rnas-transfer-exosomes-plasma-membrane-target.webp)