Glauco Favot
Production and identification of Ulva sp.
in multitrophic aquaculture in earth ponds
Glauco Favot
Production and identification of Ulva sp.
in multitrophic aquaculture in earth ponds
Tese d e Mestrad o em Biol ogia Marinh a
Trabalho efet uado s ob a ori ent ação de: Dout ora Maria Emília Cunha (Investi gadora Auxil iar do Instit uto Português do M ar e Atmos fera) Prof. Doutora Ester Serrão (Professora Associada , Uni versi dade do Al garve)
iii Título: P roducti on and identificati on of Ulva s p.
in mult itrophic aquacult ure i n eart h ponds
Decl aração de Autori a de Trabal ho
Declaro ser o autor deste trabalho, que é original e inédito. Autores e trabalhos consultados estão devidamente citados no texto e constam da listagem de referências incluída.
iv Copyright
A Universidade do Algarve reserva para si o direit o, em conformidade com o disposto no C ódi go do Di reito de Autor e dos Di rei tos Conexos, de arqui var, reproduzi r e publi car a obra, i ndependent em ent e do m eio util i zado, bem com o de a divul gar através de reposit óri os ci ent ífi cos e de admit ir a sua cópi a e distribui ção para fins meram ent e educaci onais ou de invest i gação e não
v
Agradecimentos
Começo por dizer que não sou um bom orador e nem sequer um bom escritor, pelo que vou tentar agradecer a todos o melhor que puder. Espero que ninguém me leve a mal se eu começar pela minha família, que sempre me apoiou e teve a capacidade de aguentar os meus momentos menos conseguidos, motivando-me e dando-me força. Depois, os profissionais com quem trabalhei desde a minha chegada a Portugal e com quem tanto aprendi — peço desculpa se não estive sempre à altura das vossas expectativas. Quero agradecer à Doutora Emília Cunha por ter sempre acreditado em mim e na minha capacidade: muito obrigado. “Thank you”, Doutor Aschwin e ao seu “A-Team”, foram incontornáveis na minha
aprendizagem em termos de filogénese. Muitas graças também à Doutora Ester Serrão, pelo grande contributo que deu, desde aquele longínquo dia de setembro no Porto, para que eu percebesse a verdadeira importância das algas. Agradeço e envio um forte abraço a todos os membros da estação EPPO, em vocês encontrei uma família que me fez apaixonar pela Aquacultura, algo que até então nunca imaginara possível. Obrigado, Mestre Hugo Alexandre Quental Ferreira, ajudaste-me todas as vezes que eu precisava de uma mão e, quando tu não podias, logo sabia que podia confiar no Mestre Nuno, você são mesmo o topo. Obrigado, Doutora Paula Moura e Doutor Miguel Gaspar, foram os primeiros a acolher-me neste país, sem vocês a minha aventura nem teria arrancado. Menção ainda para o meu grande amigo Rolando, “O Professor”, ajudou-me não apenas a aprender o português (se não é tão bom assim, a culpa é minha!) e tornou-se um amigo verdadeiro que sempre ficará no meu coração junto com a sua Rosa.
Agora queria ter um ecrã onde pudesse fazer correr os nomes de todos aqueles que até aqui entraram na minha vida desde eu pisei o solo português, mas acredito que vocês sabem mesmo a quem me estou a referir. Obrigado, Portugal, uma nação que soube acolher-me e dar-me uma oportunidade de dar um rumo e um sentido à minha vida depois de anos deveras complicados. Aos inolvidáveis amigos que deixei na minha terra, a Itália, tenho apenas a dizer: “Siete sempre nel mio cuore”.
Enfim, espero que ninguém tenha ficado magoado por não ter sido mencionado, mas não é muito comum para mim escrever agradecimentos; as minha últimas palavras, mas nem por isso as menos importantes, vão para os meus sobrinhos, em quem sempre pensei nos momentos mais difíceis, e para minha mãe: “Grazie Mamma, sei la migliore”.
vi Resu mo
A aquacul tura é o s etor de produção ani mal para o consumo hum ano que m ais rapidam ent e tem cres cido no mundo, para além de que é um contri bui nte important e para o abast ecim ent o m undi al de alim entos e para o cres cim ento económico. Os efluentes da aquacul tura intensiva podem causar eutrofiz ação nas águas cost ei ras e ori ginar impactos negativos nas comuni dade s biol ógi cas dessas áreas. É muit o import ant e para o des envol vimento do sector aquí cola que s e encontrem s oluções adequadas para reduzir o excess o de nutrientes proveni ent es dos efl uentes da aquacultura. A utiliz ação de m acroal gas com o biofiltros ativos aj uda a reduzir as carga s de nut ri ent es dissol vidos dos efl uent es da aquacul tura. As espéci es do género Ulva, que possuem taxas de crescim ent o alt as e t eores de az oto el evadas na compos ição dos t ecidos, s ão boas candidat as para bio rem ediar as concent rações de nutri ent es na água, além de t erem um a função ativa sobre no sequestro de carbono. As espéci es de Ul va têm sido tradici onalment e ut ilizadas para nutri ção hum ana e anim al pois poss uem um a concent ração el evada de proteí nas. Nos últimos anos desenvol veram -se técni cas que permit em transform á -l as num a font e im port ant e de bi ocombustível e de ulvano. O enorme pot en ci al com erci al dest e último produto pode tornar a produção des tas al gas ainda m ais lucrati va. Es te trabal ho fez a i denti fi cação das es péci es de Ul va que s e des envolvem nos t anques de terra da est ação Pil oto de Pis ci cultura de Olhão e que s e l ocalizam na Ri a Formosa (s ul de P ortugal), avaliou a taxa de cres cim ento e a biom as sa produzida por um a dest as espéci es, Ulva flexuosa, e det erm inou o valor da sua produção prim ária l í quida anual (NPP , acrôni mo em ingl ês). Nest es t anques as macroal gas foram cultivadas em doi s si stem as multit róficos int egrados: um sistema IMTA (acrónimo em inglês para “integrated multitrophic aquaculture”) contendo organism os autot rófi cos (fit oplânct on, Ul va fl exuosa ), espéci es filt radoras (C ras sost rea gigas ) e organi smos com ali mentaçã o exógena ao sistema (Ar gyrosomus r egi us , Mugil cephalus , Diplodus s argus ); e um si stema constituí do apenas por peixes e Ul va fl exuosa . A espéci e de Ulva cult ivada na est ação de aquacul t ura foi s el ecionada por se desenvolver nat uralm ent e no canal de des car ga dos efluent es da instal ação evidenci ando um a boa adaptação às variações s azonai s de t emperat ura do local e aos alt os níveis de irradi ação solar e de amóni a. A identi ficação t axonómica das al gas foi feita pel a t écni ca
vii molecul ar conhecida como ‘DNA barcod i ng’. Est a técni ca é uma met odologi a que uti liza um curt o marcador genéti co pres ent e no DNA do organismo para o identificar como pert encent e a um a espécie parti cul ar. Nes te ens aio foi us ado o marcador m ol ecul ar ITS ( acrónimo em ingl ês para ”int ernal transcri bed spacer”), que permitiu a identificação de seis espécies do gênero Ulva presentes nos t anques de terra. Ent re el es , a espécie culti vada acabou por ser ident ifi cada com Ul va fl exuos a. Os dados genéti cos recolhidos nesta experi ênci a podem levar a concluir que a ori gem da macroal ga culti vada nos t anques de t erra da EPPO poderi a s er do P acífi co Nort e. Esta é a prim ei ra descrição de Ulva
flexuosa para o sul de Portugal . C ontudo, novas questões foram levant adas
devido à des cob ert a de li nhagens disti ntas com o nom e dest a espéci e, us ando sequências publi cadas P ara al ém disso o morfotipo "fol ha de al face" foi obs ervado pela prim eira vez para as espéci es m arinhas de Ul va fl exuos a. A produção de bi om ass a e a t axa de cres cim ento foram t es tadas comparando: a) os dois si stem as multit róficos utiliz ados ( IM TA (peixe + ost ra + Ul va ) e 'P eixe + Ul va '); b) quat ro diferentes densidades ini ci ais (15 , 30, 50 e 60 g/m2)
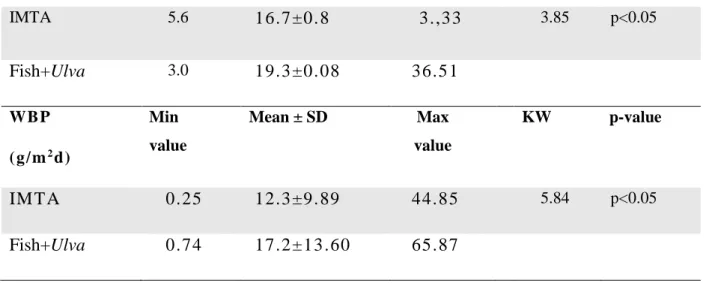
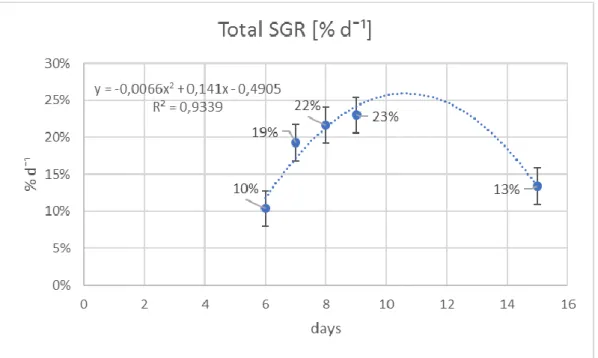
; c) ci nco ci cl os de produção e colheit a (6, 7, 8, 9 e 15 dias ). A t axa de crescim ent o específi co (SGR ) de Ulva fl exuosa result ou s er si gnificati vam ente diferente entres os dois sis tem as m ultit róficos (p<0.05) e mai or no sist em a de ‘Peixes + Ulva’(19.3 ± 0.08% dia- 1) do que no sis tem a IM TA (16 .7 ± 0 .8% di a -1). A evolução t em poral da SGR e da biom assa produzida durante a experiência
apresentou um padrão sinusoi dal com dois pi cos . A dimi nuição no outono parecer t er sido res ultant e da dimi nui ção sazonal da t emperat ura e do perí odo de l uz enquanto que o decrés cimo no m ês de Agosto pode t er si do res ult ant e do própri o ci clo de vi da da macroal ga e da falt a de nut rient es. Houve di ferenças si gni fi cat ivas entre diferentes densidades (p<0.05) e di ferentes períodos de culti vo(p<0.001). A densidade de 30g por m2 foi a que apres ent ou mel hores SGR (23 ± 3. 9% di a- 1) ent re as quat ro test adas enquanto que o perí odo de cultivo que produziu melhores SGR foi de sete a nove dias (≈ 21% dia- 1). P ara
obt er dados m ais porm enoriz ados sobre os períodos de t empo de cultivo óptimos e a produção de biom assa seca e húmida realizou -se uma experi ênci a de oi to di as. Em oito jangadas , de 1 m2 cada um a, foram colocados 30 gramas
de Ul va s p.. Nos oit os di as seguintes, uma j angada foi am os tra da di ariam ente , e as al gas removidas , pesadas e secas . Para evit ar possí vel perda de bi omass a
viii das al gas por dist úrbio do s peixes as j angadas foram prot egid as por um a rede de pl ásti co . A produção prim ári a e a captura de C O2 pel a Ulva fl exuos a foi det erminada co m base num a experiênci a de i ncubação realiz ada em ambi ent e controlado. A produção prim ári a es t imada em condi ções l aborat ori ais controladas foi de 1.21 m g C g- 1 DW h- 1 resul tando num a produção prim ári a anual de 106 g C m- 2 ano- 1. A m acroal ga Ulva fl exuos a provou crescer e desenvol ver -se bem em condi ções tí pi cas de aquacultura em t anques de t erra. As experiênci as s obre o ci clo de produção indicaram um perí odo ótimo de culti vo das m acroal gas de cerca de 8 di as. Est e estudo foi conduzi d o a uma es cala s emi -indust ri al m ost rando a vi abilidade económ ica do cultivo desta espéci e de macroal ga. A pres ença da Ul va flexuosa no Sul de Portugal amplia sua di stri bui ção geográfi ca e abre a perspetiva de us ar est a es péci e em sist em as IMTA em divers as part es do país .
Palavras -ch ave:
Identi fi cação de es péci es; DNA -Barcoding; Ulva fl exuos a ; P rodução de biom ass a; Taxa de cresci mento es pecí fi co (S GR); produção prim ária líquida (NPP )
ix
Abstract
Wast e wat er from i ntensive aquaculture can caus e eut rophi cation of coas tal wat ers and subs equent negativel y impact downst ream biol ogi cal communiti es. The us e of m acroal gae as active biofil ter optimiz e s the reducti on of the dissol ved nut ri ent loads in aquac ulture effluent s. Ul va species wit h thei r hi gh growth rat es and t issue nit rogen cont ents are ver y good candi dates for biorem edi ati on besides having an active rol e on carbon sequest ration. This stud y i dentified t he Ulva sp. culti vated i n eart h ponds facing the Ri a Formos a lagoon (Sout h P ort ugal), and asses sed the biomas s production , the SGR (specific growt h rat e) and C O2 uptake performance of th is speci es. Usi ng DNA
barcodi ng wit h t he markers ITS (i nternal transcri bed s pacer) I identi fi ed six speci es of the genus Ulva growing i n t he ponds, wit h Ulva fl exuosa being the culti vated one. Ul va flexuosa was recorded for the fi rst tim e in South Portugal . However, taxonomi c questi ons were raised because dis tinct cl ades were found for t his species us ing publ ished s equences. Moreover, t he ‘l ett uce -leaf’ morphot ype was obs erved for t he fi rst t ime for the m ari ne speci es of Ulva
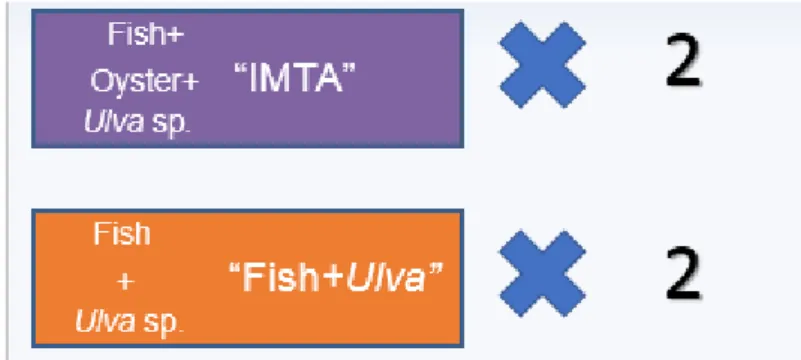
flexuosa. The growt h and production performance were t est ed am ong: a) two
different mul titrophi c s yst ems (IMTA (fi sh +o ys ter + Ulva) and ‘Fish + Ul va ’); b) four di fferent i niti al dens iti es (15 ,30, 50 e 60 g/m2); c) fi ve production and harvest c ycles (6, 7, 8, 9 e 15 d a ys ). The Specific Growt h R at e (S GR) o f Ul va
flexuosa was found t o be s i gni fi cantl y di fferent bet ween t he t wo m ultit rophi c
s yst ems (p <0.05) and hi gher i n t he 'Fish + Ul va ' s ys t em (19.3 ± 0.08% da y- 1) than in the IM TA s ys tem (16.7 ± 0.8% da y- 1). Als o, there was si gnifi cant differences between different densiti es and vari ed cul tivating periods. Growth of Ulva fl exuos a was dependent of both densiti es and ti me period s. The densiti es of 30g/m2 revealed t o be the bes t among t he four test ed densi ties (23 ± 3.9 % da y− 1) whereas the optim al culti vati n g period was between seven and nine days (≈21 % day− 1). The annual NPP of Ul va fl exuosa was est imated to be
of 106 g C m- 2 year- 1 a value lower than thos e report ed from di fferent Ul va
speci es i n other countri es. Ul va f lexuosa showed to grow well under t ypical conditions of earth en pond aquaculture . The experim ent s on the production c ycl e indi cat ed an optimal peri od of cult ivati on of about 8 days . The presence of Ul va fl exuos a in t he Sout h P ort ugal broadens i ts geographi c dist ribution and
x opens the prospect of using t his speci es in IMTA s ys tem s i n various parts of the count r y.
Keywords:
Species identification; DNA-Barcoding; Ulva flexuosa; Biomass production; Specific Growth Rate (SGR); NPP (Net primary production)
xi
INDEX
Agrad eci mentos v
Resu mo vi
Palavras -Chave viii
Abstract ix
Keywords x
Index xi
List of Figu res xiv
List of Tabl es x v Chapter I – In trodu cti on 1
1. Introdu cti on 2
1.1. Background 2
1.1.1. IMT A concept 3
1.1.2. Macroalgae in IMTA 4
1.1.3. Macroalgae producti on in Europe and Portugal 4
1.2. The genus Ul va 7
1.2.1. Taxonomy 7
1.2.2. Life’s cycl e 8
1.2.3. Taxonomic i ssue and Barcodi ng 9
1.2.4. Commer ci al val ue 1 2 1.2.5. Nutri ent upt ake, specifi c growt h rate (SGR) and biomass yield 13
1.2.6. Ulva sp. in eart h pond s 15
xii
Chapter II - Materi als and method s 18
2. Materi als and meth ods 1 9 2.1. Ulva s p. p rodu ction 19
2.2. Morphologi cal and gen eti c speci es iden tificati on 27
2.2.1. Collecti on and storage of seaweeds 27
2.2.2. DNA ext raction 27
2.2.3. DNA ampli fication and sequenci ng 27
2.2.4. Mol ecular anal ys is 28
2.2.5. Phylogeneti c anal yses – alignment 28
2.2.6. Phylogeneti c anal yses – construct ion of phylogenetic tr ee 2 9 2.2.7. Anal ysi s of morphology and anatomy 29
Chapter II I – Resul ts 30
3. Results 31
3.1. Ulva sp. pr odu ction 3 1 3.1.1. Abioti c factor s 31
3.1.2. Ulva s p. growt h and biomass yi el d 3 4 3.1.3. Bes t cul tivating per iods and stock dens ities f or improved growth 36
3.1.4. Dail y growth of Ul va sp. 3 8 3.1.5. Primar y pr oducti on and Carbon upt ake 39
3.2. Morphologi cal and gen eti c speci es iden tificati on 40
3.2.1. Mol ecular anal ys is 40
3.2.2. Phylogeneti c tr ees 4 0 3.2.3. Mor phol ogi cal obs ervati on s 44
Chapter IV – Dis cu ssion and Con clusi on 4 7 4. Dis cussi on 48
4.1. Morphologi cal and gen eti c speci es iden tificati on 48
4.2. Ulva fl exuosa p rodu cti on 52
4.3. Economi c outl ook 57
xiii Chapter V – Ref erences and Annex 59
6. Ref eren ces 6 0 7. Annex A 71
xiv
List of figures
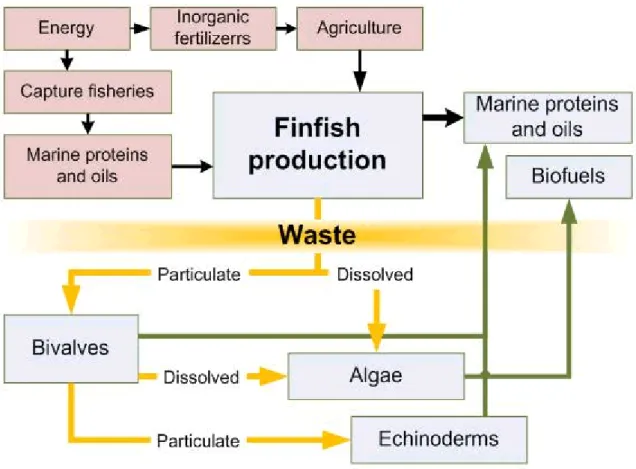
Figure 1.1. Conceptual model of IMTA system (image from http://www.idreem).Yellow arrow indicate
the nutrients cycle, green arrows the products obtain from the extractive species and the black arrows
the cycle of products used to feed finfish. 3
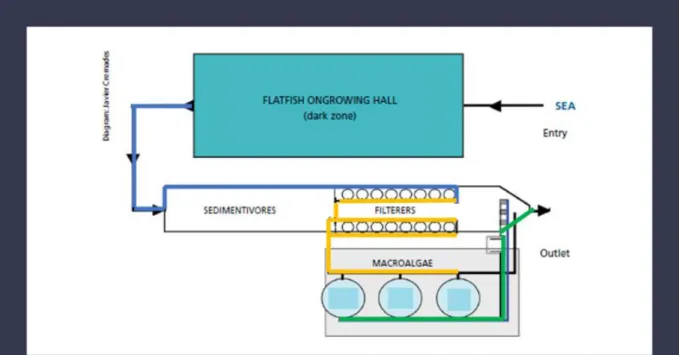
Figure 1.2. IMTA system scheme with species grown separately. The diagram shows the water flow
in a turbot farming plant in O Grove (Pontevedra, Spain) *. The blue line is the wastewater coming from
fish tank. Yellow line is the water after uptake of POM by shellfish. Green line is the water after the
DIN are removed by macroalgae. 5
Figure 1.3. Life cycle of Ulva (image from http://knowledgeclass.blogspot.pt). 9
Figure 2.1. Pattern of assay in EPPO earth ponds. 19
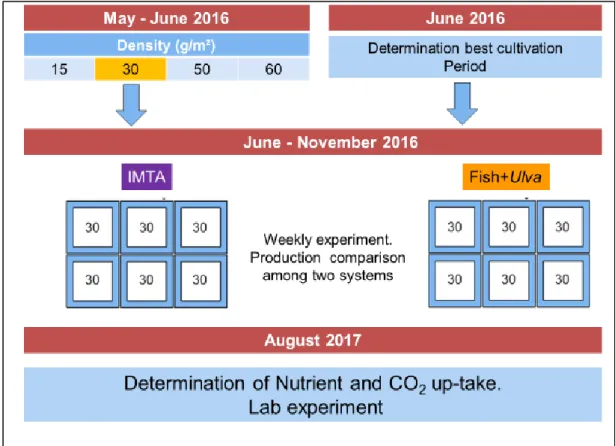
Figure 2.2. Time schedule of experiments ran during the study 20
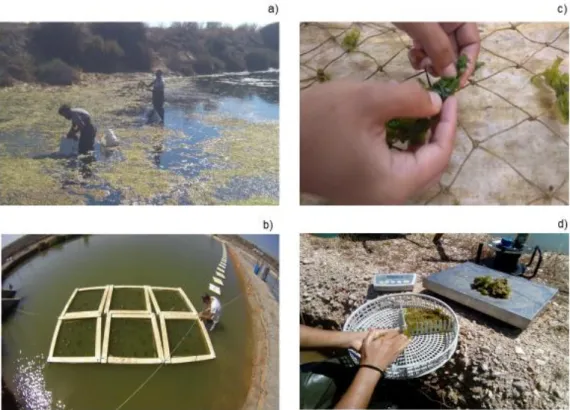
Figure 2.3. a) Collecting Ulva sp. from discharge channel; b) the six floating rafts; c) Ulva being fixed
with brackets; d) macroalgae draining and weighing. 21
Figure 2.5. Eight-days experiment to determine the growth period. Each raft had 30 g/m2 of initial
density. Every number represents after how many days the algae were harvested 23
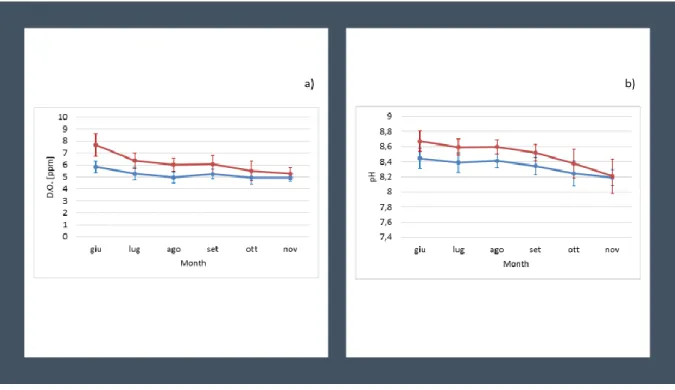
Figure 3.1. Means of daily variation of D.O(a) and pH(b) in the ponds (morning, blue lines; afternoon,
red lines) during the 5 months of the experiment (systems are represented together). Vertical bars
represent standard deviation. 32
Figure 3.2. Correlation between biotic and abiotic parameters in the ponds. Correlations with p-value
> 0.05 were considered as non-significant and leaved blank. Circles represent significant correlations: red - negative correlation, blue - positive correlation. Colour intensity and size of the circles are proportional to the significance of the correlation coefficient. (NH4+, HPO4-2, NO3-, NO2- in µM:
Chlorophyll a in µg/l; D.O.: dissolved oxygen in µM; Temp: temperature in °C; SGR: specific growth rate
in %, Turb: turbidity in FNU). 32
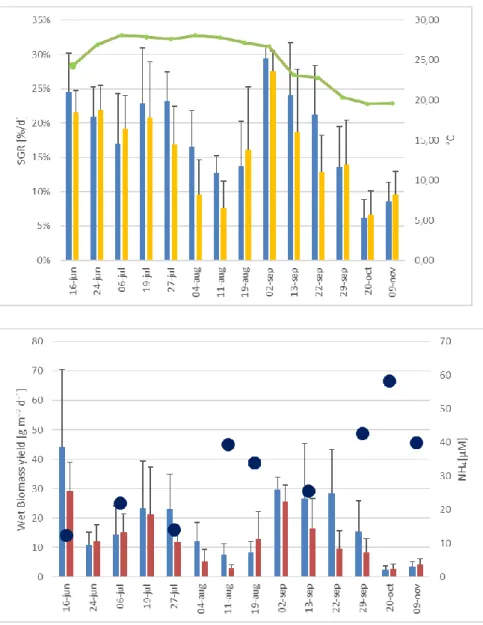
Figure 3.3a. Variation of specific growth rate (SGR) (at right) of Ulva sp. along the experiment. XX axis
refers to day of harvesting. The green line represents the average water temperature during the 7 days of the cultivation periods (at left). Blue bars: Fish + Ulva system; Yellow bars: IMTA system; lines:
standard deviation 35
Figure 3.3b. Variation of Wet biomass production (WBP) (at right) of Ulva sp. along the experiment.
The black dots correspond to the ammonium concentration (at left) in the tanks during the sampling day. Blue bars: Fish + Ulva system; red bars: IMTA system; lines: standard deviation 35
Figure 3.4. Growth curve using SGR recorded from 5 different cultivation periods. 36
Figure 3.5. Growth curve of Ulva sp. SGR grown in eight-days experiment. Blue line represents first 3
days trend. Orange line represents the last 5 days. 38
Figure 3.6. Growth curve of Ulva sp. dry biomass (DW) grown in eight-days experiment. 39
Figure 3.7. Maximum-likelihood (ML) tree of ITS sequences calculated using the evolution model GTR
+ I + G. ML bootstrap values (1,000 replications) are given on the branches. Values with <50% bootstrap support are not labelled. Sequences are labelled with taxon name and GenBank accession number of ITS sequence (Annex A, Table 1). The tree is rooted using Ulvaria obscura A, B, C and D refer to Group containing Ulva collected from EPPO ponds. In red is stressed the Ulva flexuosa identified in this study.
xv
Figure 3.8. Bayesian tree of ITS sequences. Bayesian probabilities (%), BP, are given on the branches.
Posterior probabilities < 50% have been omitted. Sequences are labelled with taxon name and GenBank accession number of ITS sequence (Annex A, Table 1). The tree is rooted using Ulvaria
obscura. A, B, C and D refer to Group containing Ulva collected from EPPO ponds. In red is stressed the
Ulva flexuosa identified in this study. 43
Figure 3.9 a) Lettuce-shape Ulva flexuosa; 3b) polygonal cells with pyrenoids (black rows); 3c)
Gregarious thalli with discoidal base (red circle). Scale bar a) and c) 1cm. Scale bar for b) is 10µm 45
Figure 3.10 a) Ulva flexuosa filamentous morphotype; b) thallus corrugated; c) laminar; d) branch (red
circle); e) hollow stipe. Scale bar a) 1cm; scale bars of b), c), d) and e) are 1mm 46
List of tables
Table 1.1. Production of aquatic plants in Europe*(EUFOMA, 2016) 6
Table 1.2. Ulva species in the West/North West coast of Portugal and South coast/Ria Formosa
lagoon*. 11
Table 2.1. Stock densities of the organisms present in the pond. 19
Table 3.1. Mean ± standard deviation values of abiotic and biotic factors for the two systems (IMTA
and Fish + Ulva), and level of significance (p-value) of the comparison between the two using one-way
ANOVA. 33
Table 3.3. Numeric matrix containing the p-values of the t- tests calculated for each pair of cultivation
period groups. In the output view, the red numbers stressed the periods are significantly different from
each other (p<0.05). 37
Table 3.4. Mean values (8 days) of abiotic parameters during the experiment to determine the daily
growth. 37
Table 3.5. Specific growth rate (SGR) and wet biomass production (WBP) obtained with 3 different
initial densities. 37
Table 3.6. Numeric matrix containing the p-values of the t- tests calculated for each pair of stock
densities groups. In the output view, the red numbers stressed the biomass are significantly different
from each other (p<0.01) 38
Table 3.7. Net Primary production (NPP), temperature and pH (at the end of experiment). pH and
temperature are mean values of the 3 chambers for each treatment. To primary production result has already subtracted the respiration and primary production of control (light chamber without algae).
39
Table 3.8. Nucleotide homology (in percentage) of ITS region sequences of the four species present in
the clade of Ulva flexuosa grown within the ponds. 41
Table 3.9. Nucleotide homology (in percentage) of ITS region sequences between Ulva flexuosa grown
within the ponds and European Ulva flexuosa subspp. 41
Table 3.10. Size of Ulva flexuosa cells with wide leaf thalli. 44
Table 4.1. Comparison of averages of specific growth rate(SGR), dry biomass production (DBP), Wet
biomass production(WBP) cultured in different systems with different stock density (Table adapted
from Neori et al., 2014 and Castelar et al., 2014) 55
Table 4.2 Net primary productivity (NPP) of Ulva spp. from different studies (Table adapted from
xvi
ANNEX A Tabl es
Table 1. Sources of taxa used to create the phylogenetic trees. 71
Table 2. Ulva taxa identified with short morphological description. 73
Table 3. Nucleotide homology (%) of ITS region sequences of the EPPO samples and other Ulva specimens
1
CHAPTER I.
2
1. INTRODUCTION
1.1 Background
Aquaculture is the fastest growing animal food producing sector in the world and is an increasingly important contributor to global food supply and economic growth (FAO 2016a; Stévant et al., 2017). Aquaculture production by the 28 European Union Member States reached 1.28 million tonnes and 3.96 billion Euros in 2014 according to EUFOMA ( EUFOMA, 2016). The greatest contribution to this total comes from finfish farms followed by shellfish (FAO 2016a). Since fish excrete nearly 50 kg N and 7 kg P per ton of finfish produced per year (Troell et al. 2003; Burk et al., 2017) aquaculture industri es generate nutrient-rich wastewater streams which can cause environmental problem, mainly in coastal areas ( Lawton et al., 2013). To find an appropriate solution to reduce the excess of nutrients coming from aquaculture effluents is very important for the development of the sector both economically and ecologically (FAO, 2016a). A solution could be found by combinin g extractive and fed aquaculture, an ecological engineering tool known as IMTA system (Abreu et al., 2011; Buck et al., 2017). IMTA represent a practical solution for mitigating the negative effects of fish farming wastes by utilising excess nutrients as a valuable resource for extractive species (Buck et al., 2017; Stévant et al., 2017). This system can prove vital for aquaculture in Portugal, where the activity is developed mainly in land-based farming systems in an extensive or semi-intensive regime (INE, 2016). IMTA system can facilitate the production in land-based aquaculture often limited by strict environmental regulations around water quality of point -source discharges (Lawton et al., 2013). Moreover, IMTA implementation in Portugal could allow the re-use of abandoned saltpens and overcome the problem of finding new spaces for aquaculture facilities (CIGArRA 31.03.05.FEP--‐0040).
3
1.1.1 IMTA concept
Integrated multi-trophic aquaculture (IMTA), as the name reveals, is based on the integrated cultivation of aquatic organisms that have different complementary trophic levels. The concept is using the waste products from one food production process (e.g. fin -fish) to feed autotrophs (e.g. phytoplankton, macroalgae) and heterotrophs (i.e . shell-fish) that are co-cultivated with the fed organism and convert in a valuable product (Hughes and Black, 2016) (Figure 1.1).The marine extractive species could be subdivided into three main groups: 1) filter feeders (e.g. oyster),2) deposit feeders (e.g. sea urchins) and 3) dissolved nutrient absorbers (e.g. macroalgae) (Buck et al., 2017). All of them are excellent aquaculture candidates because there are no costs for feeds since they uptake nutrients and particulate matter from the surrounding water column (Paul et al., 2013; Buck et al., 2017). Filter feeders and deposit feeders use mainly particulate organic matter (POM) for their nutrition whereas macroalgae use extract dissolved inorganic nutrients (DIN).
Figure 1.1. Conceptual model of IMTA system (image from http://www.idreem).Yellowarrow indicate the nutrients cycle, green arrows the products obtain from the extractive species and the black arrows the cycle of products used to feed finfish.
4 1.1.2 Macroalgae in IMTA
The ability of macroalgae to be used as excellent biofiltrators has long been demonstrated and their use in the treatment of sewage has proved an acceptable environmental approach, alternative and inexpensive (Troell et al., 2003; Pereira and Correia, 2015; Grote, 2016). Algae act as a biofilter increasing the assimilative capacity of the enviro nment for nutrients (Neori et al., 2004) while simultaneously oxygenating the cultivation medium (Robertson -Andersson, 2003). Macroalgae uptake N, P and C, which they use for growth and production of proteins and carbohydrates. When macroalgae are harveste d from IMTA the excess nutrients are also removed from the environment (Burk et al. 2017). Besides reducing the environmental impact of fish aquaculture, macroalgae in IMTA systems add value to the investment in finfish aquaculture by increasing the yield of total biomass produced on a single site (Neori et al. 2004; Stévant et al., 2017). Finally, the macroalgae harvested can be used as low -value commodity energy compounds such as biofuels, biodiesels, biogases and bioalcohols and to produce food, animal f eed, bioactive ingredients, pharmaceuticals and cosmetics (Ben -Ari et al., 2014; Burk et al., 2017).
1.1.3 Macroalgae production in Europe and Portugal
Despite the growing demand for edible algae in the EU markets, its production is growing slowly with res pect to the world's largest producers (EUFOMA, 2016). In 2014 EU macroalgae production amounted to more than 93.000 tonnes, providing approximately 0. 3% of the world supply, which represented a decrease in production compared to 2013 (Table 1.1). Tradition ally both in Europe and in Portugal the macroalgae industry was based mainly on the harvesting of macroalgae (Pereira and Correia, 2015; EUFOMA, 2016). However, this type of technique is subject to annual fluctuations and poor product quality and raised concerns about the conservation of the marine ecosystem (EUFOMA, 2016). During the years , many different techniques to farm macroalgae have been developed each based on differences in seaweed species, purpose of farming, cultivation techniques, marine environments, scale of operations and coasts (Radulovich et al., 2015) (Figure 1.2 ).
5 future market prospects (e.g. biofuel) could lead to the development of macroalgae farming in the country.
Figure 1.2. IMTA system scheme with species grown separately. The diagram shows the water flow in a turbot farming plant in O Grove (Pontevedra, Spain) *. The blue line is the wastewater
coming from fish tank. Yellow line is the water after uptake of POM by shellfish. Green line is the water after the DIN are removed by macroalgae.
6 Table 1.1. Production of aquatic plants in Europe*(EUFOMA, 2016)
C o u n t r y 2 0 0 5 2 0 0 6 2 0 0 7 2 0 0 8 2 0 0 9 2 0 1 0 2 0 11 2 0 1 2 2 0 1 3 2 0 1 4 F r a n c e 2 3 . 0 9 9 1 9 . 1 9 2 3 9 . 7 9 2 3 9 . 8 1 0 1 9 . 0 3 2 2 2 . 7 1 7 4 7 . 6 8 7 4 1 . 5 7 9 6 9 . 4 3 0 5 8 . 8 1 2 I re l a n d 2 9 . 5 0 0 2 9 . 5 0 0 2 9 . 5 0 3 2 9 . 5 0 0 2 9 . 5 0 0 2 9 . 5 0 3 2 9 . 5 0 3 2 9 . 5 0 9 2 9 . 5 4 2 2 9 . 6 0 0 S p a i n 4 4 1 4 8 6 1 3 4 111 6 9 1 2 5 2 6 3 5 2 7 1 . 2 1 8 2 . 1 5 4 I t a l y 1 . 6 0 0 1 . 4 0 0 1 . 4 0 0 1 . 4 0 0 1 . 4 0 0 1 . 4 0 0 1 . 2 0 0 1 . 2 0 0 1 . 2 0 0 1 . 2 0 0 P o r t u g a l 6 2 4 7 6 5 4 9 5 1 9 8 3 5 1 4 9 8 4 6 1 8 0 1 8 3 9 7 8 6 E s t o n i a 8 0 9 3 9 4 1 . 6 0 8 1 . 4 8 3 1 . 0 3 2 3 5 1 6 9 0 4 3 0 2 4 9 6 2 6 G re e c e - - - - - - 1 9 8 1 7 4 9 3 1 2 6 D e n ma r k - - - 1 . 0 0 0 1 . 0 0 1 1 . 0 0 0 1 . 0 0 0 1 . 0 0 0 1 . 8 0 0 1 0 0 E U t o t a l 5 6 . 0 7 3 5 1 . 7 3 7 7 2 . 9 3 2 7 3 . 5 0 1 5 2 . 3 8 5 5 5 . 5 9 4 8 1 . 0 0 2 7 5 . 2 2 0 1 0 4 . 3 7 0 9 3 . 4 0 4 *S o u r c e: FA O Fi s h s t a t ( p r o d u c t i o n = h a r v es t i n g + a q u a c u lt u r e p r o d u c t i o n ) . N o r ep o r t ed p r o d u c t i o n m ea n s t h a t d a t a i s n o t a v a i la b l e.
7
1.2 The genus Ulva
The cosmopolitan distribution of the genus Ulva makes it suitable for cultivation practically everywhere (Ben-ari et al., 2014). Moreover, Ulva species possess several factors that make them ideal candidate s for bioremediation:
• high growth rate and nitrogen concentration in the tissue;
• efficiency in the removal of inorganic nutrients and ability to resist the high exposure of these elements and compounds derived from them; • resistance to epiphytes and disease -causing organisms;
• economical value; (Neori et al., 2004; Matos et al., 2006; Lawton et al., 2013; Pereira and Correia, 2015; Grote, 2016).
1.2.1 Taxonomy
The genus Ulva belongs to the phylum Chlorophyta, fam ily Ulvaceae, class Ulvophyceae and order Ulvales. The species included in this genus are commonly called "green algae" for their distinctive green colour, like that of terrestrial plant leaves (Cormaci et al., 2014). In the past this genus was separated in two distinct genera, Ulva and Enteromorpha, by Heninrich Friedrich Link in 1820 (Hayden et al., 2003). Link maintained the green algae with distromatic thallus in the Ulva genus and moved those with tubular thallus to Enteromorpha (Hayden et al., 2003; Cormaci et al., 2014). Only in the 2003 Hayden et al., have proved their congener using nuclear ribosomal internal transcribed spacer DNA (ITS nrDNA) and the chloroplast -encoded rbcL gene. Generally, the thalli can be fixed by a basal disk reinforced by several robust descending filaments produced by all or nearly all near-base cells, or can be freely floating (Cormaci et al., 2014). The cells present a singular chloroplast with a characteristic cup shape and containing a variable number of pyrenoids (Cormaci et al., 2014). Shape and colour of the thallus, n umber of pyrenoids, shape of cells, type of reproduction, ecology, etc. have been classically used to identify the species of the genus Ulva (Marês et al., 2011; Cormaci et al., 2014). Nevertheless, many authors reported that the morphological characters h ave an
8 insufficient taxonomic value in several Ulva species dues to phenotypic plasticity (Shimada et al. 2003; Hofmann et al. 2010; Comarci, 2014). Studies around the world have shown that only the combination of both molecular and morphological techniques can lead to better characterization of taxa present in different areas of the globe ( Loughnane et al., 2008; Heesch et al., 2009; Marês et al., 2011; Wolf et al. 2012; Lawton et al., 2013).
Nowadays, there are 598 species (and infraspecific) names in the Algaebase of which 128 are currently accepted taxo nomically (Giury and Giury, 2017) . Which makes the Ulva genus one of the most numerous of marine and estuarine genera (Kraft et al., 2010).
1.2.2 Life’s cycle
During their “haplodiplontic” life cycle, species of genus Ulva undergo an alternation of two i somorphic generations: the diploid (2n) sporophyte and haploid (n) gametophyte. The gametophyte generation consists of two individual of the opposite sex called zooids. The fusion of the gametes give rise to the second generation, diploid, that will produce haploid zoospores. Finally, these haploid zoospores germinate into male or female haploid gametophyte (Pereira and Correia, 2015) (Figure 1.3). Ulva spp. are opportunistic and have a reproductive characteristic comparable to r selected species (Castelar et al., 2014). They release a substantial number of small spores (10 μm) with a rapid growth rate, with flagella that allow a rapid dispersion and short life cycle (Castelar et al., 2014). In Ulva gametes are released principally from marginal tissue whereas tissue close the holdfast is purely vegetative (Pereira and Correia, 2015). The vegetative thalli have complex glycoproteins that inhibit sporulation, but these substances decreased when thalli age. The variations of environmental factors such as light, temperature, nutrients, tide ranges, etc. are crucial in regulating algae growth, reproduction and sporulation processes. As regards the Ulva species, high luminous intensity and high temperatures are among the major factors in increasing zoospore production (Han et al., 2002; Hurd, 2015). Another factor is the fragmentation usually used to enhance the sporulation with the intention of cultivation by inoculation method (Han et al., 2002; Pettett, 2009; Castelar et al., 2014).
9 Figure 1.3. Life cycle of Ulva (image from http://knowledgeclass.blogspot.pt).
1.2.3 Taxonomic issue and Barcoding
The continental coast of Portugal represents the southern limit for several macroalgae species and the combined climatic influences of both Atlantic Ocean and Mediterranean Sea lead to the formation of unique macroalgae communities (Araújo et al., 2009). However, over the years, there was a time gap on the phycological study of the Portuguese coast which has led to poor monitoring of the distribution of m acroalgae species (Araújo et al., 2009). The
Ulva genus is no exception.
Nowadays this genus comprises approximately 17 species in Portugal of which
Ulva rigida (C. Agardh, 1823), Ulva clathrata((Roth) C. Agardh 1811), Ulva prolifera (O.F. Müller,1778) and Ulva mutabilis (Föyn, 1958) were recorded in
the Ria Formosa lagoon (Araújo et al., 2009; Aníbal et al. 2014; Martins, 2014; Alsufyani et al. 2016; Grueneberg et al., 2016) and Ulva linearis in the Algarve (South Portugal) (Pereira and Correia, 2015) (Table 1 .2).
Nevertheless, the difficulties in the identification of members of genus Ulva are known and how many species names have been misapplied along years resulting in artificial ranges for several of them is unknown (Robertson-Andersson, 2003). An accurate assessment of marine macroalgae is important for conservation, monitoring, and management of biological introductions and
10 invasions (Melton et al., 2016). However, given the growing demand for algae, a proper taxonomic identification has also become necessary in the field of aquaculture (Prasad et al., 2009; Radulovich et al., 2015). Selecting appropriate target species is the first critical step in implementing an algal production programme (Lawton et al., 2013). A n example comes from South Africa where it has emerged that the critical matter for South African Ulva growers was if the different taxonomic entities had different ecological growth r equirements (Bolton et al., 2009). In terms of ecological impact, knowin g if a species is broad distributed could permit the translocation of these species between aquaculture facilities without impacting on native biodiversity (Lawton et al., 2013). Another issue arising from improper taxonomic identification is the impossibility to compare results, inhibiting the consolidation of the knowledge about production and other characteristics of the cultivated species (Radulovich et al., 2015).
DNA barcoding is a taxonomic method that uses a short genetic marker in an organism's DNA to identify it as belonging to a particular species (Hebert et al., 2003). The main goal is identifying an unknown sample in terms of a pre -existing classification (Kress et al., 2005). The ideal marker should have a highly variable region, useful for spe cies discrimination, flanked by highly conserved region (Saunders and Kucera, 2010). The internal transcribed spacer region of ribosomal cistron (ITS) has been used in several studies concerning the Ulva species identification (Marês et al., 2011; Lin et a l., 2013 Rybak et al., 2014). It is proving useful for the identification at species level due to its multiple highly variable regions (Shimada et al., 2008; Saunders and Kucera, 2010; Gao et al., 2013). Therefore, the ability of recently developed techniq ues to analyse more species, more rapidly and in greater detail serves not only to further highlight variability but will act as a platform to optimise their utilisation (Stengel et al., 2011).
11 Table 1.2. Ulva species in the West/North West coast of Portugal and South coast/Ria Formosa lagoon*. U l v a s p e c i e s N . W / W c o a s t S / R i a F o r mo s a U . b i f r o n s ( Ar d r é , 1 9 6 7 ) + - U . c l a t h r a t a ( ( R o t h) C . A g a r d h 1 8 1 1 ) + + U . c o m p r e s s a ( Li n n e us , 1 7 5 3 ) + - U . c u r v a t a ( ( K üt z i n g) D e T o ni 1 8 8 9 ) + - U . f l e x u o s a ( W ul fe n , 1 8 0 3 ) + - U l v a f l e x u o s a s u b s p . p a r a d o x a ( ( C . A g a r d h) M . J . W yn ne 2 0 0 5 ) + - U . i n t e s t i n a l i s ( L i n ne u s 1 7 5 3 ) + - U . l a c t u c a ( Li n n e u s , 1 7 5 3 ) + - U . l i n e a r i s ( P . J . L . D a n g e a r d , 1 9 5 7 ) - + U . l i n z a ( L i n ne u s , 1 7 5 3 ) + - U . m u t a b i l i s ( F ö yn , 1 9 5 8 ) - + U . p r o l i f e r a ( O . F . M ü l l e r , 1 7 7 8 ) + + U . p s e u d o c u r v a t a ( K o e ma n e t va n d e n H o e k , 1 9 8 1 ) + - U . p s e u d o l i n z a ( ( R . P . T . K o e ma n & H o e k) H a yd e n e t a l . , 2 0 0 3 + - U . r h a c o d e s ( ( H o l me s , P a p e n f u s s 1 9 6 0 ) + - U . r i g i d a ( C . A g a r d h, 1 8 2 3 ) + + U . s c a n d i n a v i c a ( B l i d i n g, 1 9 6 9 ) + - U . s i m p l e x ( ( K . L. V i no gr a d o v a ) H a yd e n e t a l . , 2 0 0 3 ) + -
12 1.2.4 Commercial Value
Macroalgae can be used in a wide range of production processes: production of the hydrocolloids alginate, agar and carrageenan, fe ed for animals or for the production of green chemicals or bioenergy, a re some of the possibilities (van den Burg et al., 2016). In particularly, Ulva naturally contain a protein content between 10% and 26% of dry weight o f the algae. This characteristic has traditionally been used for human and animal nutrition. Ulva pertusa, with a protein level between 20% and 26%, is frequently consumed in Japan. Ulva
reticulata can be cultured for animal production feeds (Se-Kwon Kim, 2014).
Since Growing Ulva in effluent media increases its tissue nitrogen and thus protein content (> 40%), it turned out to be a valuable feed for abalone in South Africa abalone farms (Wiencke and Bischof, 2012). Moreover, a consistent relationship between tissue nitrogen and thallus colour was determined and can be used by mariculture farmers to assess the nutrient quality of Ulva (Robertson-Andersson et al., 2009). In South Africa, the culture of Ulva for abalone feed is more than 1000 t/year (Paul et al., 2013). Usually the weakness of Ulva is its low value as a product more than the cost of cultivation, but its use to produce food for the species by the high commercial value can solve this problem. Valente et al., in a study with the aim of evaluate t he use of three marine Macroalgae, Gracilaria bursa-pastoris, Ulva rigida and Gracilaria
cornea, cultivated in effluents of fish farms, as dietary ingredients in European
sea bass (Dicentrarchus labrax) juveniles, didn’t recorded negative consequences on growth performance, nutrient utilization or body composition (Valente et al., 2006). As already stressed Ulva has already naturally good levels of protein (20% dry weight). As well as vitamins, proteins and other rare trace elements, Ulva contains arginine, an amino acid used by the animal in function of preventing cardiovascular failure (Pereira and Correia, 2015). A study on Ulva lactuca collected in the Tunisian coastline has given a more comprehensive framework about physicochemical, fatty acids and amin o acids composition (Yaich et al., 2011). The protein fraction analysis indicated the presence of essential amino acids, which represent 42.0% of the total amino acids. Fat acids represented 7.9% of dry weight and between them palmitic acid was dominant (Yaich et al., 2011). Palmitic acid has anti-microbial activity (Stengel et al., 2011). The most important thing from a commercial point of
13 view is the high fiber content in in this alga both the insoluble fibre and the soluble dietary fibre (ulvan: sulphated polysaccharide). The problem of high content of heavy metals is solved if Ulva is grown in tanks. (Yaich et al., 2011). The biochemical composition of macroalgae depends strongly on the growth conditions and thereby season (Robertson -Andersson et al., 2009). The ratio of protein and carbohydrates can determine which type of species or cultivation system is adequate to obtain one or more of the products listed above, e.g. carbohydrates could be converted into bioenergy, from anaerobic digestion , into biogas (Bruhn et al., 2011).Ulvan is an acidic, sulphated and water-soluble polysaccharide isolated from the proliferative macroalgae of the genus Ulva. Give its properties it could be used as an immunostimulator in fish aquaculture, heparin-like drug or as an original biomaterial (Alves et al., 2012a). The main feature of this molecule is the high content in rhamnose, glucuronic acid, xylose, and a small amount of the rare sugar iduronic acid (Coste et al., 2015). The main structural subunit ulvanobiuronic acid t ype A (A3S) has a glycosaminoglycan-like structure with anticoagulant, antioxidant, immunomodulatory, antihypercholesterolemic, antihyperlipidemic, antiviral, antitumoral and plant defense elicitor activities. It has been used in forming biomaterials such as nanofibers, nanofibrous membrane, microparticles, molecular sponges for cell culture and antiadhesive activity or as ion exchanger hydrogel (Coste et al., 2015; Popa et al., 2014). Nevertheless, this molecule presents a great variability that depends on various factors as the species, life cycle stage and physico -chemical condition.
1.2.5 Nutrient uptake, specific growth rate (SGR) and biomass yield.
Ulva is one of the simplest macroalgae to cultivate as it grows vegetativel y
(Robertson-Andersson, 2003). For instance, in one day Ulva lactuca can double its area (Wiencke and Bischof, 2012 ) achieving a specific growth rate of 35% (Bruhn et al., 2011). Since early 90’s, studies conducted in Israel with Ulva species has shown that it acts as a bio-filter of waste released by fish in integrated aquaculture stations together with a high growth rate and nutrient uptake capacity. Usually fish assimilate around 20% of N introduced with dry feed, excrete 10% as faeces resulting in 70% of N excreted as dissolved reduced N available to the environment and possibly for macroalgae (Shpigel and Neori,
14 1996; Neori et al. 2000).In Israel, ammonia-N, as a fraction of total feed -N was reduced from 45% in the fish effluents to 10% in the post -seaweed discharge (Neori et al., 2000) and 1 kg wwt (wet-weight) m- 2 of U. lactuca can remove
over 90 % of the ammonium from fish effluents ( Robertson-Andersson, 2003). In the course of several experiments, a specific mean growth rate of 18% and a biomass yield of 25 g m- 2 d- 1 was estimated when Ulva was used as biofilter
for marine fishpond effluents ( Ben-Ari et al., 2014; Robertson-Andersson, 2003; Bolton et al., 2009). In an experimental integrated system for the intensive land-based culture of abalone, seaweed and fish in Israel U. lactuca species grew at a stable rate throughout the year and the nutrients excreted by the fish supported high yields of 78 kg m- 2y- 1 (Coehn and Neori, 1991).
The rapid growth of U. lactuca is attributed to its high photosynthetic rates and high ability to uptake dissolved nitrogen (Ben -Ari et al., 2014). A study about a bloom of green algae Ulva prolifera in the Yellow sea revealed that the wet weight of U. prolifera gradient increased from 11.94% to 25.92% in proportion to contents of dissolved inorganic nitrogen ( DIN supply, which indicated DIN content was essentially decisive for the output of U. prolifera blooms (Zhou et al., 2015). The cultivation of abalone jointly with Ulva in several studies showed a ver y good perform ance in t erms of removal of nutri ents , SGR and biom ass growth (Bolt on et al., 2009; R obertson -Andersson, 2003; M acchi avello e Bulboa, 2014).
Ulva, besides growing faster and utilise waste nutrients , can out-compete with
most species of epiphytic algae. As Ulva is often the main epiphyte in monocultures of other seaweed makes it the preferred biofilter seaweed genus. Furthermore, this seaweed suffers from epi phytes only when they get stressed and do not grow at their usual fast rate (Neori et al., 2004).
There is al wa ys a certain seas onalit y i n growth capacit y and biom ass yi eld of
Ulva as reported b y sci enti fi c lit erature. Seasonalit y is es peci all y import ant i n
the t ank cultivati on of Ulva in t emperate zones as all fact ors , environm ent al and ecologi cal, var y considerabl y. A research, p resented b y Israel et al. ( 1995), is ver y com prehensi ve in t his regard: Ulva lact uca exhibi ted hi gh biom ass
yi el ds correl ating with densit y, photos ynthetic photon flux and t em perature. During wint er when the m ean t emperat ure of seawat er was 12oC, bi omass
15 increased weekl y b y an average of 87% while yi elds in well water at about 18oC averaged 600% per week; bi omass i ncreme nt during s pri ng averaged 215%. A Chilean stud y recorded that t he growth rate and producti vi t y of U. l actuca increasing from fall until summ er and varyi ng from 0.5 ± 0.2% to 2.6 ± 0.2% d
- 1 and 10 ± 6.1% to 73.6 ± 8.4% g m- 2 d - 1 for s ust ainable growth rat e and
productivi t y, res pect ivel y (M acchiave llo and Bul boa, 2014). Neori et al., 1998 report ed a production of Ul va lactuca seasonall y-dependent lower in winter than in the res t of t he year, averagi ng ≈292 g fresh wei ght m− 2 d− 1 in the summ er, and ~83 g fresh wei ght m− 2 d− 1 i n wint er. The optim al densit y for the
cult ure of U. lact uca was det ermined to be 1 kg m− 2 (Ben -Ari et al., 2014) but some authors reported 4 kg m− 2 as optimum (Bruhn et al., 2011).
Microal gae and s eaweed have enormous potential for reducing gl obal warming and clim at e change (Turan and Neori, 2010). Macroal gae lock awa y atmospheric C O2 b y mean of a process cal led ‘blue carbon’ (C hung et al ., 2011;
Amos u et al., 2013). During photos ynt hesi s the y fix CO2 to create their
biom ass, releasi ng ox ygen and producing, under anaerobi c conditions, C H4, a
cl ean biofuel (FAO 2009; Turan and Neori , 20 10). M acroal gae can als o m iti gat e the effect of finfis h uneat en feed that can induces the rel eas e of C O2 int o the
atmosphere (Fang et al ., 2016). Farmi ng macroal gae in combi nati on wit h fis h made IMTA s ys t em a sink of C O2 (Tang et al., 2011). The genus Ul va spp. are
abl e to utili se bot h CO2 and HC O3- as s ource of carbon. Ul va lactuca can be
culti vated using fl ue gas and us es CO2 from gas as C s ource i ncreas ing it S GR
b y up to 21% (Bruhn et al., 2011). It was estimat ed that t he rem oval of 1 million tons of Ulva prolifer a is equival ent t o removing 30000 t ons of C (Hurd et al ., 2015). This removal has provided a servi ce eval uat ed around US$100 milli on (Chopin, 2012). Thus, this miti gati ve s ervi ce could be an i ncenti ve for t he culti vation of Ulva, sometim es considered l ess profi table than other speci es. 1.2.6 Ulva sp. in earth ponds
All the previously IMTA system studies carried out in Portugal used macroalgae native of the Portuguese coast (Abreu et al., 2012). The use of native species is mandatory to avoid the introduction of non -indigenous taxa (Matos et al., 2006; Pereira and Correia, 2015). At IPMA ‘s Aquaculture Research Station in Olhão (EPPO acronym in Portuguese) the choice of cultivating Ulva sp. based
16 itself on the fact that it grows wild into the settling tank. Furthermore, the genus Ulva showed, in previous studies, to withstand the considerable seaso nal temperature fluctuations to which the tanks or ponds are subjected (Robertson-Andersson et al., 2003; Guerrero and Cremades, 2012). Others abiotic factors such as high levels of light irradiance and ammonium concentration, commonly elevated in earth ponds, are relevant in the choice of the algae. Ulva has shown its ability to grow well under high values of these two variables , reaching high biomass production with high protein content (Floreto et al., 1994; De Casabianca and Posada, 1998; Ben-Ari et al., 2014). Also, the environment of the ponds is improved b y t his kind of macroal gae. The C O2 produced b y
het erot rophs is used b y Ul va t hat helps to bal ance fi shpond pH level and ox ygen dem and (Hurd et al ., 2015 ). M oreover, Ulva is able to rel eas e spores dail y incrementing chloroph yll a concent ration. That m eans that in a IM TA s ys t ems contai ning s hellfi sh, as t hat i s carri ed out at EPP O, Ul va s peci es mi ght contri but e to the phyt opl ankton as food for t hese filt er feeders (R obertson -Andersson, 2003). In turn bival ves, acting as bio -filt ers, remove the ph ytopl ankt on that m a y int erfere wit h the growth of al gae and s ome parti cul at e suspended mat ter, competi ng with them for the int ake of N, C and P . The mut ual benefits that the trophic web of IMTA system may bring to the cultivation of the species that make up it, could result in a boost to both seaweeds cultivation and aquaculture sector in Portugal.
17
1.3 OBJECTIVES
The present work focused on the feasibility of integrating a land -based production system of Ulva sp. on a semi-commercial aquaculture farm, with the objectives of:
- Morphological and genetical characterization (barcoding) of the Ulva sp. cultivated and other macroalgae in the ponds.
- Assess Specific Growth Rate (SGR) and Biomass production of Ulva sp. in multitrophic aquaculture. Determine the potential for Nutrients and CO₂ uptake
18
CHAPTER II.
19
2. Materials and Methods
2.1 Ulva sp. production
The multit rophic aquaculture experim ent was conduct ed at the Aquaculture Res earch St ati on in Olhão (EPP O - Estação Pi loto de Pis ci cul tur a de Olhão ). Four rectangular 450 m2 x 1.5 m deep earthen ponds were us ed: 2 with fish, o yst er and m acroal gae (IM TA) and 2 wit hout o ys t ers ( Fis h + Ulva) (Fi gure 2.1). Aut otrophs (ph yt oplankton, Ul va sp. ), filter -feeding species (Crassost rea gi gas ) and fed organi sms ( Ar gyr osomus r egius, Mugil cephalus ,
Diplodus sar gus ) are grown in the sam e eart hen pond. Stock d ensi ties of the
organi sms cultivat ed are showed in table 2.1.
Table 2.1. Stock densities of the organisms present in the pond.
Species Density
Argyrosomus regius 1500 (N°/pond)
Diplodus sargus 900 (N°/pond)
Mugil cephalus 550(N°/pond)
Crassostrea gigas 18000 (N°/pond)
Ulva sp. 30g/m² x 6 rafts
Gr owt h and bi o mass product i on, best cul t i vat i on peri od an d CO 2 upt a ke wer e eval uat ed for t he cult i vat ed m acroal gae belong to the genus Ul va ( Linnaeus, 1753). The ti me scheduled for the several experi ments is shown in Fi g 2.2 : 1) The first experim ent involved the evaluation of t he best stock densi t y for
Ulva 's growth; 2) The best cultivati on tim e to at tai n t he hi ghest growth (best
culti vation P eri od) was determi ned next in a speci fi c experim ent where dai l y Figure 2.1. Pattern of assay in EPPO earth ponds.
20 production of Ul va s p. was foll owed for 8 consecutive da ys (dry bi omass was also m easured); 3 ) After det ermi ning t his densit y, the product ion of Ulva i n the ponds was ass es sed b y compari ng t he mul titrophic s yst em IM TA and Fis h+Ul va; 4) The ex perim ent to assess nutri ent and CO2 upt ake was the l ast
(Augus t 2017) and was performed i n cont roll ed condi tions in a l aborator y.
Figure 2.2. Time schedule of experiments ran during the study
Nat urall y occurri ng Ulva was collect ed i n the main di scharge channel and in the settli ng pond of EPPO (Fi gure 2.3 a). Aft er harves t, the m acroal gae were washed wi th clean s altwater to remove m ost of t he i mpuriti es and epi bionts and hand-squeezed t o eliminat e wat er as much as possi bl e. A port ion of the harvest was wei ght ed and indivi duall y pl ant ed in 6 rafts , each m easuring 1 m2, made of horizontal net s st retched bet ween st yrofoam float ers. The indivi dual pieces of macroal gae were attached t o t he net with brackets (Fi gure 2.3b and 2.3 c).
21
Figure 2.3. a) Collecting Ulva sp. from discharge channel; b) the six floating rafts; c) Ulva being fixed with brackets; d) macroalgae draining and weighing.
The stock dens it y that perm itt ed the hi ghest growth of Ul va was det erm ined in M a y-J une 201 6 i n a t hree -weeks t ri al to eval uate the growth of the macroal gae (Fi gure 2.2) . Specifi c growth rat e (SGR ) and wet biom as s production (WBP ), was t est ed usi ng f o u r st ock densiti es: 60, 50, 3 0 and 15 g/ m2. Each week t he growt h obt ained wit h di fferent stock densities (60, 50 e 15 g/m2) were com pared wit h t he growt h obtained wit h 30g/ m2 that act as a cont rol for comparison . This was done to prevent t he effect of differences in envir onm ent al conditi ons among t he three experimen ts. Ul va was
distribut ed among the six rafts in the wa y shown in Fi gure 2.4 .
22 Since t he 30g/m2 s howed the best results i t was deci ded t o pl ant the floating struct ures wit h this densi t y i n all subs equent experi ments.
To det ermine the cul tivat ion tim e for hi ghest growth the SGR was obt ai ned for 5 di fferent cul tivation peri ods: 6, 7, 8, 9 and 15 da ys in J une 201 6 . This allowed t o draw a growth curve to defi ne the culti vat ion tim e that result ed on bett er growth rate s. To accurat el y det ermine the dail y growth curve another experiment was carr y out on an ei ght -da y experim ent where the macroal gae biom ass was s ampl ed dai l y. The experi ment st arted on J une 2016 . Ei ght floati ng raft s (each of 1m2) were pl aced i n a pond cont ai ning o yst ers and fis hes (Figure 2.5) . The rafts were surrounded b y a cage to avoi d the det achm ent and t he l oss of m acroal ga e. M oreover, the cages permitt ed t o separate each raft from t he others. In the following ei ght days , a raft was chosen at random and the macroal gae removed, washed, hand drained and wei ghed. In thi s experim ent t he wat er t em perature (°C ), pH, turbidit y (FNU) and diss olved ox ygen (ppm and % sat uration) were determined twi ce a da y .
Ulva s p. were collected, was hed and wei ghed as in previ ous experim ents .
30g of m acroal gae was pl aced on each raft and 3 sampl es of 30g, were dri ed up in an oven at 60°C to obt ai n an average st arting dr y wei ght. Obt aini ng t he dr y wei ght allowed to cal cul at e t he per centage (17.7%) of dr y biomas s pres ents i n the wet Ulva biom as s coll ect ed as follow: (DW/ WW) *100. The dr y wei ght (DW) was determi ned b y dr yi ng the al gae at 60°C i n a hoven. Dr y biom ass producti on (DBP) was cal cul at ed b y t he following equati on:
DBP=[ (DWf-DWi)/ (A*t )]
where DWf =final dr y wei ght, DWi=i niti al dr y wei ght , t =da ys of culture and
23 Figure 2.5. Eight-days experiment to determine the growth period. Each raft had 30 g/m2 of initial density. Every number represents after how many days the algae were harvested from that raft.
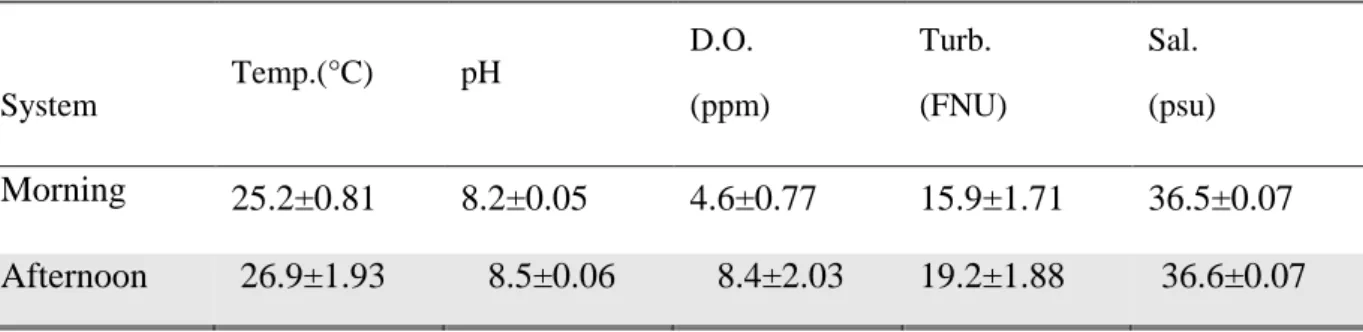
From June to Novem ber 2016 the producti on of IM TA and Fi sh+ Ul va s yst ems was compared. A t ot al of 14 weekl y harvest s were carri ed out . During the experim ent water temperature (°C ), pH, t urbidit y (FNU, Form azi n Nephelom et ri c Units ) and dissol ved ox ygen (ppm and % s at uration) were measured wi th mult i paramet er probes (Hanna Inst rum ents H9829) twi ce a da y. The irradi ance was m easured using an Apogee Mark Model SP -214 p yranom eter. Furt hermore, monthl y, s amples were t aken t o det ermine the concent ration of C hl oroph yl l a and nutri ents (NH4, NO3-, NO2-, HPO4-). The
nutrients were anal ys ed b y colorim e t r y m ethod (Gras shoff et al ., 1983) whereas Chl oroph yl l a was det ermined by s pect rophot om etr y accordi ng to Parsons et al. (1984).
Macroal gae harvesting was done b y hand . The floating s t ructures were gentl y agit at ed t o remove deposit ed sedim ents on the sur face of t he m acroal gae before harvest. P rior to wei ghing Ul va was washed with filt ered s alt water to rem ove debris and epibiont s, squeeze drai ned and t he bi omass in each 1 m2 det ermined indivi duall y i n a scal e wit h a 1 m g accurac y (Figure 2.3d).
The dail y wet biom ass production (W BP ) at each 1 m2 raft composing the floating st ruct ure was cal cul at ed and expressed in g m− 2 da y− 1.
24 Specific growth rat e (SGR , %) of Ul va in the rafts was calcul ated as :
SGR=l n (WWt-WWi)/t
where WWi is the i ni tial wet wei ght and WWt is the wet wei ght aft er t = tim e
(cultivati on da ys ).
To evaluate nut ri ent (NH4+, NO3-, NO2- and HP O4-) uptake, prim ar y
production and CO2 upt ake b y t he cultivat ed Ul va sp. an incubation
experim ent was carri ed out in a cont rolled environm ent . Pri m ar y production was det ermined b y the amount of ox ygen production b y t he m acroal gae duri ng a cert ain tim e. The experiment was run in l ab conditions with const ant air t emperat ure (1 9°C) and li ght i nt ensit y (2 kl ux). Nine trans parent ci rcul ar plexi gl ass cont ainers of 5 L each, were used as incubation chambers. Three treatm ents i n t ri plicat e with the al gae under li ght (L), three wit h t he al gae under no li ght (D) and three wi thout an y al gae and under li ght (C - control). Dark conditi on was creat ed covering t he chambers (D) wi th bl ack thi ck plastic sheets. All t he chambers were fil l ed with filt ered and UV s teriliz ed nat ural s eawat er from EPP O res ervoi r. The C chambers were used to correct for t he effect of an y eventual pl anktonic prim ar y producti on escaping UV steriliz ation. Before introducing the m acroal gae in the chambers wat er samples were coll ect ed to det ermine the i nitial concent ration of nutrients and dissol ved ox ygen. Diss olved ox yge n was fixed, according to the Winkl er method (Grass hoff, 1983) .
Ulva sp. s ampl es were coll ect ed from the main dis charged channel , washed
with filt ered s eawat er and cleaned b y hand to remove visibl e epi ph yt es and organi c debris . 10 grams of al gae were wei ghted, wi th ±1m g accurac y, and placed in 500 ml beakers fill ed with the sea wat er li ke t he experiment al wat er, for acclim a ti zation, one hour before t he t ri al. Before s eal ing t he chambers, t he wat er temperature i n each was m easured wit h a hand di git al thermom et er. At the end of experi ment and i n addit ion to pH , wate r temperature was measured again t o det ermine eventual vari ati ons.
The incubation peri od (1 hour) and the macroal gae bi omass (10 g of wet wei ght ) were chosen to prevent inhibi t ion of photos ynt hes is b y nutrient depleti on and t o simultaneousl y assure that an y nutrients and ox ygen changes
25 were detect abl e ( Lit tler,1979 ; S erpa, 2005). Aft er the incubation peri od, wat er samples for dissolved ox ygen were imm ediat el y s ampled and fixed and, sim ult aneous l y, wat er s ampl es were coll ect ed from t he incubati on bottl es i n order to det ermi ne macroal gal nutrient consumpt i on. Finall y, th e macroal gae were im medi at el y removed and oven dri ed (60°C ) to obt ain the dr y wei ght (DW ).
Diss olved ox ygen concent ration [O2] in the s ampl es were det ermined b y the
Winkler m et hod (Grasshoff, 1983).
The prim ar y producti on or respi ration were det ermined b y the equati on:
P – prim ar y producti vit y (m g C g- 1 DW h- 1); R – respiration (mg C g- 1 DW h- 1); [O2] final – di s solved ox ygen concentration at t he end of the incubati on time (m g l- 1); [O2] initi al - dissolved ox ygen concent rat ion imm edi at el y before the i ncubation (m g l- 1); V – vol ume of t he incubat ion bottl e (l ); F – conversi on factor of ox ygen mass t o carbon mass (0.375); Q – photos ynt heti c quoti ent ; W – m acroal gae wei ght (g DW ); t – incubation tim e (h) (S erpa, 2005; Harri ngt on and Scoggi ns, 2006).
The n et pri mar y producti on (NPP) was obtained b y the equat ion: NPP=P (L) -R-P (C)
Where, P (L) = prim ar y production of li ghted ( L) chambers, R = res pirati on of dark ( D) chambers and P(C )=prim ar y producti on at the control ( C) chambers. The prim ar y producti vit y, expressed as m g O2 g- 1 DW h- 1, were convert ed to m g C , assum ing a phot os yntheti c quotient of 1.2 (Val iel a, 1995). Values of res piration were converted t o carbon equi valent s usi ng a respi rator y quoti ent (RQ) of 1.0 (Tho m as, 1988). This val ue i s usuall y used for Ul va spp . s ince t he y us uall y metaboli ze carboh ydrat es during respi ration (Carval ho and E yre, 2011).
Unfortunat el y the anal ysis of nutrients were not perform ed b y t he end of thi s thesis and therefore nutrient upt ake resul ts are not present ed.