DETERMINANTS OF AGRICULTURAL LAND EXPANSION IN NIGERIA: AN
APPLICATION OF ERROR CORRECTION MODELING (ECM)
A.S. Oyekale
Department of Agricultural Economics, University of Ibadan, Ibadan, NIGERIA. [email protected] +2348029468630 Manuscript received: January 20, 2007; Reviewed: October 10, 2007; Accepted for publication: October 12, 2007
ABSTRACT
This study used an ECM to analyze the determinants of agricultural land expansion in Nigeria. Results show that at first differencing, Augmented Dickey Fuller test indicated stationarity for all the variables (p< 0.05) and there were 7 cointegrating vectors using Johansen test. The dynamic unrestricted short-run parameters of permanent cropland growth rates (68.62), agricultural production index (10.23), livestock population (0.003), human population (-0.145), other land (-0.265) and cereal cropland growth rate (0.621) have significant impact on agricultural land expansion (p< 0.05). The study recommended that appropriate policies to address the problem of expansion of agricultural land and agricultural production must focus on development of cereal and permanent crop hybrids that are high yielding and resistant to environmental stress, human population control and guided use of land for industrial and urban development, among others.
INTRODUCTION
Land is the pivot of man’s absolute existence. Sheng (1989) stressed this by asserting that through the past, in the present, and through the foreseeable future, soil continues to be the foundation of our food supply chain, which is a vital recurrent and capital resource of any nation. However, Vink (1975) observed that in most cases, because of the temporary high economic gains, man may not care about the effect of the use to which land is subjected. The need for putting land to optimum use through adequate and effective planning has never been greatly felt than at present, when rapid population growth and urban expansion are making available agricultural land scarce [1].
Land use is the end to which land is allocated, assuming a conscious decision to use it for a desired end [15, 20]. In the rural areas, land use patterns are governed mainly by the requirements of the agricultural industry, which is important for the livelihood of the people. In Nigeria, given the level of agricultural technology, the capacity of available land had been exceeded by 40-50 million people who mine the soil nutrients to support themselves [8].
Nigerian lands are either productive or non-productive for agricultural purposes. Because of the long fallow period, the traditional agricultural production system was stable and biologically conducive to soil nutrient replenishment [13, 22]. Increasing demographic pressure has now compelled expansion of crop production to marginal lands. Persistent deforestation for agricultural production is now a form of environmental degradation as crop yields drastically decreased [16, 13, 5, 19]. In Nigeria, the scope of the land problem can be well conceptualized from the fact that, despite that the nation depends mainly on oil revenue since the 1970s, land remains the most important long term resource base for the direct and indirect support of plants and animals, which man uses [17].
This paper has the objective of determining the factors explaining agricultural land expansion in Nigeria. This will be done with an error correction mechanism (ECM), an approach that was first used by Sargan (1964) and popularized by Engle and Granger (1987). It is based on the behavioral assumption that two or more time series sometimes exhibit an equilibrium relationship that ultimately determines their short- and long-run behavior [4]. In order to therefore avoid getting spurious results if Ordinary Least Square (OLS) regression is used [6] analysis of time-series data requires appropriate specification of an ECM. The findings are expected to provide direction for Nigerian policy makers in their efforts towards addressing sustainable agricultural production in Nigeria.
Barbier and Burgess (1996) noted that difficulty in obtaining data on forest cover or deforestation rates often leads to the analysis of deforestation indirectly through examining the factors explaining expansion of agriculture or other conversion activities. For example, many of the direct deforestation analysis have pointed to expansion of cropping and possibly livestock production as major factor underlying deforestation.
The use of time series data has encouraged the analysis of the factors determining the rates of agricultural land expansion at the country or cross-country levels. However, most of the available works are cross-country analyses. In Thailand, a study by Phantumvarit and Panayotou (1990) shows the complex linkage between agricultural crop prices, relative returns from different crops and demand for agricultural land. It was found that the most important factors affecting the demand for cropland, and forest conversion, were population growth, non-agricultural returns and agricultural price.
Southgate (1991) also provided a comparative analysis of twenty-four Latin American countries, which showed that there is a strong but indirect relationship between population pressure and forest expansion, and thus forest clearance. The results showed that increased yield growth determine agricultural land expansion. An important addition of the analysis was the inclusion of a land constraint variable, which showed that where there is little appropriate land available for conversion, the growth in arable land, and thereby forest clearance significantly reduced.
Barbier and Burgess (1996) studied the determinants of agricultural land expansion in Mexico using panel longitudinal data for planted agricultural area of 31 states of Mexico plus the Distrito Federal (Federal District) over the 1970, 1980 and 1985 time periods. It was found that relative maize/fertilizer prices and population were statistically significantly affected agricultural land expansion. It was stressed that it is expected that an increase in the relative returns from maize would have an important influence on the total agricultural area planted across Mexico, and therefore possibly on forest clearance. Population was explained to be associated with increased planted agricultural area because increased population could mean absorbing more people into the agricultural sector, thus putting more pressure on the land base, including the forests. Increased population also creates pressure on land indirectly through demand for food, fuel, fodder and other consumptive goods.
Table 1: Descriptive Statistics of Analyzed Variables (1961-2000)
Variable Mean Standard Deviation Coefficient of variation Agricultural land area (‘000 ha) 70,485.25 43,779.66 62.11
Cocoa price (N) 20121.34 37744.37 187.58
Gross Domestic Product (‘N000) 75612.19 25603.95 33.86
Cereal land growth (%) 0.15 16.21 10806.67
Tuber land growth (%) 4.01 9.06 225.93
Permanent cropland growth (%) 0.14 0.29 207.14
Crop production index 76.43 34.79 45.52
Livestock population (‘000) 385927.30 214270.20 55.52
Human Population (‘000) 68781.45 22893.33 33.28
Other land areas (‘000ha) 5666.95 2516.64 44.40
Rainfall (mm) 1287.22 178.90 13.89
Fertilizer (‘000 tons) 152546.30 147853.30 96.92
Tuber yield (kg) 92793.50 10506.54 11.32
Sources: computed from data from FAO database (www.fao.org) and Federal Office of Statistics, Nigeria.
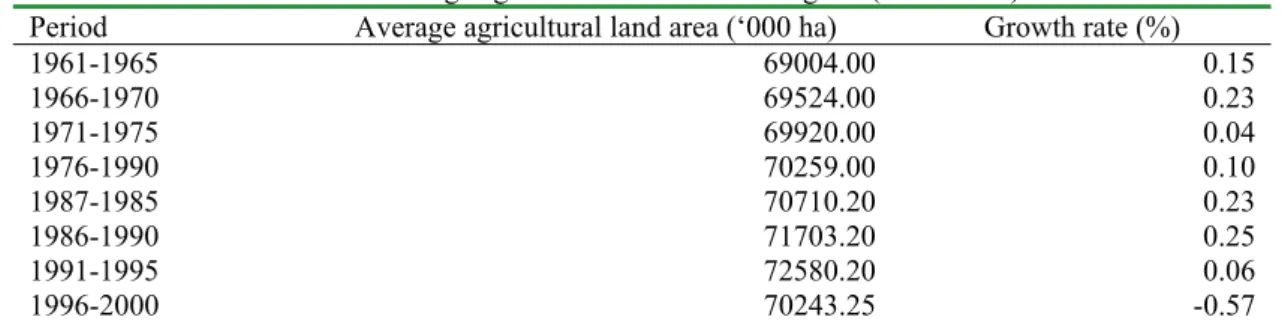
Table 2: Average agricultural land area in Nigeria (1961-2000)
Period Average agricultural land area (‘000 ha) Growth rate (%)
1961-1965 69004.00 0.15
1966-1970 69524.00 0.23
1971-1975 69920.00 0.04
1976-1990 70259.00 0.10
1987-1985 70710.20 0.23
1986-1990 71703.20 0.25
1991-1995 72580.20 0.06
1996-2000 70243.25 -0.57
Sources: Computed from data from FAO and Federal Ministry of Agriculture and Natural Resources, Nigeria.
model to estimate the determinants of agricultural land expansion in the tropical regions of the world. Across all the tropical countries, the structural variables appear to be more important factor explaining the expansion in agricultural land. Specifically, growth in agricultural land area increased with cropland share of total land area and agricultural export share, but declined with cereal yield. In Africa, the cropland share of total land area mainly explains agricultural land expansion. In Asia, increase in cereal production reduces expansion in agricultural land, and the EKC hypothesis could not be rejected.
Furthermore, Barbier (2001) included three institutional variables represented as a corruption index, a property right index, and a political stability
index. The results show that for all tropical countries, the EKC hypothesis was accepted. Also, population growth, the ratio of cropland to total land area, the share of agricultural exports and political instability all have positive and significant impacts on the expansion of agricultural land.
MATERIALS AND METHODS The data
(FOS) Annual Abstract of Statistics, and several issues of the Central Bank of Nigeria’s (CBN) Annual Reports and Statement of Accounts. Since the data used were from secondary sources, their level of accuracy is unknown, except that their values were confirmed in different sources/publications. All these form some of the limitations of the study.
Model Specification
Keele (2004) noted that the linkage between cointegration and ECM stems from the theory proposed by Granger. This theorem proposes that two or more integrated time series that are cointegrated have an error correction component, and the two or more time series that are error correcting are cointegrated [6]. Therefore, these concepts are isomorphic because each of them implies the other. Basically, a group of non-stationary time series data is co-integrated if there is a linear combination of them that is stationary. This implies that the combination does not have a stochastic trend. The linear combination is called the co-integrating equation. Its normal interpretation is long-run equilibrium relationship [9].
The order of time series data can be tested by using Dickey Fuller (DF) test or the Augmented Dickey Fuller (ADF) approach. However, ADF was used in this study because it normally gives a more accurate result. The Augmented Dickey Fuller statistics is expressed as:
1
Where ΔAt is the first difference of variable A in time t, T
is a time trend variable, ΔAt-1 is lagged value of variable
At in year t , are the parameter estimated and is the random error terms. Under the null hypothesis that φ3=1, the conventional computed t statistics is known as tau statistics which will have to be compared with Monte Carlo critical values which are always higher than the t- statistics values at any given level of significance [9]. If the null hypothesis is rejected, this implies that there is stationarity in the data.
Test of cointegration of land use model
Two variables are cointegrated if they are nonstationary at level, but there exists a linear combination between the two variables that is stationary. This is explained as follows:
At = θ1 + φXt + vt 2
vt = At – θ1- φXt 3
If the error term is stationary, then variables At and Xt are
cointegrated, vt is I(0), and the trends in the two variables
cancel out. And they will be of the same wavelength if they are integrated of the same order. Therefore, if a series At is I(1) and another series Xt is integrated of
I(1), they can be cointegrated. It therefore implies that regression on the level form of the variables is spurious, and valuable long-term information will be lost.
Two major methods of testing for cointegration are the Engel Granger [6] and Johansen methods [10, 11, 12]. This study used the latter method with Microfit 4.1 statistical software.
Co-integration model
When the variables are co-integrated, an ECM will be used, and the estimated model can be stated as:
Where:
ξi , are estimated parameters
At = agricultural land area (‘000 hectares) in year t
GCt = growth in cereal cropland area (%) in year t
RPt = cocoa price index in year t
GRt = growth in root and tuber cropland area (%)in year t
YRt = yield per hectare of roots and tuber crops (kg) in year t
GDPt = Agricultural Gross Domestic Product in year t
Xt = quantity of fertilizers (‘000 tons) in year t
GPt = growth rate of permanent cropland (%) in year t
Zt = index of agricultural production in year t
APt = animal population per hectare in year t
HPt = human population per hectare in year t
OLt = other land (‘000 hectares) in year t ARt = annual rainfall (mm) in year t
Rt-1 = lagged residual error measuring long equilibrium
adjustment (agricultural land) in year t yt = random error terms in year t
ζ, is the long run equilibrium parameters which on the a priori should be less than 0 and the absolute value should be less than or equal to one. Two hypotheses were tested. The first states that there is no cointegration among the variables above, while the second states that agricultural land expansion is not positively influenced by human demographic pressures.
RESULTS AND DISCUSSIONS Description of Agricultural Land
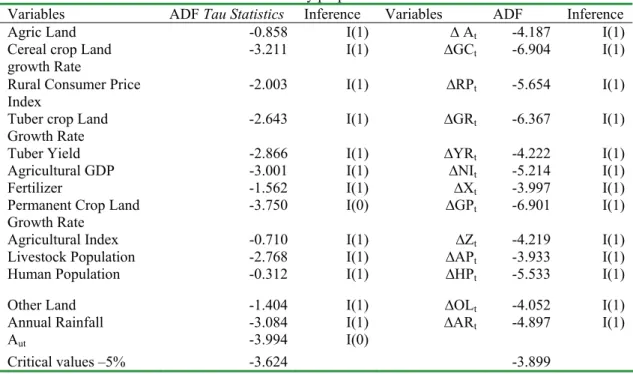
Table 3: Univariate stationarity properties of the variable series
Variables ADF Tau Statistics Inference Variables ADF Inference
Agric Land -0.858 I(1) � At -4.187 I(1)
Cereal crop Land
growth Rate -3.211 I(1) �GCt -6.904 I(1)
Rural Consumer Price
Index -2.003 I(1) �RPt -5.654 I(1)
Tuber crop Land
Growth Rate -2.643 I(1) �GRt -6.367 I(1)
Tuber Yield -2.866 I(1) �YRt -4.222 I(1)
Agricultural GDP -3.001 I(1) �NIt -5.214 I(1)
Fertilizer -1.562 I(1) �Xt -3.997 I(1)
Permanent Crop Land
Growth Rate -3.750 I(0) �GPt -6.901 I(1)
Agricultural Index -0.710 I(1) �Zt -4.219 I(1)
Livestock Population -2.768 I(1) �APt -3.933 I(1)
Human Population -0.312 I(1) �HPt -5.533 I(1)
Other Land -1.404 I(1) �OLt -4.052 I(1)
Annual Rainfall -3.084 I(1) �ARt -4.897 I(1)
Aut -3.994 I(0)
Critical values –5% -3.624 -3.899
Table 4: Johansen multivariate cointegration test for agricultural land areas Trace Test Maximum Eigenvalue Test
Ho Ha Test
agricultural land area is 70,485,250 hectares, its variability index is 62.11 percent. Cereal land growth rates, permanent cropland growth rates and average annual cocoa prices have the highest variability, while tuber yield, average annual rainfall and human population have the lowest coefficient of variation.
Table 2 shows that average agricultural land area increased from 69,004,000 hectares in 1961-1965 to 72,580,200 hectares in 1991-1995, after which it declined to 70,243,250 hectares in the 1996-2000 period (see fig 1). This decline could imply that previously cultivated agricultural lands are now being converted into non-agricultural purposes. Agricultural land area has the lowest average growth rate of –0.57% in 1996-2000. Determinants of agricultural land expansion and deforestation
In order to determine the factors influencing agricultural land expansion in Nigeria, an Error Correction Model (ECM) was used. The first step was to determine whether the series of variables at their present levels were stationary or not. Using the Augmented Dickey Fuller (ADF) methods, a conclusion was reached based on comparison of the absolute values of the computed statistics with the critical table values at the 5 percent level. Conclusion was made basically based on the significance of ADF test because of its superiority over some other methods [9]. The results of the analysis are in table 3.
The table shows that only the tau statistics of growth rates of permanent cropland and agricultural land error term are statistically significant at 5 percent level. Therefore the null hypothesis of non-stationarity has to be rejected, implying that they are stationary at level - I(0). However, for other variables included, the null hypothesis of non-stationarity was accepted because the absolute values of tau statistics are lower than the absolute values of the critical ADF value. Therefore, we proceeded to test whether they are integrated of order 1. Considering the stationarity of the first difference of the variables, the tests show that the series are stationary at 5 percent level. In the next step, it was established whether cointegration exists among the variables or not. The Johansen test for cointegration was used. The results of the analysis are in table 4. This test yields two likelihood ratio test statistics, referred to as the trace test and the maximum Eigenvalue test, which were used to determine the level of cointegration of the data series. The study used both results to conclude on the sensitivity of the results to different tests. In the trace test, the null hypothesis that there are at most r vectors being cointegrated is tested against the general alternative, whereas in the maximum
Eigenvalue test, the null hypothesis of r cointegrating vectors is tested against the alternative of at least (r+1) cointegrating vectors.
For agricultural land expansion results in table 3, the trace test r=0 was taken first, before the others were considered. The tests rejects the null hypothesis of no cointegration at 5 percent level until the null hypothesis of r<=8 where the trace test statistic (42.27) is lower than the critical value (48.88). This implies that at least 8 cointegrating vectors are in the model. Using the Maximal Eigenvalue, the results show that the null hypothesis of r<=7 will have to be rejected since the Eigenvalue statistics (25.56) is lower than critical value at 5 percent (33.64). The conclusion here is that there exist at least 7 cointegrating vectors in the variables. Although the two results have different implications, it can be concluded that there exists between 7 and 8 cointegrating vectors in the model. The existence of more than one cointegrating vector indicates that the system under examination is stationary in more than one direction and, hence, more stable. In sum, the Johansen test results suggest that there could be a long run steady state relationship among agricultural land and the included independent variables.
Table 5 shows the unrestricted error correction model for agricultural land expansion. The result shows that the included variables explained about 60.52 percent of the variations in the mean of agricultural land. However, the computed F statistics is 5.62 and it is statistically significant at 1 percent. This implies that the model produced a good fit for the data. First order autocorrelation is absent from the Durbin Watson statistics of 1.991, and multicollinearity was no problem from the low values of Variance Inflating Factor (VIF) and their high tolerance levels.
Table 5: Unrestricted Error Correction Mechanism for agricultural land expansion in Nigeria Collinearity Statistics
Variable Unstd Coeff T Statistics
Tolerance VIF
Constant 221.250 5.025***
Cereal Crop Land Growth Rate 0.621 3.215*** 0.899 1.112
Rural consumer price index -0.261 -1.492 0.812 1.231
Tuber crop land Growth Rate 0.389 0.901 0.905 1.105
Tuber Yield -0.125 -0.539 0.803 1.245
Agricultural GDP 1.236 0.289 0.738 1.354
Fertilizer -0.145 -0.871 0.847 1.180
Permanent Crop Land Growth Rate 68.622 2.220** 0.824 1.214
Agricultural Index 10.236 3.036*** 0.788 1.269
Livestock Population 0.004 2.940*** 0.621 1.610
Human Population -0.145 -2.561*** 0.734 1.362
Other Land -0.265 -3.054*** 0.589 1.695
Rainfall 0.654 1.492 0.701 1.418
Lagged Error Term -0.235 -1.352 0.781 1.280
DW = 1.991 Adj R2= 0.605 F = 5.620***
Note **Statistically significant at 5 percent *** Statistically significant at 1 percent
Table 6: Restricted Error Correction Mechanism for agricultural land in Nigeria Collinearity Statistics
Variable Unstd Coeffi T Statistics
Tolerance VIF
Constant 122.210 6.035***
Cereal crop Land growth Rate 0.485 3.201*** 0.897 1.115
Fertilizer -0.000 -0.960 0.824 1.214
Perm Cropland Rate 60.123 2.240** 0.739 1.354
Agricultural Index 7.314 3.205*** 0.818 1.223
Livestock Population 0.001 3.066*** 0.867 1.154
Human Population -1.519 -1.905* 0.791 1.264
Other Land -0.062 -3.346*** 0.861 1.162
Rainfall 0.080 1.713* 0.615 1.625
Lagged Error Term -0.426 1.702* 0.891 1.122
DW = 2.025 Adj. R2=61.220 F = 6.021***
Note * Statistically significant at 10 percent **Statistically significant at 5 percent *** Statistically significant at 1 percent
cropland areas contributes the most to agricultural land expansion. This can be explained from the fact that in most cases, land used for cultivating cereal and tuber crops, and even vegetables are those already used over time, while most cash crops especially cocoa requires virgin forest which would be an addition to overall agricultural land areas. The standardized coefficient of the parameter of permanent cropland variable is 0.28, which make it the fourth most important variable. Hypothesis two for agricultural land expansion has to
66000 67000 68000 69000 70000 71000 72000 73000 74000
Year 1963 1966 1969 1972 1975 1978 1981 1984 1987 1990 1993 1996 1999
Year
Figure 1: Agricultural Land Areas in Nigeria (1961-2000)
Agricultral
land
Areas
('000
ha)
Land area
increases, the demand for permanent pasture increases, while increase in human population can make available agricultural land to be converted into urban estate and industrial areas. In many rural areas, scarcity of land does not make agricultural land to respond positively to increase in human population. What happens is that farm fragmentation is promoted as children inherit their parents’ land or even take charge of the farm operations as the farmers grow older.
The parameters of index of agricultural production is 10.236 being statistically significant at 1 percent. The finding goes in line with that of Southgate (1991), and it buttresses the point that a major factor for agricultural land expansion is the need to increase agricultural production as the nation develops. For a nation like Nigeria that is largely agrarian, realization of the potentials for ensuring economic growth and development through promotion of non-oil sector
will result in agricultural growth and expansion in the agricultural land areas.
Other land parameter is –0.265 and it is statistically significant at 1 percent level. This implies that agricultural land areas will decline as land areas devoted to housing and urban development increase. This goes in line with expectation because most of the land normally used for school construction, construction of industries, house building, road construction etc. were previously used for agricultural activities. In some cases, governments have had to compensate families for using their lands for such purposes listed above.
are similar to that estimated for unrestricted model except that the rainfall and lagged error term parameters are both significant at 10 percent. The statistical significance of the error correction term, which measures the speed of adjustment to past shocks in equilibrium, is noted. It implies that the variables in agricultural land model have strong tendency to adjust to their disequilibrium by moving towards the trend values of their counterparts. Also, increasing rainfall will lead to expansion in agricultural land areas. This is expected because rain is a necessary input for agricultural production. Droughts often discourage agricultural production. When there is no rain, no areas expansion could be had.
Policy implications and recommendations
Agricultural production in Nigeria seems to be largely dependent on expansion of land areas harvested. This poses a lot of threat to increased production due to gradual decline in availability of land and extension of crop production to marginal lands. For policy implementation, this study identified some important factors responsible for expansion of agricultural land areas in Nigeria. Increase in the land areas used for other purposes like housing, industrial development etc. will significantly reduce available land for agricultural uses. This implies that as urban development continues, land areas available for agricultural production will decrease. Appropriate policies to protect available land areas in favour of agricultural production must be put in place. This should clearly identify the type of land that could be massively cleared for urban development. Situations where fertile lands are converted for needs which could have been met by some other marginal lands should be avoided.
Also, expansion in cereal and cash crop production will lead to significant increase in expansion of agricultural land. Policies that encourage the production of cash and cereal crops will therefore have lead to agricultural land expansion. There is therefore the need to encourage and strengthen research on cereal crops. Most Nigerian cereal crops thrive well only on fertile land, and development of hybrids that are high yielding and resistant to environmental stress will go a long way in assisting farmers to get high yields from available degraded farm land instead of clearing forests.
Human population growth negatively affects agricultural land areas expansion. Falusi (1997) noted that most of recent growth in agricultural production resulted from increase in land areas. Without adopting a workable population control policy, provision of food to meet the needs of the growing population is therefore threatened.
Increase in rainfall will lead to increase in agricultural land expansion. This puts a lot of challenge
on Nigerian industries and households by making sure that activities that can lead to distortion of weather should be avoided. One of the major concerns in Nigeria now is depletion of the ozone layer. The regulatory bodies implementing the environmental safety program of the nation should be strengthened on the way of monitoring indicators in Nigeria. Companies found to be involved in environmentally hazardous activities should be sanctioned by constitution.
In conclusion, this study provides an econometric analysis of the determinants of agricultural land expansion in Nigeria. The impetus for doing this is to understand the key driving forces for agricultural land expansion and develop some policy thrusts for addressing the phenomenon. Because, agricultural land expansion indirectly analyzes the processes of deforestation, the Nigerian policy makers and concerned stakeholders should develop appropriate framework for ensuring increased agricultural production while protecting the remaining forest stock.
REFERENCES
[1] Akinbola, G.E., Changes in land use patterns, soil characteristics and potentials for agriculture in Ibadan urban area. Unpublished PhD thesis in the University of Ibadan, Ibadan, Nigeria, 2003.
[2] Barbier, E.B., the economics of tropical deforestation and land use: an introduction to the special issue, Land Economics (2001) 77(2): 155-171.
[3] Barbier, E.B. and Burgess, J.C., Economic analysis of deforestation in Mexico, Environment and Development Economics (1996) 1:203 – 39.
[4] Boef, S.D., Modeling equlibrium relationships: error correction models with strong autoregressive data, Political Analysis (2000) 9(1):78-94.
[5] Ehui, S. K. and Hertel, T. W., Testing the impact of deforestation on aggregate agricultural productivity, Agricultural Ecosystem Environment, (1992) 38: 205 - 18.
[6] Engle, R.F. and Granger, C.W.J, Cointegration and error correction: representation, estimation and testing, Econometrica (1987) 44: 215-276.
[7] Falusi, A.O., Agricultural development and food production in nigeria: problem and prospects, In: Shaib, B. N.O.Adedipe, A. Aliyu, and M.M. Jir (eds.), Integrated agricultural production in Nigeria: strategies and mechanisms for food security, Monograph No.5. Abuja: National Agricultural Research Project, 1997.
agriculture, electronic file found at
www.fao.org/
waicent/faoinfo/agricult /agl/swlwpur/
nigeria/e_ bright.htm
, 2000.[9]. Gujarati, D.N., Basic Econometrics McGraw-Hill International Editions. 838 pp 1995
[10] Johansen S., A statistical analysis of cointegration vectors. Journal of Economic Dynamics and Control (1988)12 (2/3): 231-254.
[11] Johansen S. and Juselius, K., Maximum likelihood estimation and inference on cointegration with application to the demand for money Oxford Bulletin of Economic Statistics (1990) 52:169-210.
[12] Johansen S. and Juselius, K., testing structural hypotheses in a multivariate cointegration analysis of the PPP and UIP for the UK. Journal of Econometrics (1992) 53:211-244
[13] Kang, B. T. ; Van der Kruijs,A.C. B. M. and Couper, D.C., Alley cropping for food production in the sub-humid tropics”, In : Kang, B. T. and Reynolds, L. (eds.), Alley farming in the tropical and subhumid tropics. Proc. International Workshop, 10 -14 March IITA, Ibadan, Nigeria, IDRC, Ottawa, Ontario, Canada, 1989 pp 25-34.
[14] Keele, L. Not just for cointegration: error correection models with stationary data. Unpublished paper, 2004.
[15] Marion C. Land use and demand for land in United States”. In: modern policy Papers of the land Economics Institutes University of Illinois, University of Illinois Press Urbana, 1960.
[16] Matlon, P. J. and Spencer, D. S. C., Increasing Food Production in Sub-Saharan Africa: Environmental Problem and Inadequate Technological Solutions. American Journal of Agricultural Economics (1984) 66: 671 - 676.
[17] NEST (Nigeria Environmental Study Action /Team).Nigeria’s threatened environment: a national profile. Published in Nigeria by NEST, 1991.
[18] Phantumvanit, O. and Panayotou, T., National resource for a sustainable future: spreading the benefits”. Prepared for the 1990 TORI End-Year Conference on Land training, Thailand and its Impact on the Environment, Chon Buri, Thainland, 8 – 9 December, 1990
[19] Pinstrup-Andensen, P., Pandya-Lorch, R. and, Rosegrant, M.W., Global food security: a review of the challenges, In: Pinstrup-Andensen, P. and Pandya-Lorch, R. (eds.), The Unfinished Agenda. Washington, D.C.: International Food policy Research Institute (IFPRI), 2001, pp 56-72.
[20] Reardon, M.J., The role of tenure security and private time preference in neotropical deforestation. Land Economics (1998) 74 (May): 162-170.
[21] Sargan, J.D., Wages and prices in the United Kingdom: a study in econometric methodology. Originally published in 1964 and reproduced in K.F. Wallis and D.F. Hendy (eds), Quantitative Economics and Econometric Analysis. Basil Blackwell, Oxford, 1984. pp 56-76.
[22] Scherr, S.J., Soil degradation: a treat to developing country food security by 2020, 2020 Brief 58: A 2020 Vision for Food Agriculture and the Environment. Washington D.C.: International Food Policy Research Institute (IFPRI), 1999.
[23] Sheng, T.C. Soil conservation for small farmers in he humid tropics. FAO Soil Bulletin Volume 60. FAO: Rome, 1989.
[24]. Southgate, D., Sierra, R. and Brown, L., The causes of tropical deforestation in Ecuador: a statistical analysis” World Development (1989) 19(9): 1145 – 151.