FUNDAÇÃO GETULIO VARGAS
ESCOLA BRASILEIRA DE ADMINISTRAÇÃO PÚBLICA E DE EMPRESAS MESTRADO EM ADMINISTRAÇÃO
Obesogenic Environments in Private Schools in Brazil: A
Longitudinal Study of the Association Between
Availability and Purchases of Foods and Beverages
Bernardo Andretti de Mello
Rio de Janeiro - 2019
DISSERTAÇÃO APRESENTADA À ESCOLA BRASILEIRA DE ADMINISTRAÇÃO
Dados Internacionais de Catalogação na Publicação (CIP) Ficha catalográfica elaborada pelo Sistema de Bibliotecas/FGV
Mello, Bernardo Andretti de
Obesogenic environments in private schools in Brazil : a longitudinal study of the association between availability and purchases of foods and beverages / Bernardo Andretti de Mello. – 2019.
51 f.
Dissertação (mestrado) - Escola Brasileira de Administração Pública e de Empresas, Centro de Formação Acadêmica e Pesquisa.
Orientador: Rafael Guilherme Burstein Goldszmidt. Inclui bibliografia.
1. Merenda escolar – Aspectos da saúde - Brasil. 2. Escolas – Serviço de Alimentação – Aspectos da saúde – Brasil. 3. Obesidade nas crianças – Brasil. 4. Obesidade na adolescência – Brasil. 4. Alimentos naturais – Brasil. I. Goldszmidt, Rafael Guilherme Burstein. II. Escola Brasileira de Administração Pública e de Empresas. Centro de Formação Acadêmica e Pesquisa. III. Título.
CDD – 371.716
1
Resumo
O objetivo deste estudo é descrever o ambiente de alimentação escolar de escolas particulares no Brasil e avaliar como a disponibilidade de alimentos e bebidas nas cantinas escolares está associada à ingestão alimentar de crianças e adolescentes. Em um banco de dados longitudinal de fevereiro de 2016 a novembro de 2018, incluindo 171 escolas particulares brasileiras e 7.442.908 compras de 57.361 estudantes, documentamos os ambientes obesogênicos das escolas e fornecemos evidências adicionais de que os padrões de qualidade nutricional de alimentos e bebidas disponíveis nas cantinas escolares podem influenciar hábitos alimentares saudáveis de crianças e adolescentes. As mensurações mensais no nível escolar compreendem a proporção de produtos oferecidos por valor nutricional - baixo, moderado ou alto - como variáveis independentes, e a proporção, gasto (em R $) e número de produtos adquiridos como variáveis dependentes. Uma extensa análise descritiva revelou que as escolas particulares no Brasil são ambientes obesogênicos que oferecem, em média, mais de 58% dos produtos de baixo valor nutricional. Infelizmente, essa situação não parece se reverter ao longo do tempo. Além disso, os modelos de efeitos fixos revelaram uma relação positiva entre disponibilidade e compra de produtos saudáveis. Melhorias na disponibilidade de cardápios mais saudáveis parecem não impactar nem a receita total de lanchonetes escolares nem o número médio comprado por aluno, abrindo caminho para uma melhor disponibilidade de lanchonetes escolares e, esperançosamente, para hábitos alimentares mais saudáveis para crianças e adolescentes no país.
Keywords: disponibilidade de alimentos, ambiente de alimentação escolar, obesidade, alimentação saudável, ingestão de alimentos, alimentos concorrentes.
2
Abstract
The purpose of this study is to describe the school food environment of private schools in Brazil and to evaluate how the availability of foods and beverages at school cafeterias is associated with children and adolescents’ dietary intake. In a longitudinal database from February 2016 to November 2018 including 171 Brazilian private schools, and 7,442,908 purchases from 57,361 students, we document the obesogenic environments of schools and provide additional evidence that nutritional quality standards for foods and beverages available at school cafeterias may influence children and adolescents’ healthy eating habits. Monthly measurements at the school level comprised the proportion of products offered by nutritional value - low, moderate or high - as independent variables, and the proportion, expenditure (in R$) and number of products purchased as dependent variables. Extensive descriptive analysis revealed that private schools in Brazil are obesogenic environments that offer, on average, more than 58% of the products of low nutritional value. Unfortunately, such a situation does not seem to reverse across time. Furthermore, fixed effects models revealed a positive relationship between availability and purchases of healthy products. Improvements to a healthier menu availability seemed to impact neither total revenues of school cafeterias nor the average number purchased per student, paving the way for better school cafeterias’ availability, and, hopefully, to healthier eating habits for children and adolescents in the country.
Keywords: availability of foods, school food environments, obesity, healthy eating, food intake, competitive foods.
3
Contents
1. Introduction ... 4
2. Literature Review... 5
2.1. Obesogenic Environments and Obesity among Children and Adolescents ... 5
2.2. Availability of Foods and Beverages and the School Food Environment ... 8
3. Methods... 11
3.1. Context and Dataset ... 11
3.2. Sample ... 13
3.3. Measures... 13
3.3.1. Dependent Variables: Students’ Purchase Information ... 14
3.3.2. Independent Variable: School Cafeterias’ Availability ... 14
3.4. Statistical Analysis ... 15
4. Descriptive Analysis of the School Food Environments ... 16
4.1. Current Availability of Products in the School Cafeterias ... 16
4.2. Time Trends for School Cafeterias’ Availability ... 17
4.2.1. Inclusion of Products ... 17
4.2.2. Exclusion of Products... 21
4.3. Current Students’ Purchases... 23
4.4. Time Trends for Students’ Purchases... 24
5. Availability of Products at School Food Environments and Children and Adolescents Eating Behavior ... 28
5.1. Association between Availability and Proportion of Products Purchased ... 29
5.2. Association between Availability and Expenditure ... 31
5.3. Association between Availability and Number of Products Purchased ... 32
6. Discussion ... 34
7. Conclusion ... 37
8. References ... 38
9. Appendix ... 43
A1. Menu definitions... 43
A2. Results for Alternative Menu Definition ... 46
4
1. Introduction
The interaction between food environments and human dietary preferences sheds light on the power of the obesity epidemic (Roberto et al., 2015). Despite individual efforts - such as diets and physical activities -, and collective actions - such as educational nutrition policies-, overweight and obesity are still rising in most countries, notably in developing ones (Corvalán et al., 2017; Lobstein et al., 2015). All around the world, people are living in unhealthy food settings, also called obesogenic environments. Such environments foster hedonic behaviors and seem to influence the extent to which individuals develop their eating habits. As a consequence, individuals, even knowing what they “ought” to eat, eventually end up making unhealthy choices (Olstad, Goonewardene, McCargar, & Raine, 2016).
Unfortunately, obesogenic environments are also a considerable concern for children and adolescents, who are failing to meet the requirements for an adequate diet (Corvalán et al., 2017), and whose average weight gains are rising at alarming rates (Lobstein et al., 2015). Specifically, schools are adequate social environments in which children and adolescents learn about healthy eating preferences (Hawkes et al., 2015), and frequently eat up to two meals and snacks daily (Story, Kaphingst, Robinson-O’Brien, & Glanz, 2007). Therefore, school food environments are ideal settings for an attempt to both revert the obesity epidemic and promote healthy eating habits. This study documents the obesogenic environments in private schools in Brazil, a middle-developed country that has undergone substantive changes of eating habits in the past forty years, with the substantial increase in sales of ultra-processed foods and soft drinks (Lobstein et al., 2015). A rich descriptive analysis from our sample of 171 private schools in Brazil draws attention to a yet scarcely documented environment in the literature. We observe a predominance of low-nutrient products in the current food environment of the schools as we examine quality standards for competitive foods and beverages (CFB)1. Because most of private schools in Brazil are not full-time, students’ consumption in cafeterias happen during morning and afternoon recess and the vast majority is competitive foods and beverages.
1 “Competitive foods and beverages” (CFB) is the term given in the US for foods and drinks sold outside the regular
school meals program, as they compete with regulated school meals. They comprise vending machines, a la carte offerings, and snack bars. In the present study we categorize our products as “competitive foods and beverages”, as they are sold in school cafeterias under no specific governmental guidelines.
5
We observe that more than half of the products available in school menus are of low nutritional value. Unfortunately, over time, such picture remains, and low nutritional value products usually correspond to approximately sixty percent of all products introduced in the menu of school cafeterias in the last years.
In addition to documenting the obesogenic school environment, this study correlates changes in the school food environments and children and adolescents’ eating behavior, in a longitudinal panel of 171 schools from 2016 to 2018. We find significant evidence that the availability of healthy products positively correlates with their purchases. Interestingly, such changes to healthier menu compositions do not seem to influence school cafeterias’ revenues nor the average number purchased by students. Therefore, we advocate that school cafeterias’ availability may improve and become healthier without apparent financial losses.
In sum, the contributions of this study are threefold. First, we describe the obesogenic environments in private schools in Brazil. Second, we corroborate with the findings in the literature indicating that an increase in the availability of healthy products correlates with the corresponding increase in the purchases of such products. Third, we find that such changes in availability to healthier menus may come without the expense of both school cafeteria’s finances and the average number purchased by the students. Consequently, we suggest that school cafeteria menus can become healthier without negatively affecting cafeteria’s commercial interests.
2. Literature Review
2.1. Obesogenic Environments and Obesity among Children and Adolescents
Obesity is one of the main concerns for children and adolescents’ development, as the average weight of children is still raising at alarming rates (Lobstein et al., 2015). Improving children and adolescent’s eating habits is one of the most urgent public health priorities for health organizations around the world, and has been highlighted as a top priority at The World Health Organization’s Global Strategy on Diet, Physical Activity, and Health (World Health Organization, 2004). Children are failing to meet the daily servings of healthy foods, and globalized eating habits are frequent on energy-dense and micro-nutrient poor products (Corvalán et al., 2017).
6
In Latin America, more than twenty percent of children up to five years old are overweight or obese, after years of rapid socioeconomic change, urbanization, and the proliferation of food retail in the region (Corvalán et al., 2017). In Brazil, obesity more than tripled among such cohort over the past forty years (Wang & Lobstein, 2006). Moreover, snacks, sugar-sweetened beverages, and frozen ready-to-eat foods represented approximately twenty-five percent of total calorie intake for children in the country ( Monteiro, Moubarac, Cannon, Ng, & Popkin, 2013). Recently, a study with adolescents and adults in Brazil correlated consumption of ultra-processed foods and obesity and found that such foods represented 30% of total energy intake of the sample (Louzada et al., 2015). Additionally, Louzada and coauthors found a positive correlation between consumption of ultra-processed foods and the probability of individuals with higher BMI and obesity rates.
Despite being described as a top priority by the World Health Organization (2004), child obesity is still on the rise around the globe. Internationally, the best countries could achieve, so far, was to stabilize children’s levels of BMI - body-mass index (Roberto et al., 2015). Most developed countries are failing to propose an agenda to reverse the obesity epidemic (Roberto et al., 2015), a challenge that is even harder for middle-income and under-developed countries that present severe socioeconomic and health disparities in urban areas (Caballero, 2005). Importantly, in 2014, countries from the American continent signed a plan of action to the prevention of obesity among children and adolescents (Organização Pan-Americana da Saúde, 2014). In this 6-year plan (from 2014 to 2019), food at schools was targeted as a top priority of change. However, little has improved ever since. Altogether, there is an urge to propose an agenda to combat the obesity epidemic effectively. Moreover, this is not only an issue for the current health of children and adolescents but also the future of individuals, as child obesity may also have long-term effects.
Childhood is a crucial period to shape individuals’ eating habits throughout life (Dewey, Lo, & Cohen, 2002). Unhealthy eating habits established early in childhood can have effects over future obesity and heart diseases. In contrast, healthy habits can lead to a smaller probability of disease risk and better life quality (Micha et al., 2018). Additionally, obesity among children is a complex issue because we cannot hold children accountable for their high-calorie eating behavior, as they are vulnerable and more influenced by environments, advertising, and peers (DeCosta, Møller, Frøst, & Olsen, 2017). The responsibility lies with parents, schools, and policymakers,
7
which are fundamental actors to improve children and adolescents’ dietary intake (Story et al., 2007).
Obesity is a multi-faceted and complex phenomenon that reaches most countries and keeps spreading in recent years (Swinburn et al., 2011). Both macroenvironments - such as the media and the food sector -, and microenvironments - such as home and school food environments - help determine the obesity rates in a given population. As such, it becomes clear that environments external to individuals affect their eating behaviors. Ultimately, such environments may become ‘obesogenic’, that is, environments that are conducive to unhealthy behaviors. In other words, an obesogenic environment is defined as ‘the sum of influences that the surroundings, opportunities or conditions of life have on promoting obesity in individuals or populations’ (Swinburn & Egger, 2002).
The interaction between human food preferences and obesogenic environments creates a vicious cycle in which unhealthy foods supply shapes the way individuals’ eating habits develop, and the low-energy consumption leads to environmental changes that stimulate further consumption of such foods (Roberto et al., 2015). This vicious cycle creates public health issues all around the world, affecting people of all ages, both from developed (Lobstein et al., 2015), and middle and under-developed countries including Brazil (Monteiro, Moura, Conde, & Popkin, 2004; Popkin, Adair, & Ng, 2012).
Among the diverse types of food environments to which children and adolescents are exposed, it is well documented that schools can play an important role, as they are environments in which they eat at least one meal a day (Azeredo et al., 2016; Story et al., 2007). Consequently, schools are valuable settings for interventions that attempt to shape children and adolescent healthy eating habits. The school food environment availability, which is defined as “all food and drink made available to students and provided or supported by the school through policy interventions or other mechanisms” (Driessen, Cameron, Thornton, Lai, & Barnett, 2014), is a suitable context to analyze and test how to adequately foster healthy eating habits, as they might be an essential social environment to enable the learning of healthy preferences (Hawkes et al., 2015).
8
2.2. Availability of Foods and Beverages and the School Food Environment
School food environments are complex, diverse, and can considerably vary across countries. While some countries have national regulations for school lunch programs - such as the UK, the US, and Japan -, others have local or no regulation at all, which is the case of Canada (Driessen et al., 2014). In Brazil, there have been some attempts to regulate school food environments, which are often shaped by private cafeterias2, however with little adherence. Although there is a Brazilian National School Food Program (BSFP), it only comprises public schools, which can also have school cafeterias selling competitive foods and beverages in the same way of those in private schools. However, some state-level guidelines – such as the 2019 decree from the State of Minas Gerais -, aim at regulating unhealthy food availability and sales. In this sense, there seems to be considerable heterogeneity on school food policies and practices in the country – especially across States -, which provides an opportunity to assess how can school food environments foster nutritional habits in the youth.
The literature on the availability and accessibility of products at schools suggest that one of the main determinants of children’s dietary intake is the degree to which these foods are available and accessible to children (Davis Hearn et al., 1998; Rasmussen et al., 2006). Some conceptualizations also include dimensions of affordability, accommodation, and acceptability as important determinants of healthy eating (Caspi, Sorensen, Subramanian, & Kawachi, 2012). Our study mainly focuses on the concept of availability. In this sense, there is evidence to believe that the larger the proportion of healthy items made available by school cafeterias in the school food environment, the larger is the proportion of healthy items children and adolescents are expected to eat (Driessen et al., 2014; Grady et al., 2018). Interventions attempt to increase the availability and the accessibility of healthy products aimed at preventing children and adolescents from obesity and weight gain. Ultimately, such interventions try to improve the life quality of children and adolescents and to provide a healthier and more sustainable life in the long-term (Driessen et al., 2014).
2 In Brazil, there is a clear distinction between private and public schools and, therefore, between school cafeterias
9
Policies aiming at improving school food environments through increases in availability and accessibility of healthy products are diverse and usually target (i) the provision of fruits and vegetables (F&V) for free or at a low cost to children, (ii) the quality standards for school meals, or (iii) the quality standards for competitive foods (Micha et al., 2018).
Policies that target the provision of F&V (i) can either offer sliced fruits during school breaks or a complementary menu of F&V during lunch. They can occur via a direct provision in classrooms, or via an increase in their availability at cafeterias and vending machines. Establishing quality standards for school meals (ii) includes interventions that usually target lunch meals by limiting dietary fats and sodium (Micha et al., 2018). Improving quality standards for competitive foods and beverages (iii), on the other hand, can involve limited access to unhealthy snacks, specific product restrictions, reduction of portion sizes, or an increase in healthy products.
One of the leading indicators of healthy eating is the amount of F&V children and adolescents ingest daily as they can impact on future healthy eating habits (Blanchette, 2005; Reynolds, Hinton, Shewchuk, & Hickey, 1999), and ultimately prevent children from unhealthy weight gain (Driessen et al., 2014). Some projects, like Schoolgruiten in Germany (Tak, Te Velde, & Brug, 2009), increased healthy availability of products by providing F&V free of charge for children twice a week and found a positive effect of the intervention for fruit intake (but not for vegetables) after two years of the intervention. In a review of studies from the US and Europe, DeCosta and coauthors (2017) found that interventions that changed the availability of foods via F&V provision found significant results mainly for fruits, but not always for vegetables (E. Bere, Veierød, Bjelland, & Klepp, 2006; DeCosta et al., 2017; Reinaerts, Crutzen, Candel, De Vries, & De Nooijer, 2008; Tak et al., 2009). Additionally, longitudinal studies suggest that children’s current food accessibility and preference are key predictors of future F&V consumption (Elling Bere & Klepp, 2005) and that the provision of free F&V items can impact long-term healthy consumption (Tak et al., 2009). Therefore, an increase in the availability of F&V at the school cafeterias might impact on lifelong healthier habits of children and adolescents.
Establishing quality standards for school meals (usually through school lunch programs) also appears to be a promising trend for fostering healthy eating habits in children and adolescents. Studies included in a systematic review and meta-analysis from US/Canada and Europe demonstrate that interventions in school menus have the potential to increase fruit intake and to
10
reduce both total and saturated fats, but not total calorie intake (Micha et al., 2018). Other studies show that interventions on small practical changes at the menus (Karen Weber Cullen, Watson, Zakeri, & Ralston, 2006; Madden et al., 2013), portion-size controls (Hartstein et al., 2008), and the removal of low-nutrient products (Karen Weber Cullen et al., 2006) may help stimulate both children’s and adolescents’ eating behavior (Briefel, Crepinsek, Cabili, Wilson, & Gleason, 2009) and to reduce their body mass index (BMI) (An & Sturm, 2012).
Furthermore, and more relevant to this study, experimental studies about the determinants of healthy products intake by children and adolescents suggest that establishing quality standards for competitive foods (and for non-regulated foods sold in school cafeterias) might influence and shape their healthy eating behaviors (Driessen et al., 2014; Reinaerts et al., 2008). Implementing public food policies that target their availability can also be useful. Empirical studies found that, overall, these policies may (i) reduce students’ energy density (Mendoza, Watson, & Cullen, 2010), (ii) improve healthy products consumption after the law/intervention compared to before (Nicholas, Wood, Harper, & Nelson, 2013), and (iii) increase healthy products consumption by removing/prohibiting products of low nutritional value (Karen Weber Cullen, Watson, & Fithian, 2009; Karen Weber Cullen, Watson, & Zakeri, 2008). Nonetheless, results are inconclusive on whether restricting competitive foods reduces obesity because the reduction on dietary quantity intake was found non-significant (Jensen, Sato, McMurtry, Hart, & Jelalian, 2012; Sanchez-Vaznaugh, Sánchez, Baek, & Crawford, 2010).
Increasing the proportion of healthy foods at school cafeteria menus seems to be associated with a consequent increase in the proportion of healthier consumption. There are multiple ways to accomplish a healthier menu availability. Several interventions targeted this issue, and (i) limited availability of unhealthy products, such as high-fat/sugar foods, by removing them (Karen W. Cullen et al., 2007; Karen Weber Cullen et al., 2006; Daniel R Taber et al., 2011), (ii) reduced portion-sizes and fat contents of foods (Hartstein et al., 2008; Mendoza et al., 2010), (iii) limited availability of unhealthy beverages in vending machines (Jensen et al., 2012), (iv) prohibited sale of sugary beverages (Sanchez-Vaznaugh et al., 2010), and (v) introduced overall national food standards (A.M. & T., 2009; Spence et al., 2013). A systematic review of the impact of such interventions found that seventeen out of the eighteen papers from the UK and the US reviewed
11
reported a positive association between healthier menu availability and both BMI and sales of healthy items outcomes (Driessen et al., 2014).
Recently, a cross-sectional study in Australia directly tested whether healthier menu compositions increased healthier consumption and results suggest that there is a significant and positive association between school cafeteria’s availability and consumption of both healthy and unhealthy products (Grady et al., 2018). Also, a cross-section nationally representative study in Brazil assessed the same association, and found that cafeterias that offered soft drinks or deep-fried salty snacks were associated with higher consumption of unhealthy items, while cafeterias that made fruit and natural juice fruit available were associated with lower children and adolescents consumption of both salty snacks and soft drinks (Azeredo et al., 2016). Nonetheless, in such studies, the authors acknowledge that causal inference may be compromised due to their research designs and datasets, and though they find positive and significant results, it still lacks a more direct and precise measurement of consumption, such as purchase outcomes (Driessen et al., 2014). Consequently, much remains to be done on whether changes in school food environments can impact children and adolescents purchase and consumption behavior, especially in developing countries (Azeredo et al., 2016). Our study contributes to the literature by filling the gap of longitudinal studies that control for time-invariant confounders, and a dataset that allows to collect unobtrusive information of purchases, as a proxy for consumption. Furthermore, this study describes food environments at private schools in Brazil, adding evidence that is almost inexistent in the literature.
3. Methods
3.1. Context and Dataset
In 2014, a Brazilian startup designed a novel service to school cafeterias which included totems and pre-paid debit cards. The system operates so that parents can charge the card in an online platform, and children and adolescents can use the card on the school’s totem to make daily purchases. The purchase procedure is easy for the students, who choose the products from totems inside the school facilities and bring the receipt to the school cafeterias’ attendants. This method
12
of payment allows for daily observation of purchases at school by each student who possesses the card.
The process design by the company has implications on the reduction of cash transactions, and on the individual-level monitoring of eating habits by parents and school nutritionists. Furthermore, the online service provides parents a nutritional analysis of the school cafeteria menu and allows them to restrict the purchase of specific foods to their children. All students from partner schools are eligible to create the magnetic card, but it is not mandatory to do so. Therefore, we include in our analyses only students whose parents decided to contract and charge the card.
The company catalogs menu items in each school cafeteria and specialized nutritionists classify products into healthy (high and moderate nutritional value) and unhealthy (low nutritional value) based on the Nutrition Rich Foods (NRF9.3) Index. This index identifies nine nutrients to encourage3 and three nutrients to limit4 in products and gives a score to assess the nutrient density of individual foods (Drewnowski, 2010). Nutritionists also classifies products into categories, such as sweets and candies, beverages, salty snacks, and sandwiches. In the Appendix A3 we present nutritional values for each product (or group of products).
We had access (i) to a database with daily purchases of every child and adolescent enrolled in the debit-card in every school, and (ii) to another database containing the menus for each school cafeteria across time, with products’ dates of inclusion and exclusion, based on which we calculated the availability of products by school by month.
The final database included purchases and availability information from February 2016 to November 2018. We excluded the months of January, July, and December from the final analysis due to summer and winter vacations. We decided to exclude December because it is the period for the final comprehensive exams for those students who failed to obtain grades required to succeed. In this sense, we decided to remove observation of this month from the sample, as the subset of students using the cafeteria in December could be different in unobservable characteristics from the rest of the sample. For the same reason, we excluded weekend purchases. Moreover, we
3 Protein, fiber, vitamin A, vitamin C, vitamin E, calcium, iron, magnesium, and potassium. 4 Saturated fat, added sugar, and sodium.
13
removed observations from 2015 because, in this period, there were inconsistencies in the registration of information in schools' menus5.
3.2. Sample
In a partnership with the startup company, we had access to a sample of 204 private schools in Brazil that had implemented the system of pre-paid card between 2016 and 2018. Throughout this period, we had unobtrusive access to both purchases and menu compositions in each of these schools. We removed 33 schools because they had less than six months of operation at the moment of the extraction of the data (in December 2018). Hence, we had a final panel of 171 schools and twenty-four months from February 2016 to November 2018. Schools were mainly from the states of São Paulo (87), Rio de Janeiro (44), Minas Gerais (20), and the Federal District of Brasilia (7). Few other schools were from Bahia, Espírito Santo, Pará, Paraná, Santa Catarina, and Rio Grande do Sul.
3.3. Measures
We aggregated the measures of purchases and availability at the school-level as the main unit of analysis. Our objective was to assess main effects of the relationship between availability and purchases, and the month-level aggregation allowed to reduce error that individual data would produce. Nonetheless, this is a contribution to the literature that yet lacks robust and longitudinal datasets. We calculated both children and adolescents’ purchases and school cafeterias’ availability as the average for each school for each calendar month. Thus, we had 171 schools, and up to twenty-four months of operation panel to analyze longitudinal evolution in the availability of products.
The measures included in this analysis were aggregated by high, high and moderate, and low nutritional values, which were calculated by NRF9.36 cited in the ‘Context and Dataset’ section. Measurements also included aggregation of products into two categories: foods (which
5 At the beginning of the operation of many schools, the system managers at the school did not register the
exclusion of products. In the second half of 2015, details about this procedure were clarified to the school cafeteria managers as well as to all schools that started to use the system from that date onwards.
6 In cases in which nutritional values were missing, we first replaced by the mean score of the product in other
14
corresponded to both sweets and candies, and salty snacks) and beverages. It is crucial to highlight that school cafeterias in Brazil usually offer snacks for morning and afternoon recess breaks (Ferreira, Goldszmidt, & Andrade, 2019). Moreover, the company did not classify lunch and dinner products into nutritional value categories. Hence, we focus our analysis on purchases of snacks between classes and exclude both lunch and dinner purchases, which corresponded to 7.85% of the total products purchased in the original database. Therefore, we calculated measurements in three aggregations: (i) overall, (ii) by nutritional value, and (iii) by both nutritional value and category. Moreover, we obtained dependent and independent variables as follows:
3.3.1. Dependent Variables: Students’ Purchase Information
We obtained three dependent variables. All averaged at the school-month level of aggregation. First, we calculated the proportion of all products purchased by each student per month per school and then averaged this value to obtain the Proportion of Products Purchased dependent variable, with equal weights for each student, per month per school. This variable allowed for the assessment of the proportion of foods and beverages (and total) by nutritional value (high, high and moderate, and low) that children and adolescents purchased along the period of operation of cafeterias. Additionally, we measured two other dependent variables: the Expenditure by students per day of operation for each school and month7, and the Number of Products Purchased by children and adolescents per day of operation for each school and month. Therefore, we had a direct assessment of expenditure, a measure yet somehow scant in the literature (Driessen et al., 2014).
3.3.2. Independent Variable: School Cafeterias’ Availability
We calculated our independent variable of Availability of Products at the school-month level aggregation as the proportion of products available. In other words, this variable allowed for the assessment of the availability of each school by month in terms of the average proportion of
7 Importantly, this variable was operationalized with a limit of the 99% percentile for outliers. In other words, we
15
products by nutritional values (high, high and moderate, and low) and categories (total, foods, and beverages).
In order to build the availability measurements at the school-month level, we used the menu composition information given by the school cafeterias. In other words, we considered a given product as available in the period between its inclusion and exclusion from the system. In other words, a product is considered to be available at a given month if it has been introduced at the school cafeteria menu at that given month or before, and remains available until it is removed from the system by cafeteria managers. However, as cafeteria managers may eventually forget to register in the system the exclusion of products from the menu (see Appendix A1 for a detailed discussion), we use an alternative menu definition in Appendix A2 and obtain similar results, corroborating the robustness of our findings.
3.4. Statistical Analysis
We used a linear fixed-effects model to estimate the association between the availability of products and purchases. This type of model excludes all variance between schools and focuses only on changes in the dependent variable over time. Thus, all confounding variables that do not change over time (e.g., location or socio-economic level of the school students) and that could affect the availability of products and purchase patterns are controlled for. This model includes a series of dummy variables (fixed effects) for each school. The basic unit of observation for this model was the school-month. We clustered standard errors at the school level to take into account the dependency of the repeated measures within schools across time. Formally:
𝑌𝑖𝑗 = 𝛽0+ 𝛽1𝐴𝑣𝑎𝑖𝑙𝑎𝑏𝑖𝑙𝑖𝑡𝑦𝑛𝑢𝑡𝑖𝑗 + 𝛼𝑀𝑜𝑛𝑡ℎ𝑗+ 𝛾𝑆𝑐ℎ𝑜𝑜𝑙𝑖 + 𝜆𝑀𝑎𝑡𝑢𝑟𝑖𝑡𝑦𝑖𝑗+ 𝜇 (1)
In which 𝑌𝑖𝑗 represents three different dependent variables as proxies for consumption for each school in each month: (i) Proportion of Products Purchased per nutritional value, (ii) Expenditure (R$) per nutritional value, and (iii) Number of Products Purchased per nutritional value. 𝐴𝑣𝑎𝑖𝑙𝑎𝑏𝑖𝑙𝑖𝑡𝑦𝑛𝑢𝑡𝑖𝑗 is the main independent variable of interest and consists of the availability of healthy products at the school in a given month, measured by the proportion of products of high and proportion of high and medium nutritional value products made available by the school cafeteria. The coefficient of interest 𝛽1 measures how the availability in proportion of products of
16
high and high and moderate nutritional values correlates with each dependent variable; 𝛼 represents the fixed-effects for each calendar-month; 𝛾 represents the fixed-effects for schools; and 𝜆 is the control variable of time in months since the beginning of the use system in the school. Importantly, we excluded low nutritional values when reporting results because of the perfect collinearity between high and moderate and low coefficients for dependent variables of Expenditure and Number of products8. For the dependent variable of Proportion, we did not report such coefficients because we were mainly interested in whether healthier menus would be associated with healthier purchases and coefficients of low nutritional value availability are somehow redundant.
This empirical strategy allows us to eliminate variance within schools, as we control for all time-invariant unobservable inherent unit characteristics. Besides, we control seasonality and time trends by including month fixed-effects, avoiding concerns towards heterogeneity in availability and purchases depending on the month of the year (e.g., in colder weather it is more frequent the consumption of high-calorie products).
4. Descriptive Analysis of the School Food Environments
The final database comprised 7,442,908 products purchased from 57,361 students with age ranging from six to seventeen years. We analyzed a total of 171 schools in the period between 2016 and 2018. On average, there were 136 active students (who purchased at least one product in a given month) per month per school. Each student’s purchases were observed on average during 242.5 weekdays (and the median 187 days), which is more than one school year. The average value of each purchase was R$3.84 (~US$1.00). While 66,7% of students bought at least one healthy product, 97,6% of them bought at least one unhealthy product in the period of analysis.
4.1. Current Availability of Products in the School Cafeterias
8 This collinearity happens because our independent variable is calculated as a proportion that sums to one.
Therefore, the proportion of high and moderate nutritional value products minus one is the proportion of low nutritional value ones, and the coefficient for low nutritional value products is the same of high and moderate ones, multiplied by -1 for the dependent variables of Expenditure and Number of products.
17
This section provides a snapshot of the current availability at school cafeterias that remain in our sample in November 2018. They offered (Table 1), on average, 137.29 products (Table 3), of which 97.06 (70.7%) were foods (salty snacks, sweets, and candies), and 37.90 (29.3%) were beverages. Moreover, an average of 73.69 low nutritional value products was made available, which corresponds to approximately 53.7% of all products. This proportion is even more substantial among the food category, in which 60.0% of the products were low in nutritional value. Interestingly, eight schools did not sell any high nutritional value product in their last month of operation.
4.2. Time Trends for School Cafeterias’ Availability
4.2.1. Inclusion of Products
In this section, we are interested in describing time trends of inclusion of products in the school cafeterias. We describe whether, across semesters, there is a change in the proportion of products made available by the school cafeterias. In other words, we aim at assessing whether school cafeteria’s availability is somehow improving across time and if there seems to be any trend
18
towards a healthier menu due to either the inclusion of high nutritional value products or due to the removal of low nutritional products.
First, we describe patterns of products inclusion. Table 2 displays proportion and number of products added across semesters for school cafeterias and does not include the first month of operation of each school cafeteria, but rather focus only on variations in menu compositions across time. As we can observe, in the second semester of 2017, 68.65% of school cafeterias included at least one product on their menus, the highest percentage from the sample. Overall, we observe that a larger percentage of school cafeterias include products of low nutritional value. Also, inclusions are more frequent for foods than for beverages. Moreover, the highest rate of inclusion of high nutritional value foods is 35.25% (in the first semester of 2017), while the highest rate of inclusion of low nutritional value foods is almost 70% in the first semester of 2016. These findings indicate that changes in the composition of menus of the school’s cafeterias are common and new products are often introduced.
19
The quality of the new products introduced in the menus is particularly relevant. Figure 1 indicates that the trend in the inclusion of products followed similar patterns and remained relatively stable, with more frequent unhealthy products inclusions (around 60%). Most products added are foods (more than 65%), and most of the foods added are low on nutritional value (around 60%). For beverages, high and moderate nutritional value products alternate with low products as the primary inclusions over time. Interestingly, we observe that the first semesters of each year are more frequent on the inclusion of products that the last semesters.
20
Figure 1: Number and Proportion of Introduction of Products Across Semesters.
Panel A. Number of Products Introduced Panel B. Proportion of Products Introduced
Panel C. Number of Foods Introduced Panel D. Proportion of Foods Introduced
21
4.2.2. Exclusion of Products
The exclusion of products is less frequent than their inclusion (Table 3). The ratio of school cafeterias that removed at least one product is 59.04% on the first semester of 2016, and varies across time, being less than 30% in the second semester of 2016 and throughout all 2018. Interestingly, the least often excluded products in all semesters are high nutritional value foods, and low nutritional value foods are the most excluded ones. Also, the removal of foods is more frequent than of beverages on school cafeterias.
We observe that school cafeterias display a broader set of products and that low nutritional value products keep being the ones most included, though they are the products most excluded as well. Consequently, school cafeteria menus from our sample remain relatively stable in their nutritional profile and do not become any healthier across time.
22
Figure 2: Number and Proportion of Removal of Products Across Semesters.
Panel A. Number of Products Removed Panel B. Proportion of Products Removed
Panel C. Number of Foods Removed Panel D. Proportion of Foods Removed
23
4.3. Current Students’ Purchases
According to previous literature, the obesogenic environments above described can influence and determine to some extent children and adolescents unhealthy consumption, in a feedback loop between availability and consumption for unhealthy foods (Roberto et al., 2015). Table 4 displays descriptive statistics for the purchasing behavior of students and adolescents in November 2018, the last month of operation we observed. Overall, proportions of purchases were abundant on low nutritional products, with an average of 68% of products low in nutritional value. Each purchase per student per day of operation averaged R$2.65, being R$1.95 of food products. Similarly, a larger number of foods was purchased: an average of 0.48 per day per student, compared to 0.18 of beverages.
24
As we can observe, in November 2018, the last month of our database, low nutritional value products corresponded to approximately 53.7% of the availability of products. The respective purchases for such products were on average 65%, an even larger proportion. Therefore, we observe that the proportion of purchases of low nutritional value products was even higher than the proportional availability of such products.
4.4. Time Trends for Students’ Purchases
In this section, we display time trends for the purchases of products based on our three dependent variables: (i) the proportion of products purchased per nutritional value, (ii) the average expenditure per student per day, and (iii) the average number of products purchased per student per day. In Table 5, we display the products most often purchased throughout the period.
25
From Figure 3, we observe that the patterns of purchases remained stable across semesters. Overall, low nutritional value products correspond to approximately 60% of the total purchases of students in all semesters. This percentage seems to be consistent across semesters. Purchases of high nutritional value products always remain at levels close to 10%, mainly driven by the purchases of food items. When considering beverages, more than 20% of its purchases across is high on nutritional value. Overall, it seems that across time food purchases becomes more frequent on low nutritional value products, while the composition of purchases of beverages seems to be almost the same since 2016.
26
Figure 3: Proportion of Purchases of Products Across Semesters.
Panel A. Proportion of Products Purchased
Panel B. Proportion of Foods Purchased
27
Moreover, we display patterns of expenditure and the number of products purchased across semesters of operation in Figure 4. Average expenditure per student per day is around R$2.00 and R$2.50 in the period, while the average number of products purchased per student per day remains between 0.6 to 0.7 products overall, between 0.4 and 0.5 for foods, and consistent at 0.2 for beverages. This average is smaller than one as students do not use the cafeteria every day. Overall, both expenditure and quantities purchased remained similar throughout the whole period of analysis.
Figure 4: Expenditure and Number of Products Purchased Across Semesters of Operation. Panel A. Expenditure
28
5. Availability of Products at School Food Environments and Children and Adolescents Eating Behavior
According to the literature on the availability of products, there is a positive correlation between the proportion of products made available, and children and adolescents eating behavior (Driessen et al., 2014). This association seems to be consistent with our analysis. As an example, one school of the sample is examined in Figure 5, which displays on the red line the behavior of the availability of high nutritional value products in one of the schools from our sample. At the beginning of the school’s operations, approximately five percent of the products available were high on nutritional value. Interestingly, in the same period, the purchases of such products, given by the blue line, was almost mirrored by the availability level. As 2017 started, there was a shift in the menu composition, with the increase to almost thirty percent of healthy products. Again, children and adolescents’ purchase behavior accompanied the availability and increased to fifteen percent of purchases of healthy products. After the peak, both availability and purchases stabilized at levels of twenty-five and five percent, respectively.
Figure 5: Proportions of Availability and Purchases of High Nutritional Value Products in a School
29
In order to evaluate if the association exemplified above occurs across schools, we present the results of fixed effects models that evaluate the overall pattern of association between school product availability and students’ purchases. The main results displayed in the subsequent sections use the first menu definition, according to section 3.3.2. We display alternative menu definition results in Appendix A2. Results are consistent among such menu definitions. We do not report coefficients for the proportion of low nutritional value products, as explained in section 3.4. 5.1. Association between Availability and Proportion of Products Purchased
This section presents the results of the association between the availability of products and their respective proportion purchased by students. It is important to notice that, although the average proportion of high nutritional value products made available by cafeterias was about 13%, these products represented around 9% of total purchases. As such, this may imply that, in order to foster healthy eating habits, school cafeterias should display a much higher proportion of healthy foods than the proportion of desirable healthy consumption. For low nutritional value products, on the other hand, the opposite happens. On average, while low nutritional products represent 59% of cafeterias menus, the purchase of these products accounts for 65% of the total. Furthermore, there is a strong linear association between availability and purchase (correlation of 0.63 for high and of 0.77 for high and moderate nutritional value products), as depicted in Figure 6, that visually presents the association of availability and purchases for high and high and moderate products.
30
Figure 6: Correlation Between Proportions of Availability and Purchases for High and High and Moderate
Nutritional Value Products
Panel A: High Panel B: High and Moderate
These associations, though, may be plagued by endogeneity problems. For example, schools that have parents more engaged in children’s eating habits may be pushed to improve the menus, and parental engagement may affect children decisions in the cafeteria as well. The fixed effects models mitigate this issue as the estimates focus only on changes across time, and we control for all time-invariant sources of endogeneity. Table 6 displays the results of the fixed-effects models. It includes school and month fixed fixed-effects and the control variable of the maturity of the school in the system (in months).
Results (Table 6) show that the larger the proportion of high or high and moderate products made available at school cafeterias, the larger is the respective proportion of products children and adolescents purchase. Consequently, larger proportions of low nutritional value products tend to increase purchases for such products. All coefficients are positive and significant at the 5% level, and the coefficient of high nutritional value foods is significant at 10%. Therefore, we argue that increases in the proportion of availability tend to be positively associated with its respective purchases. If the availability of high nutritional value products increases in 1%, purchases increase in 0.28%, while for high and moderate nutritional values, an increase in 1% of availability results in 0.37% increase in purchases for such products. High nutritional value coefficients are significantly larger for beverages (0.60%, compared to 0.12% for foods), while high and moderate nutritional value coefficients are larger but not significant for foods (0.44% compared to 0.28% of
31
beverages). All coefficients show an inelastic relationship between availability and purchase, meaning that in order to obtain a given increase in purchases for healthy products, it is necessary to increase almost four times (on average) the availability of such products.
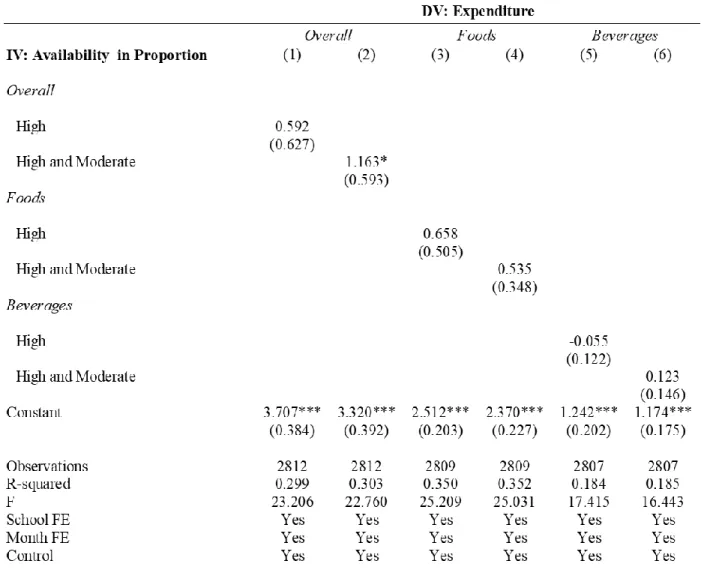
5.2. Association between Availability and Expenditure
As presented in Table 7, the availability of products by nutritional value and category did not seem to be associated with the daily overall average value of purchases. In other words, we found no significant evidence that a healthier menu composition correlated with decreases in school cafeteria’s revenues. Consequently, we claim that in face of changes in improvements in
32
the nutritional prospect of the school menu, students seem to substitute lower nutritional value product for healthier options rather than reduce overall purchases.
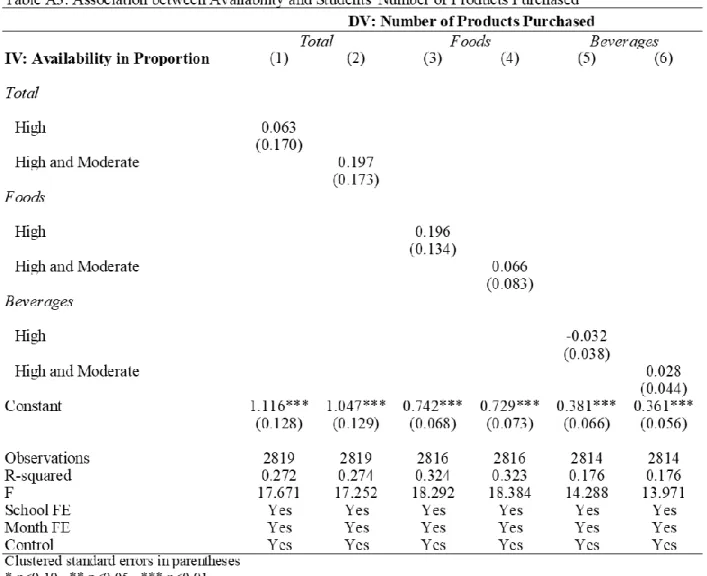
5.3. Association between Availability and Number of Products Purchased
As presented in Table 8, the availability of foods by nutritional value and category did not correlate with the average number of products purchased by students. Results are consistent with the above finding (section 5.2) that there seems to be no harm for school revenues to increase the
33
availability of healthy products. We observe that there is no relationship between the availability of products and the number of products bought by students at school cafeterias.
34
6. Discussion
The purpose of this study was to (i) describe the obesogenic environments in private schools in Brazil, and to (ii) assess how changes in the availability of different foods and beverages in the school food environments would correlate with children and adolescents’ purchase behavior in three different dependent variables: proportion of products, expenditure, and number of products purchased.
A descriptive analysis of the school cafeteria menus in our sample showed that private schools in Brazil are obesogenic environments in which more than 50% of the available products are low in nutritional value. Not only were school cafeterias characterized by a nutrient-poor availability, but this trend also remained consistent across time: the introduction of low nutritional values products was more frequent on average than high and moderate products, and the ratio of healthy products did not improve. Similarly, purchases of such products remained at all semesters frequent on low nutritional value products. Comparing to government schools in Australia (Grady et al., 2018), which made available, on average, 4.7% of low nutritional value products, we can observe that schools in our sample displayed a much larger proportion of low nutritional value products. Consequently, we claim that these environments are obesogenic and that they may foster children and adolescents’ unhealthy eating habits.
Moreover, a study documented the food environment in schools in New Zealand and found that the ratio of unhealthy foods offered, compared to healthy ones, were 5.6:1 (Carter & Swinburn, 2004). Our paper documents an also alarming obesogenic environment set by private schools in Brazil (in a ratio of almost 6:1), which, by the light of this literature, suggests that children and adolescents are susceptible to an environment that stimulates unhealthy eating, in a vicious cycle of purchases and availability of such products (Roberto et al., 2015).
An extensive set of interventions show that removing availability of unhealthy foods (Karen W. Cullen et al., 2007; Karen Weber Cullen et al., 2006; Daniel R Taber et al., 2011) and beverages in vending machines (Jensen et al., 2012; Sanchez-Vaznaugh et al., 2010), reducing portion-sizes and fat contents of foods (Hartstein et al., 2008; Mendoza et al., 2010) and introducing overall national food standards (A.M. & T., 2009; Spence et al., 2013) may stimulate healthy eating habits.
35
Results from the current study are consistent and corroborate with the systematic review that finds a positive association between school food environment changes in the availability of products and youth consumption (Driessen et al., 2014), and with the systematic review and meta-analysis that find that changes in competitive food standards and school meal standards can harness healthy eating habits (Micha et al., 2018). Moreover, this study provides longitudinal evidence to a similar study conducted in Australia, in which researchers find positive and significant associations of availability and consumption increase for different nutritional values between 1.0 and 1.7% (Grady et al., 2018).
Our results also show that such a positive association between availability and purchases of products has a direct impact neither on the school cafeterias’ finances nor on the average number of products purchased per student. Such results are consistent with the findings of the paper in a community sports setting in Alberta, Canada (Olstad et al., 2016), and from schools in the San Francisco (Wojcicki & Heyman, 2006) and California (Woodward-Lopez et al., 2010). As a result, this study provides additional evidence that food availability is an essential environmental driver for consumption (Davis Hearn et al., 1998; Olstad et al., 2016; Rasmussen et al., 2006), and that it can be provided without financial losses to school cafeterias (Olstad et al., 2016).
Policy implications are in line with food regulations on availability and accessibility that have been implemented in Mexico and the US (Roberto et al., 2015). Also, in Australia, many jurisdictions determine that high nutritional value items should represent at least 51% of the school cafeteria menus (Grady et al., 2018). Grady and coauthors suggest that for children and adolescents to reach at least 50% of healthy eating consumption, a larger proportion of availability is required. Our models corroborate with such findings, and we suggest that school cafeteria menus would need to change considerably to foster healthy eating behaviors in children and adolescents. In our sample from Brazil, a country whose regulation and enforcement on competitive foods in private schools are still weak, we observed that, on average, the availability of healthy foods at school cafeterias were just around 10%. This ratio would need to increase considerably, a task that is not feasible if not for coordinated and effective policies.
Moreover, it is essential to highlight that, although our results show no impact of the change in availability on cafeteria’s finances, we cannot claim that the same would happen if changes in the availability of products were considerably larger. In our sample, menus slightly change, and
36
we cannot make robust inferences for a bigger shift in the availability in proportions of products. Perhaps, some students would stop consuming at the cafeterias and start bringing food from home. In other words, it is important to notice that there is potential for compensatory impacts, meaning that by changing school cafeteria menus to a healthier composition, children and adolescents can bring more food from home, or compensate their healthy consumption at school with an unbalanced and unhealthy consumption out of school (Micha et al., 2018). However, our study suggests that small changes in availability can influence consumption, even when unhealthy products are still available. Future research at the student level is required to advance the topic.
Our study has several strengths. We provide robust and additional evidence of the impact of availability and purchases with a panel of 171 schools for twenty-four months, a large dataset that no other study to date (to our knowledge) provided. The use of a longitudinal dataset allows for the use of a fixed-effects model that controls for important sources of endogeneity related to time-invariant variables. Furthermore, we have an unobtrusive assessment of purchasing behavior through a magnetic-card, which enhances the precision of the outcome compared to studies which used self-reported data (Jones, Gonzalez, & Frongillo, 2010; D. R. Taber, Chriqui, Perna, Powell, & Chaloupka, 2012). Finally, we were able to aggregate results by finer-grained categories, while other studies focused mainly on the impact of F&V provision to foster healthy eating habits (DeCosta et al., 2017).
This study also presents some limitations. While the fixed-effects model account for time-invariant confounders and we control for some time-variant covariates, we cannot rule out reverse causality, i.e., children and adolescents’ purchases shaping the extent to which healthy products are available at school cafeterias There are reasons to believe that this should not be a major concern. First, we analyze contemporaneous changes in our models. While changes in availability may immediately affect purchases, there should be a temporal gap for the reversed causality to act. Once there is a change in demand, cafeterias would have to observe purchase trends, identify unsatisfied needs of children, plan the menu changes accordingly and make the products available, a process which is likely to take some time. Furthermore, we claim that even if children are purchasing healthier items (generating an increase in the demand), this could be due to fact that an increase in availability either led them to try new products or because they saw peers purchasing such products, which in turn led to an increase in their consumption of such products.
37
Finally, we lack information about state regulations, which can impact directly the availability at private school cafeterias across the country. Future studies might evaluate the effects of the state regulations on the product availability in the schools and its consequences on purchases and consumption.
7. Conclusion
Our study documents the obesogenic school food environments of private schools in Brazil. We suggest that it is possible to influence the number of healthy products purchased by changing the availability of healthy products at school cafeterias. In other words, we argue that if school cafeterias can make available a broader set of healthy foods, then we can expect children and adolescents to eat a larger proportion of such products. We found that the availability of low nutritional value products disproportionately increases students’ purchases, while the opposite happens with high nutritional value products. Interestingly, we found that changes towards a healthier menu composition may happen without expense to school cafeterias finances, as neither the total expenditure nor the total amount of products bought per student are affected by such changes. In sum, we argue that this study has important policy implications, as we conclude that there is room for improvement for school cafeteria menus avoiding conflicts between commercial and nutritional interests. Future research could address individual-level moderators for eating preferences and assess the extent to which the association of availability and purchases becomes more or less inelastic.
38
8. References
A.M., S., & T., K. (2009). The Impact of Nutrition Standards on Competitive Food Offerings and Purchasing Behaviors of High School Students. Journal of School Health, 79(11), 541–546. Retrieved from
http://ovidsp.ovid.com/ovidweb.cgi?T=JS&PAGE=reference&D=emed9&NEWS=N&AN= 19840231
An, R., & Sturm, R. (2012). School and residential neighborhood food environment and diet among California youth. American Journal of Preventive Medicine, 42(2), 129–135. https://doi.org/10.1016/j.amepre.2011.10.012
Azeredo, C. M., de Rezende, L. F. M., Canella, D. S., Claro, R. M., Peres, M. F. T., Luiz, O. do C., … Levy, R. B. (2016). Food environments in schools and in the immediate vicinity are associated with unhealthy food consumption among Brazilian adolescents. Preventive Medicine, 88, 73–79. https://doi.org/10.1016/j.ypmed.2016.03.026
Bere, E., Veierød, M. B., Bjelland, M., & Klepp, K. I. (2006). Free school fruit - Sustained effect 1 year later. Health Education Research, 21(2), 268–275.
https://doi.org/10.1093/her/cyh063
Bere, Elling, & Klepp, K. I. (2005). Changes in accessibility and preferences predict children’s future fruit and vegetable intake. International Journal of Behavioral Nutrition and Physical Activity, 2, 1–8. https://doi.org/10.1186/1479-5868-2-15
Blanchette, L. B. J. (2005). Determinants of fruit and vegetable consumption among 6–12-year-old children and effective interventions to increase consumption - Blanchette - 2005 - Journal of Human Nutrition and Dietetics - Wiley Online Library. Jnl of Human Nutr Dietetics, 18(6), 431–443. Retrieved from
http://onlinelibrary.wiley.com/doi/10.1111/j.1365-277X.2005.00648.x/full
Briefel, R. R., Crepinsek, M. K., Cabili, C., Wilson, A., & Gleason, P. M. (2009). School Food Environments and Practices Affect Dietary Behaviors of US Public School Children. Journal of the American Dietetic Association, 109(2), S91–S107.
https://doi.org/10.1016/j.jada.2008.10.059
Caballero, B. (2005). A Nutrition Paradox — Underweight and Obesity in Developing Countries. New England Journal of Medicine, 352(15), 1514–1516.
https://doi.org/10.1056/nejmp048310
Caspi, C. E., Sorensen, G., Subramanian, S. V., & Kawachi, I. (2012). The local food environment and diet: A systematic review. Health and Place, 18(5), 1172–1187. https://doi.org/10.1016/j.healthplace.2012.05.006
Corvalán, C., Garmendia, M. L., Jones-Smith, J., Lutter, C. K., Miranda, J. J., Pedraza, L. S., … Stein, A. D. (2017). Nutrition status of children in Latin America. Obesity Reviews,
18(July), 7–18. https://doi.org/10.1111/obr.12571
Cullen, Karen W., Hartstein, J., Reynolds, K. D., Vu, M., Resnicow, K., Greene, N., & White, M. A. (2007). Improving the School Food Environment: Results from a Pilot Study in Middle Schools. Journal of the American Dietetic Association, 107(3), 484–489. https://doi.org/10.1016/j.jada.2006.12.004
39
Cullen, Karen Weber, Watson, K. B., & Fithian, A. R. (2009). The Impact of School
Socioeconomic Status on Student Lunch Consumption School Nutrition Policy. Journal of School Health, 79(11), 525–532.
Cullen, Karen Weber, Watson, K., & Zakeri, I. (2008). Improvements in middle school student dietary intake after implementation of the Texas Public School Nutrition Policy. American Journal of Public Health, 98(1), 111–117. https://doi.org/10.2105/AJPH.2007.111765 Cullen, Karen Weber, Watson, K., Zakeri, I., & Ralston, K. (2006). Exploring changes in
middle-school student lunch consumption after local school food service policy modifications. Public Health Nutrition, 9(6), 814–820.
https://doi.org/10.1079/PHN2005878
Davis Hearn, M., Baranowski, T., Baranowski, J., Doyle, C., Smith, M., Lin, L. S., & Resnicow, K. (1998). Environmental influences on dietary behavior among children: Availability and accessibility of fruits and vegetables enable consumption. Journal of Health Education, 29(1), 26–32. https://doi.org/10.1080/10556699.1998.10603294
DeCosta, P., Møller, P., Frøst, M. B., & Olsen, A. (2017). Changing children’s eating behaviour - A review of experimental research. Appetite, 113, 327–357.
https://doi.org/10.1016/j.appet.2017.03.004
Dewey, K. G., Lo, B., & Cohen, R. J. (2002). Tracking of Dietary Intake Patterns of Chinese from Childhood to Adolescence over a Six-Year Follow-Up Period. Community and International Nutrition, (April), 3680–3686.
Drewnowski, A. (2010). The nutrient rich foods index helps to dientify healthy foods. American Journal of Clinical Nutrition, 91, 1095–1101.
https://doi.org/10.3945/ajcn.2010.28450D.Am
Driessen, C. E., Cameron, A. J., Thornton, L. E., Lai, S. K., & Barnett, L. M. (2014). Effect of changes to the school food environment on eating behaviours and/or body weight in children: A systematic review. Obesity Reviews, 15(12), 968–982.
https://doi.org/10.1111/obr.12224
Ferreira, C. M., Goldszmidt, R., & Andrade, E. B. (2019). The short- and long-term impact of an incentive intervention on healthier eating: A quasi-experiment in primary- and secondary-school cafeterias in Brazil. Public Health Nutrition, (8).
https://doi.org/10.1017/S1368980019000223
Grady, A., Delaney, T., Reilly, K., Lecathelinais, C., Wyse, R., Regan, T., … Wolfenden, L. (2018). Availability of food and beverage items on school canteen menus and association with items purchased by children of primary-school age. Public Health Nutrition, 21(15), 2907–2914. https://doi.org/10.1017/s1368980018001726
Hartstein, J., Cullen, K. W., Reynolds, K. D., Harrell, J., Resnicow, K., & Kennel, P. (2008). Impact of Portion-Size Control for School a la Carte Items: Changes in Kilocalories and Macronutrients Purchased by Middle School Students. Journal of the American Dietetic Association, 108(1), 140–144. https://doi.org/10.1016/j.jada.2007.10.005