Manuscript ID: 866 DOI: 10.18462/iir.icr.2019.0866
Experimental study of the consequences of controlled
atmosphere conservation environment on cherry
characteristics
Luís P. ANDRADE
(a,b,c), José NUNES
(a), Maria P. SIMÕES
(a,b), Diogo
MORAIS
(d,e), Cristina CANNAVARRO
(a,b), Christophe ESPÍRITO SANTO
(c),
Pedro D. GASPAR
(d,e), Pedro D. SILVA
(d,e), Mafalda RESENDE
(c), Catarina
CASEIRO
(c), Helena BEATO
(c), Yuran BELANE
(a,c), Dora FERREIRA
(a)(a) Agriculture School, Polytechnic Institute of Castelo Branco, Quinta da Senhora de Mercoles, 6001-909 Castelo Branco, Portugal
(b) CERNAS – Research Center for Natural Resources, Environment and Society, Polytechnic Institute of Castelo Branco, Av. Pedro Álvares Cabral, 12, 6000-084 Castelo Branco, Portugal (c) CATAA - Agrofood Technology Center, Centro de Apoio Tecnológico Agro-Alimentar, Castelo
Branco, Portugal
(d) University of Beira Interior, Rua Marquês d’Ávila e Bolama, 6201-001, Covilhã, Portugal (e) C-MAST - Centre for Mechanical and Aerospace Science and Technologies, Covilhã, Portugal
ABSTRACT
Cherry is a highly perishable fruit widely appreciated that is only commercialized during a short period. The post-harvest control and monitoring of this fruit is central and essential for optimal consumption in its highest state of quality. The conservation process aimed to inhibit the microbial propagation is usually accomplished by low temperatures and/or variable atmosphere composition. This paper describes experimental tests conducted in different refrigeration chambers located in industrial and laboratorial facilities. The latter one includes modified atmosphere and controlled atmosphere chambers. The tests were performed with four different concentration of O2 and CO2 in the controlled atmosphere chamber. Fruit samples extracted from each chamber were analyzed at specific residence times and several organoleptic characteristics were analyzed. The results show that the modified and controlled atmosphere maintain the fruit quality in terms of size, color, appearance and firmness, thus increasing their shelf life and food safety.
Keywords: Cherry Experimental test, Cold Storage, Modified atmosphere. Shelf life
1. INTRODUCTION
Food waste is a persistent problem for modern worldwide societies, causing both ethical and economic impacts. According to the Food and Agriculture Organization of the United Nations (FAO), one-third of the total food produced for human consumption is lost or wasted, approximately to 1.3 billion of tons and annual costs of over 750 billion dollars (Gustavsson et al., 2011). Moreover, 821 million people suffer from malnutrition around the world (FAO et al. 2018), therefore food waste should be eradicated. Lastly, natural resources (water and soil) and energy are also wasted, and biodiversity conservation and air quality are affected (Gustavsson et al., 2011). Thus, conservation of high-quality food products by increasing its shelf-life is a major priority for producers, distributors and consumers. Vegetables and fruits play an important role in human nutrition, mainly as a source of vitamins (C, A and B6), minerals and dietary fiber. In the post-harvest process, losses of nutritional quality may be significant, particularly in vitamin C, and these losses are associated with physical damage, prolonged storage, high storage temperatures, low humidity and cold damage (Kader 2013).
Cova da Beira (between Fundão, Covilhã and Belmonte) is one of the most important fruit and vegetable producer regions in the Centre of Portugal. Unique soil and climate conditions allow fruits
with high sugar content and a balanced acidity. Cherry trees are an important revenue for the region, with more that 30% of the total land (Instituto Nacional de Estatísticas 2018). More than 8500 tons are produced in the Centre of Portugal and more than 90% are produced in the Cova da Beira. Cherries are a highly perishable food product, due to their high water and nutrient content, that allows microorganisms to easily grow. Hence, special conservation conditions are essential to maintain cherry freshness and quality (Shellie et al., 2001; Palma et al., 2012; Wang and Vestrheim, 2002; Mattheis et al., 1997; Wang and Vestrheim, 2003; Tian et al., 2004; Gross et al., 2016). Cherries lose their quality by water loss, surface punctures, stem darkening and rotting (Dugan and Roberts, 1997; Tian et al., 2004). Cherry is a non-climacteric fruit, and its respiration rate decreases over time after harvest. Given its characteristics, it needs a cooling at the time after the harvest. The pre-cooling serves to maintain the intrinsic and extrinsic characteristics that make it appealing to the consumer, such as color and taste. By reducing the surface temperature and increasing the water content in the air (increase of the RH), cherries do not to lose volume nor the characteristic red color (Gross et al., 2016). If on the one hand cooling favors the extension of cherry life time, on the other hand, when applied in the wrong way, it favors the development of lesions. A correct parameterization of the cameras is one of the ways to guard against such events. Several studies were carried out to determine the cherry conservation parameters that considered the extension of the shelf life and the development of chilling damages, as shown in Table 1.
Table 1. Temperature, relative humidity and controlled atmosphere for cherry conservation conditions
Temperature [°C] Relative humidity [%] Conservation time Controlled Atmosphere [%] Reference CO2 O2 0 to 4 90 – 95 14 days - - Baptista (2007) -0.5 to 0.5 90 – 95 - - - Mitcham et al. (2009) -1 to -0.5 90 – 95 - 20 to 25 0.5 to 2 Silva (2002)
-1 to 0 >95% 2 to 4 weeks - - Gross et al. (2016)
- - - 5 to 20 1 to 5 Gross et al. (2016)
≈1 ≈95% 27 days 10 8 Palma et al. (2012)
0 to 2 >95% up to 3 weeks >15 <10 Wang and Vestrheim (2002)
≈1 ≈95% 60 days 10 5 Tian et al. (2004)
0 to 5 - 28 to 35 days 10 to 15 3 to 10 Ben-Yehoshua et al. (2005)
≈1 - 6 weeks 15 or 20 5 Mattheis et al. (1997)
Recently, controlled atmospheres in conjunction with low temperatures have been explored to increase shelf-life, avoiding waste and loss of economic value. This consists in using a chamber under a certain temperature and atmosphere to conserve cherries. Controlled atmospheres are constantly monitoring, renewing and adjusting air gases composition: nitrogen, oxygen and carbon dioxide. This offers a solution to increase cherry shelf-life without using non-natural chemicals, between harvest and market distribution.
Controlled atmosphere act on fruit respiration by lowering the rate, just by reducing oxygen concentration. Additionally, carbon dioxide can be increased to reduce surface microbes and rotting (Chavez-Franco and Kader, 1993; Dugan and Roberts, 1997; Tian et al., 2004; Tian et al., 2001; Vries-Paterson et al., 1991). Problems that occur by the usage of this technique normally occur at consumption stage. This may include, irregular maturation, potentiate undesirable odours and flavours, physiological alterations or increase susceptibility to rotting (after controlled atmosphere conservation). The potential benefit of this technology depends on the fruit, cultivar, physiological age, temperature and duration (Beaudry, 2000).
concentrations can lead to anaerobic fermentation, altering organoleptic characteristics of the fruit or vegetable (Beaudry, 2000). High concentrations can also be harmful to fruit and vegetable quality, by accelerating rot or by oxidizing the product (Wszelaki et al., 1999).
Carbon dioxide also influences quality during controlled atmosphere conservation. Increasing the concentration helps reduce fruit and vegetable decay due to its fungistatic action. However, not all fruits tolerate high carbon dioxide concentrations. This can trigger or aggravate physiological problems, irregular maturation, off flavours and odours, or even increase fruit decay susceptibility after conservation (Kader, 1995; Wszelaki et al., 1999). In this case, cherries are able to tolerate carbon dioxide by up to 40% concentration during conservation (Tian et al., 2004; Vries-Paterson et al., 1991). Nevertheless, oxygen concentrations cannot be lower than 1%, otherwise anaerobic fermentation occurs (Beaudry, 2000).
There are many studies on cherries conserved by controlled atmospheres (Table 1), and the principal focus is to determine oxygen and carbon dioxide gas proportions for best conservation results. The recommended atmosphere should have 10 to 15% carbon dioxide and 3 to 10% oxygen (Ben-Yehoshua et al., 2005; Tian et al., 2004; Kupferman and Sanderson, 2001) under a temperature of 0 to 5ºC (Ben-Yehoshua et al., 2005).
Here, we show a conservation study under controlled atmosphere of Cherries cv Satins using industrial size refrigeration chambers. The main objective is to increase cherries shelf-life by using controlled atmosphere conservation. Results from the study will aid on the application of this technology to cherries produced at Cova da Beira region.
2. MATERIALS AND METHODS
Cherries cultivar Satin used for controlled atmosphere studies were selected and hydrocooled at the producer CERFUNDÃO (Portugal). The start of the study was on the 26th June 2018 and ended on the 14th August 2018. Samples were taken after 3, 7, 14, 21 and 35 after the start of the study for normal atmosphere conditions; and 7, 21, 35, 42 and 49 days for controlled atmospheres.
Satin cv. cherries were stored and conserved in six different setups: at the farmer’s organization refrigeration chamber under normal atmosphere; and at the research centre CATAA under normal atmosphere and 4 different controlled atmospheres: A (3% O2 | 10% CO2); B (3% O2 | 15% CO2); C (10% O2 | 10% CO2), and D (10% O2 | 15% CO2).
Farmer’s refrigeration chamber was monitored for temperature and relative humidity using 2 data loggers “EL-USB-2-LCD+” from LASCAR ELETRONIC. One of the data loggers was positioned in the packages at the top of the pallet, while the other was placed in the lower packages, the measurement interval was done every 60 seconds.
CATAA cold chambers ( 26 m3) with a refrigeration unit Zanotti model C16 are equipped with a controlled atmosphere unit GAC 5000 (Fruitcontrol, Italy) that is able to monitor and modify atmospheres of individual pallets. Fruits trays (50x30 cm) are inserted on a euro-size pallet (size: 121x81.5 cm), a LDPE plastic is used to cover the fruits, and the plastic is sealed by a metal platform between the pallet and fruit trays. The atmosphere control unit is connected to the plastic chamber by 2 gas taps. Gases used to control atmospheres was carbon dioxide (Linde, Portugal) and nitrogen (Sysadvance, Portugal), oxygen increments were obtained using an air compressor (Hyundai HYAC24-2).
Cherries were conserved under temperature and relative humidity of 1.5 ºC and 92 - 96%, respectively. These values were obtained using a datalogger installed at the refrigeration chamber centre.
Samples of 50 cherries were inserted in the middle of a 5 kg cherry tray (± 4500 cherries), from these 50 cherries, 20 were individually numbered.
Cherries were individually weighted using a digital scale (Sartorius model TE1502S, Germany), before and after the conservation study.
Colour evaluation in both sides of the fruit was measured using a tristimulus colorimeter (Konica Minolta model CR-400 Chroma Meter, USA and illuminant D65, using CIE system L* (lightness) a* (green to red) b* (blue to yellow) and Colour Data CM-S100w software) having a 8 millimetre viewing area.
Texture was determined on the fruit cheek area as a skin mechanical resistance, with the help of a texture analyser (Stable Micro systems model TA-XTplus, United Kingdom), with a P75 compression
probe (75mm ø). The results are obtained by the software Exponent and expressed in Newton (N). According to NP EN 12143 (1999), soluble solids content (SSC) expressed as ºBrix using Atago model PR-32 alpha refractometer (Bellevue, WA, USA).
Titratable acidity, expressed as mEq/100 g, was obtained by potentiometric titration to pH 8.1 by a 0.1M NaOH solution using an automatic titrator (Crison, model Titromatic 2S+3B and TiCom software, Spain).
Statistical analisys was performed using SPSS 24 (IBM, 2016). Data assumptions of variance normality and homogeneity were verified using, respectively, the Kolmogorov–Smirnov test and the Levene Statistic (Maroco, 2011). Despite data normal distribution was not observed, sample was large enough to allow the use of a parametric test (Maroco, 2011).
One-Way ANOVA analysis was used to find significant statistical differences between time, for all modalities. After analysis, Scheffe test was applied for multiple comparisons.
3. RESULTS
3.1. Temperature and Humidity Conditions
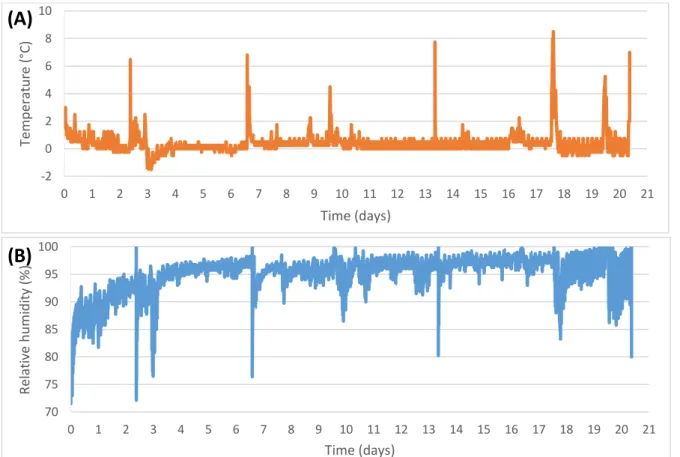
The temperature and humidity values monitored at the producer facility are shown in Fig. 1. Values presented are based on 4 measurements performed every 7 days. By the analysis of Fig. 1(A) it is possible to verify that the air temperature ranges between -0.5 ºC and +0.5 ºC that most of the time. Isolated temperature peaks are observed.
Figure 1: Evaluation of conservation parameters in the producer conservation chamber (A) Temperature, (B) Relative humidity
The peaks values arise from several factors, such as the increase of the thermal load of the chamber, opening of doors for logistics, thawing of the refrigeration system. These considerations are verified by the analysis of the relative humidity plot, Figure 1 (B), where the inverse relative humidity peaks correspond to the temperature peaks. This behaviour comes from the pallet movement inside the chamber during the test period, as a consequence of the producer's logistics. There were times
-2 0 2 4 6 8 10 0 1 2 3 4 5 6 7 8 9 10 11 12 13 14 15 16 17 18 19 20 21 Tempe ra ture (° C) Time (days)
(A)
70 75 80 85 90 95 100 0 1 2 3 4 5 6 7 8 9 10 11 12 13 14 15 16 17 18 19 20 21 Rel at iv e hum idi ty (% ) Time (days)(B)
where different products, at different temperatures, were inside the chamber. This fact also led to the need to remove the pallet from the refrigerated chamber to collect data from the data loggers, due to the limited space available for moving inside the chamber. One of the most recurring phenomena that affects the conservation environment is the opening of doors, with approximately 17 openings of short duration.
3.2. Fruit Quality Assessment
Initial cherry weight was, in average, 8.58 g ± 0.99 g, with a SSC of 17.78 % ± 1.73 % and 12.54 mEq./100 g ±1.24 mEq./100 g acidity.
Under normal atmosphere at the producer chamber, weight loss was decrease during conservation time, reaching -3.5 % after 21 days. Acidity also decreases but only statistically difference at 21 days conservation. No difference was observed for texture measurements (Table 2).
Table 2. Cherry quality evolution under normal atmosphere at farmer’s organization chamber
Time Weight loss [%] [°Brix] SSC Texture [N] [mEq./100 g]Acidity
0 (harvest) 17.78 ±1.73 2.02 ±0.45 12.54 ±1.24
3 -1.37 a 16.77 b 2.12 13.98 a
7 -2.00 a 17.34 ab 2.07 13.63 a
14 -2.73 b 17.60 a 2.29 13.10 a
21 -3.51 c 18.03 a 2.16 11.25 b
Different letters mean significant differences between values in the same columns (p-value<0,05). At the research facility (CATAA) the normal atmosphere modality which temperature and relative humidity conditions are described above (section 2.1), show a higher weight decrease overtime compared with the producer’s chambers (Table 3), probably related to temperature difference between the two conditions. After 21 days weight loss was -6.6 %, and -9.3% after 35 days conservation time. Similarly, to producers’ conditions acidity decreases, however, three statistical different groups were observed. Texture is maintained until 21 days conservation and lowers at 35 days conservation. If considering only the 21 days period, texture maintains similarly between the two normal atmosphere conditions (farmers organization and CATAA) (Table 3).
Table 3. Cherry quality evolution under normal atmosphere at CATAA chamber conditions
Time Weight loss [%] [°Brix] SSC Texture [N] [mEq./100 g]Acidity
0 (harvest) 17.78 ±1.73 2.02 ±0.45 12.54 ±1.24 3 -2.21 a 18.08 ab 1.65 a 14.03 a 7 -2.78 a 17.70 b 1.56 a 12.65 ab 14 -4.67 b 18.53 ab 1.59 a 12.71 ab 21 -6.65 c 18.59 ab 1.49 a 11.37 bc 35 -9.39 d 19.11 a 1.21 b 10.83 c
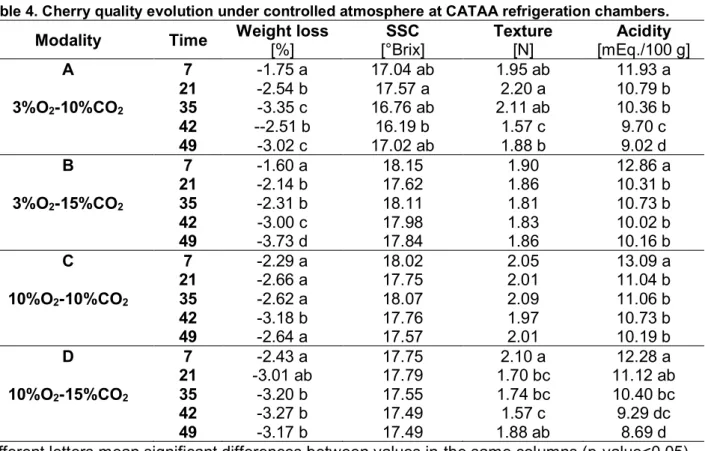
Different letters mean significant differences between values in the same columns (p-value<0.05). Under controlled atmosphere conditions that reached 49 days (14 days longer than normal atmosphere), we observe a decrease of weight and acidity over conservation time for all modalities (Table 4). Weight loss reached a maximum of -3.73 % (Table 4), which is correspondent to one third of the observed average at 35 days under normal atmosphere (table 3). On the other hand this value is similar compared to the farmer’s organization condition at end of conservation period (21 days, Table 2). Texture is maintained for modalities B and C, decreases for A and D. SSC varies only for modality A, and not consistently.
Considering acidity, all modalities decrease however, modalities B and C show less decrease not reaching under 10 mEq/100g. For modality A, acidity was 9.02 mEq/100 g and D was 8.69 mEq/100 g both at 49 days.
Table 4. Cherry quality evolution under controlled atmosphere at CATAA refrigeration chambers.
Modality Time Weight loss [%] [°Brix] SSC Texture [N] [mEq./100 g]Acidity
A 7 -1.75 a 17.04 ab 1.95 ab 11.93 a 21 -2.54 b 17.57 a 2.20 a 10.79 b 3%O2-10%CO2 35 -3.35 c 16.76 ab 2.11 ab 10.36 b 42 --2.51 b 16.19 b 1.57 c 9.70 c 49 -3.02 c 17.02 ab 1.88 b 9.02 d B 7 -1.60 a 18.15 1.90 12.86 a 21 -2.14 b 17.62 1.86 10.31 b 3%O2-15%CO2 35 -2.31 b 18.11 1.81 10.73 b 42 -3.00 c 17.98 1.83 10.02 b 49 -3.73 d 17.84 1.86 10.16 b C 7 -2.29 a 18.02 2.05 13.09 a 21 -2.66 a 17.75 2.01 11.04 b 10%O2-10%CO2 35 -2.62 a 18.07 2.09 11.06 b 42 -3.18 b 17.76 1.97 10.73 b 49 -2.64 a 17.57 2.01 10.19 b D 7 -2.43 a 17.75 2.10 a 12.28 a 21 -3.01 ab 17.79 1.70 bc 11.12 ab 10%O2-15%CO2 35 -3.20 b 17.55 1.74 bc 10.40 bc 42 -3.27 b 17.49 1.57 c 9.29 dc 49 -3.17 b 17.49 1.88 ab 8.69 d
Different letters mean significant differences between values in the same columns (p-value<0.05). Table 5 show Pearson’s correlation coefficient (r), between variables (weight loss, SSC, texture and acidity) and time. Modalities B and C are the conditions were cherry quality is maintained for a longer period of time. No significant correlation between time and both, SSC and texture were observed. Although significant correlation, modality C shows the lowest Pearson’s correlation coefficient compared with other modalities. Table 5 results underline results presented in table 4.
Taking into account all results presented here, modality C conditions are indicative to be the most appropriate to extend cherry cv. Satin shelf-life.
Table 5: Pearson’s coefficient correlation between variables (weight loss, SSC, texture and acidity) and time under different conservation conditions
Modality Weight loss [%] [°Brix] SSC Texture [N] [mEq./100 g]Acidity
Farmer’s -0.49 ** 0.24 ** ns -0.86** CATAA -0.80 ** 0.20 ** -0.38** -0.86** A (3%O2-10%CO2) -0.31 ** -0.12 * -0.19** -0.97** B (3%O2-15%CO2) -0.68 ** ns ns -0.67** C (10%O2-10%CO2) -0.21 ** ns ns -0.31** D (10%O2-15%CO2) -0.21 ** ns -0.24** -0.94**
Pearson’s Correlation Coefficient (r) significant correlated (** value<0.01; * value<0.05; ns: p-value>=0.05)
4. CONCLUSIONS
The present work shows that Satin cherry quality was maintained for 21 days in farmer’s organization conditions, where temperature and relative humidity were mainly between 0ºC - 1ºC and 95%, respectively. Hence, these conditions are according to usual conservation recommendation.
suggests that modality C (10% O2 and 10% CO2) maintains initial cherry quality for longer time, thus, extending cherry cv. Satin shelf-life.
ACKNOWLEDGEMENTS
This study is within the activities of Project “PrunusPÓS - Optimization of processes for the storage, cold conservation, active and/or intelligent packaging and food quality traceability in post-harvested fruit products”, project n.º PDR2020-101-031695, Partnership n.º 87, initiative n.º 175, promoted by PDR 2020 and co-funded by FEADER within Portugal 2020.
We thank CERFUNDAO farmers’ organization for cherries supply and participation.
REFERENCES
Baptista, Paulo. 2007. Sistemas de Segurança Alimentar Na Cadeia de Transporte e Distribuição
de Produtos Alimentares. Guimarães: Forvisão.
Beaudry, Randolph M. 2000. “Responses of Horticultural Commodities to Low Oxygen : Modified Atmosphere Packaging.” HortTechnology 10 (September): 491–500. https://doi.org/http://horttech.ashspublications.org/content/10/3/491.abstract.
Ben-Yehoshua, Shimshon, Randolph M. Beaudry, Svetlana Fishman, Sastry Jayanty, and Nazir Mir. 2005. “Modified Atmosphere Packaging and Controlled Atmosphere Storage.” In
Environmentally Friendly Technologies for Agricultural Produce Quality, 61–112. CRC Press.
https://doi.org/10.1201/9780203500361.ch4.
Chavez-Franco, Sergio H., and Adel A. Kader. 1993. “Effects of CO2 on Ethylene Biosynthesis in ‘Bartlett’ Pears.” Postharvest Biology and Technology 3 (3): 183–90. https://doi.org/10.1016/0925-5214(93)90054-7.
Dugan, F. M., and R. G. Roberts. 1997. “Pre-Harvest Fungal Colonization Affects Storage Life of Bing Cherry Fruit.” Journal of Phytopathology 145 (5–6): 225–30. https://doi.org/10.1111/j.1439-0434.1997.tb00390.x.
FAO, IFAD, UNICEF, WFP, and WHO. 2018. “The State of Food Security And Nutrition in the World 2018. Building Climate Resilience for Food Security and Nutrition.” Rome: FAO. http://www.fao.org/state-of-food-security-nutrition/en/.
Gross, Kenneth C., Chien Yi Wang, and Mikal Saltveit, eds. 2016. The Commercial Storage of Fruits,
Vegetables, and Florist and Nursery Stocks. Agricultural Research Service USDA. Boston, MA:
Springer US. https://doi.org/10.1007/978-1-4613-1127-0.
Gustavsson, Jenny, Christel Cederberg, Ulf Sonesson, Robert van Otterdijk, and Alexandre Meybeck. 2011. “Global Food Losses and Food Waste – Extent, Causes and Prevention. Rome.” In . Düsseldorf: FAO. https://doi.org/10.1098/rstb.2010.0126.
IBM. 2016. “IBM SPSS Statistics for Windows.” Armonk, NY: IBM Corp.
Instituto Nacional de Estatísticas. 2018. Estatísticas Agrícolas - 2017. Lisboa: INE. https://doi.org/0079-4139.
Kader, Adel A. 1995. “REGULATION OF FRUIT PHYSIOLOGY BY CONTROLLED/MODIFIED ATMOSPHERES.” Acta Horticulturae, no. 398 (March): 59–70. https://doi.org/10.17660/ActaHortic.1995.398.6.
———. 2013. “Postharvest Technology of Horticultural Crops - An Overview from Farm to Fork.”
Ethiop .J. Appl. Sci. Technol., no. 1: 1–8.
Kupferman, Eugene, and Peter Sanderson. 2001. “Temperature Management and Modified Atmosphere Packaging to Preserve Sweet Cherry Quality.” POSTHARVEST INFORMATION
NETWORK, 1–9.
Maroco, J. 2011. Statistical Analysis with SPSS Statistics (in Portuguese). 5th ed. Pero Pinheiro: Report Number.
Mattheis, J. P., D. a. Buchanan, and J. K. Fellman. 1997. “Volatile Constituents of Bing Sweet Cherry Fruit Following Controlled Atmosphere Storage.” Journal of Agricultural and Food Chemistry 45 (1): 212–16. https://doi.org/10.1021/jf960234v.
Mitcham, Elizabeth J, Carlos H Crisosto, and Adel A Kader. 2009. “Sweet Cherry.” UC Davis. Palma, V., A.C. Agulheiro-Santos, G. Machado, A.E. Rato, M.J. Cabrita, M. Lozano, and D.
![Table 1. Temperature, relative humidity and controlled atmosphere for cherry conservation conditions Temperature [°C] Relative humidity [%] Conservation time Controlled Atmosphere [%] Reference CO 2 O 2 0 to 4 90 – 95 14 days - - Baptista](https://thumb-eu.123doks.com/thumbv2/123dok_br/18650465.912441/2.892.88.808.460.850/temperature-controlled-atmosphere-conservation-temperature-conservation-controlled-atmosphere.webp)
![Table 3. Cherry quality evolution under normal atmosphere at CATAA chamber conditions Time Weight loss [%] SSC](https://thumb-eu.123doks.com/thumbv2/123dok_br/18650465.912441/5.892.89.811.771.954/table-cherry-quality-evolution-atmosphere-chamber-conditions-weight.webp)