[Escreva aqui]
Ana Sofia Alves dos Reis
Improvement of the projects’ elaboration and
execution processes using Lean tools in an
electronic components company
Masters Dissertation
Master in Industrial Engineering and Management
Work done under supervision of:
Professor Anabela Carvalho Alves
Professor Anabela Pereira Tereso
iii
A
CKNOWLEDGMENTSFor the conclusion of this dissertation I would like to thank to my master’s advisor, professor Anabela Tereso, and co-advisor, Professor Anabela Alves, for the total support and teachings. This project could not be possible without my Bosch’s coordinator,Francisco Vieira, that supported me throughout the journey so I thank him for the help, the teachings and the absolute availability during these months of work.
I also thank to my Bosch’s supervisors for the availability and for making the beginning of my career so incredible. A big thank you to all my Bosch colleagues and friends for the motivation and easy integration making me feel like home.
A big special acknowledgment to you, my friends and family, for always supporting my work and decisions throughout my journey and making me what I am today. A special thank you to my parents, Francisco Ferreira and Júlia Araújo for the teachings and for making me believe that everything is possible.
v
A
BSTRACTThis dissertation was carried out in the context of the Masters in Industrial Engineering and Management and was developed in the Bosch Production System department in an electronic components company in Braga – Bosch Car Multimedia, S.A. This company, is divided into five business units according to the type of product produced. Each business unit has a Value Stream Manager that is aware of the complete value stream and respective Key Performance Indicators (KPI’s), contributing for a continuous improvement culture.
The main goal for this dissertation was to reduce the time spent on the project’s lead time and hence increase the number of projects concluded and the Owners’ motivation.
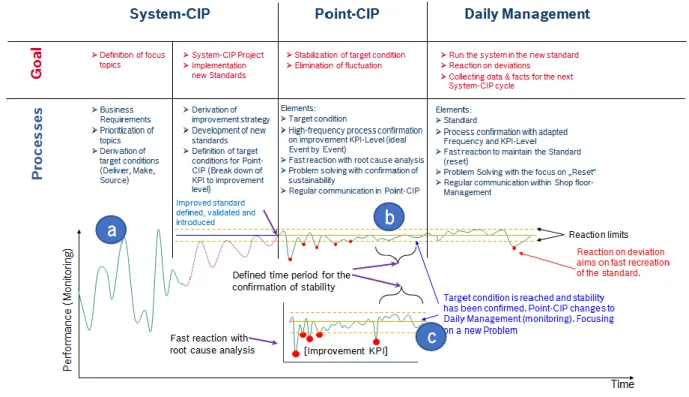
The System Continuous Improvement Processes (CIP) Approach, is a systematic approach for pursuing perfection by creating and executing projects focused on the main problems of the company, improving the company’s KPI’s. This systematic approach is divided into three main steps: System CIP, Point CIP and Daily Management Meeting (DMM). In turn, the System CIP is sub-divided into two steps the System CIP Workshop, a workshop that occurs two times a year (two revisions), and the System CIP Projects where the projects are executed.
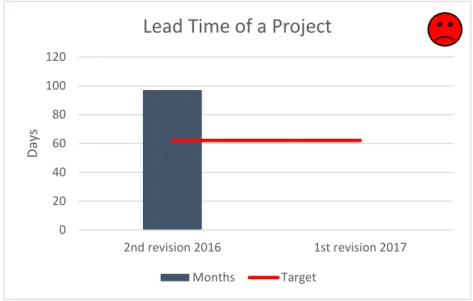
In each step different problems were identified such as, the high lead time for the project’s conclusion (97 days), the low number of projects concluded in each revision (35%), the lack of training, high amount of time wasted in waiting and the lack of support for the Owner. To solve them, management boards were developed, a training cycle was started to guarantee that everyone involved in the systematic had the proper training for it and the standards missing were created and implemented.
With these measures, the systematic was improved, the days needed for the projects conclusion were reduced from 97 to 72, representing a gain of 26%, allowing the inclusion of a new revision per year to create new projects and have the deliverables more rapidly. The percentage of projects concluded per revision increased to 45%, a gain of 10%. It is also expected, the increase of 33% of the company’s annual savings by creating a new revision for the systematic CIP where new projects will be created and hence more wastes eliminated.
K
EYWORDSvii
R
ESUMOEsta dissertação foi realizada no âmbito do Mestrado Integrado em Engenharia e Gestão Industrial e foi desenvolvida no departamento Bosch Production System numa empresa de componentes eletrónicos em Braga – Bosch Car Multimédia, S.A. Esta empresa está dividida em cinco unidades de negócio, consoante o produto produzido. Cada unidade de negócio, tem um Value Stream Manager que é responsável por toda a cadeia de valor e respetivos Key Performance Indicators (KPI’s) contribuindo para uma cultura de melhoria contínua.
O principal objetivo desta dissertação foi a redução do tempo necessário para a conclusão dos projetos e, simultaneamente, o aumento do número de projetos concluídos e da motivação dos Owners. System Continuous Improvement Processes (CIP) Approach é uma sistemática para a perseguição da perfeição através da criação e execução de projetos focados nos principais problemas da empresa e consequente melhoria dos KPI’s. Esta sistemática está dividida em três etapas: System CIP, Point CIP and Daily Management Meeting (DMM). Por sua vez, o System CIP é subdividido em duas etapas, o System CIP Workshop, um workshop que acontece duas vezes por ano (duas revisões) e o System CIP Projects onde os projetos são executados.
Em cada etapa da sistemática foram identificados vários problemas, como o elevado tempo para a conclusão de projetos (97 dias), o baixo número de projetos concluídos em cada revisão (35%), a falta de formação, elevado tempo desperdiçado em esperas e a falta de uma figura para suportar o Owner. Para os resolver, foram desenvolvidos quadros para a gestão dos projetos, foi começado um ciclo de formação para garantir que todos os envolvidos nesta sistemática têm o conhecimento para tal e foram desenvolvidos e postos em prática todos os standards em falta.
Através da implementação destas medidas, a sistemática foi melhorada, o número de dias necessários para a conclusão dos projetos foi reduzido para 72, representando um ganho de 26%, permitindo o desenvolvimento de uma nova revisão por ano obtendo os entregáveis mais rapidamente. A percentagem de projetos concluídos aumentou para 45%, um ganho de 10%. É também expectável o aumento de 33% das poupanças anuais da fábrica com mais uma revisão para a sistemática CIP onde surgirão mais projetos de melhoria e consequentemente maior será a eliminação de desperdícios.
P
ALAVRAS-C
HAVEix
T
ABLE OFC
ONTENTS Acknowledgments ... iii Abstract... v Resumo... vii Table of Contents ... ixFigure Index ... xiii
Table Index ... xvii
List of Abbreviations and Acronyms ... xix
Introduction ... 1
Background... 1
Objectives ... 3
Research Methodology ... 3
Structure of the Dissertation ... 4
Literature Review ... 7
Lean Production ... 7
Toyota Production System: The Origin of Lean ... 7
Wastes Types and Symptoms (Muda, Mura and Muri) ... 10
Principles of Lean Thinking ... 12
Lean and Other Tools ... 13
Kaizen ... 13
Structured problem-solving process ... 14
Standardization... 16
A3 Problem Solving Approach ... 17
PDCA ... 19
5S and Visual Management ... 20
Lean Office ... 22
Lean Leadership ... 23
x
Company presentation ... 27
Main Bosch's History Landmarks ... 27
Bosch in the world ... 28
Products ... 29
Organizational Structure ... 30
Bosch Production System ... 30
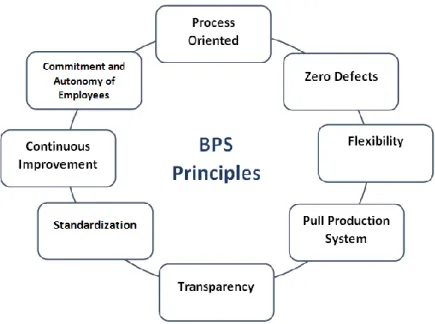
BPS principles ... 31
Continuous Improvement Processes (CIP) ... 32
Description and Analysis of the Current Situation ... 33
Key Performance Indicators (KPI's) used in Bosch ... 33
System CIP Approach ... 34
Parties involved in the System CIP Approach ... 35
System CIP Workshop... 37
System CIP Projects ... 41
Point CIP ... 44
Daily Management Meeting (DMM) ... 45
Critical analysis and problem's identification ... 47
KPI’s current values ... 47
Problems identified by the stakeholders ... 49
Low percentage of projects concluded and high time to conclude the projects... 49
Deviations from the System CIP Workshops and Bosch standards ... 50
Many and disorganized folders for System CIP Approach ... 52
Problems identified in the System CIP Projects ... 53
Missing requirements, skills and standard work for the VS Manager ... 53
High number of absences in the VS Meeting ... 54
Missing continuous support and motivation ... 55
Lack of training and PDCA cycle is not followed ... 55
Lack of execution of the Point CIP step ... 56
Lack of time for improvement ... 56
xi
Presentation and implementation of improvement proposals... 59
Standard work ... 59
Standard Work for the VS Manager... 59
Standard for System CIP Workshop, System CIP Projects and Point CIP ... 60
VS Meeting is scheduled separately and KPI’s stability defined ... 63
SC Meeting standard presentation is utilized ... 64
PDCA cycle management and task management ... 64
PDCA cycle management ... 64
Daily Management Board ... 66
The Paper Prototype ... 67
Competency Matrix ... 67
The Dot Game ... 69
A3 sheet and PDCA Cycle ... 72
Owners’ Performance Indicators... 73
Daily Responsibilities’ Management ... 74
Weekly Management Board... 76
Weekly Task Management ... 79
The Race of projects ... 80
Weekly Management Board in the SC meeting ... 81
Synthesis of the standards implemented ... 82
Result Analysis and discussion ... 83
Stakeholders’ satisfaction with the improvements ... 83
Daily Management Board impact ... 83
Weekly Management Board impact ... 85
Benefits of the standardized process ... 86
Decrease in the number of neglected projects ... 86
Shorter Meetings ... 88
Lead Time Reduction ... 88
Increase on the percentage of projects concluded ... 89
xii
Conclusions and future research ... 93
Conclusions ... 93
7.2 Future research ... 94
References ... 95
Appendices ... 97
Appendix I – A3 sheet for the dissertation ... 99
Appendix II – Current RASIC Matrix ... 101
Appendix III – Bubble Diagram ... 103
Appendix IV – Workshop System CIP ... 105
Appendix V – A3 Sheet ... 107
Appendix VI – Ishikawa Diagram ... 109
Appendix VII – Improved RASIC Matrix ... 111
Appendix VIII – Standard System CIP Workshop ... 113
Appendix IX – Standard System CIP Projects ... 115
Appendix X – Standard Point CIP ... 117
Appendix XI – PDCA Task Management ... 119
Appendix XII – Flowchart Coach ... 121
Appendix XIII – PDCA Activities ... 123
Appendix XIV – Standard Daily Management Board ... 125
Appendix XV – Standard Weekly Management Board ... 127
Appendix XVI – Satisfaction Survey for the Daily Management Board ... 129
xiii
F
IGUREI
NDEXFigure 1 - House of TPS ... 7
Figure 2 - Pyramid of TPS ... 8
Figure 3- Innovation, Kaizen and Maintenance Relationship ... 13
Figure 4 - A3 Sheet Template ... 18
Figure 5 - A3 sheet and PDCA cycle relation ... 19
Figure 6 - PDCA cycle. ... 19
Figure 7 - Bosch's History Landmarks ... 27
Figure 8 - Bosch's Sectors. ... 27
Figure 9 – Bosch factories localization: a) Bosch's World Subsidiaries b) regional subsidiaries (Portugal) ... 28
Figure 10 – Bosch’s customers ... 29
Figure 11 - Bosch Braga Products ... 29
Figure 12 - Organization chart ... 30
Figure 13 – BPS in Bosch ... 30
Figure 14 - Pyramid of BPS. ... 31
Figure 15 - Principles of BPS. ... 32
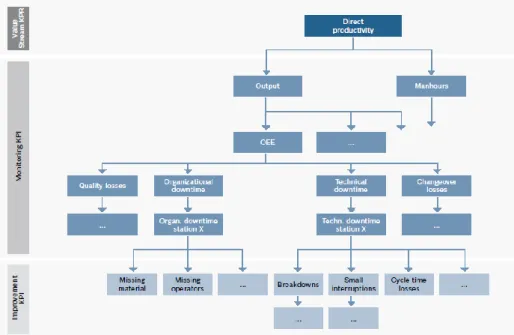
Figure 16 - KPI tree losses ... 33
Figure 17 - Relationship between the steps of the System CIP Approach and the KPI's ... 34
Figure 18 - Target Condition ... 35
Figure 19 - Level 2 of the BPS Assessment for the System CIP Approach... 35
Figure 20 - Parties involved in the System CIP Approach ... 36
Figure 21 - Example of a CIP Flash ... 38
Figure 22 - Value Stream: Source, Make and Deliver ... 39
Figure 23 - a) General Workshop View b) VS Manager mediating the workshop ... 39
Figure 24 - Project Sheet output from the workshop ... 40
Figure 25 - PDCA cycle comprised in the A3 sheet ... 41
Figure 26 - VS Manager board ... 43
Figure 27 – Project’s Sheet ... 43
xiv
Figure 29 - Improvement KPI ... 48
Figure 30 - Monitoring KPI ... 48
Figure 31 –Main problems identified by the stakeholders – inquiry results ... 49
Figure 32 – Percentage of projects concluded in the 2nd revision of 2016 ... 49
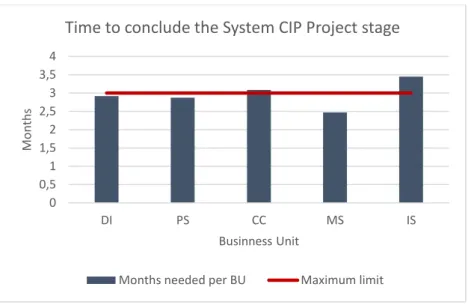
Figure 33 – Average of time to conclude the System CIP Project stage ... 50
Figure 34 – a) General VS Plant folder b) Standards’ folder ... 53
Figure 35 - Example of a normal environment in the VS Meeting ... 54
Figure 36 - A3 sheet: Description of the current situation ... 57
Figure 37 - A3 sheet: Problems identified ... 57
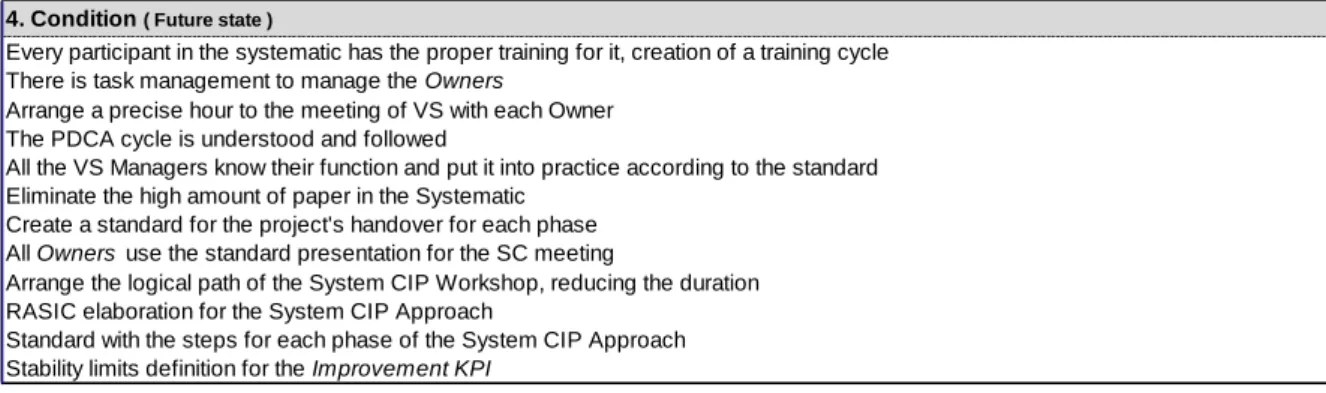
Figure 38 - A3 sheet: Future state ... 59
Figure 39 - System CIP Workshop’s guide excerpt ... 61
Figure 40 – System CIP Projects’ guide excerpt ... 62
Figure 41 - Point CIP’s guide excerpt ... 63
Figure 42 - Folder address for the standards ... 63
Figure 43 - Calendar from the PDCA task management ... 65
Figure 44 - Automatically filling on the document ... 65
Figure 45 - One day remaining alert ... 66
Figure 46 - Task concluded and number of days in arrears ... 66
Figure 47 - Status relation with the due date of the PDCA stage ... 66
Figure 48 – Daily Management Board a) Initial b) Current ... 67
Figure 49 - Daily management board paper prototype ... 67
Figure 50 - The four steps of knowledge comprised by the square ... 68
Figure 51 – a) Final product b) The product being produced ... 69
Figure 52 - Discussion at the end of each round ... 70
Figure 53- Poka-Yoke for the production to avoid defects ... 71
Figure 54 - A3 sheet and PDCA training a) Owners filling-in the A3 sheet b) Brief explanation ... 72
Figure 55 - Competency matrix ... 73
Figure 56 - Personal availability for the project... 73
Figure 57 - Overdue tasks a) per owner b) per month ... 74
Figure 58 - Follow-up of the overdue tasks ... 74
Figure 59 - Daily responsibilities management a) Initial b) Current ... 75
xv
Figure 61 - Project card a) The target condition was attained b) The target condition was not reached 76
Figure 62 - Weekly management board a) First Prototype b) Current ... 76
Figure 63 - Header of the project a) Project sheet b) Project card ... 77
Figure 64 - Level 3 of the BPS assessment for the System CIP Approach ... 77
Figure 65 - Improvement KPI in the board ... 78
Figure 66 - Section of the weekly management board ... 78
Figure 67 - Standard's card ... 78
Figure 68 - VS Manager board after the weekly management board ... 79
Figure 69 - Task's cards according to the PDCA cycle ... 80
Figure 70 - Weekly task management ... 80
Figure 71 - Project's race ... 80
Figure 72 – Car with the project’s number ... 81
Figure 73 - SC meeting before the Weekly Management Board ... 81
Figure 74 - SC meeting being supported by the board ... 82
Figure 75 - A3 sheet: standards implemented related with the root causes found ... 82
Figure 76 - Analysis of the Owners' responses for the Daily Management Board ... 84
Figure 77 - Analysis of the Coach's responses for the Daily Management Board ... 84
Figure 78 - Analysis of the Owners' responses for the Weekly Management Board ... 85
Figure 79 - VS Manager's responses for the Weekly Management Board ... 86
Figure 80 - Number of projects neglected in the last and current revision ... 87
Figure 81 - Improvement KPI ... 89
Figure 82 - Number of projects concluded per B.U. in the last and current revision ... 89
Figure 83 - Monitoring KPI ... 90
Figure 84 - A3 sheet used for this dissertation ... 99
Figure 85 - Current RASIC Matrix ... 101
Figure 86 - Bubble Diagram template ... 103
Figure 87 - a) Board 1: Customer Requirements b) Board 2: KPI's c) Board 3: Target Analysis ... 105
Figure 88 - a) Board 4: Inputs from DMM and last revision projects b) Board 5: VSM and Bubble Diagram c) Board 6: BPS Vision ... 105
Figure 89 - a) Board 7: BPS Assessment b) Industry 4.0 c) True North ... 105
Figure 90 – a) Board 10: Prioritization Matrix b) Board 11: Projects defined for the System CIP Projects ... 106
xvi
Figure 91 - A3 Sheet Bosch's template ... 107
Figure 92 - Ishikawa Diagram for the high lead time for the project conclusion ... 109
Figure 93 - RASIC matrix for the System CIP Workshop ... 111
Figure 94 - RASIC matrix System CIP Projects ... 111
Figure 95 - RASIC Matrix Point CIP ... 112
Figure 96 - Standard: System CIP Workshop ... 113
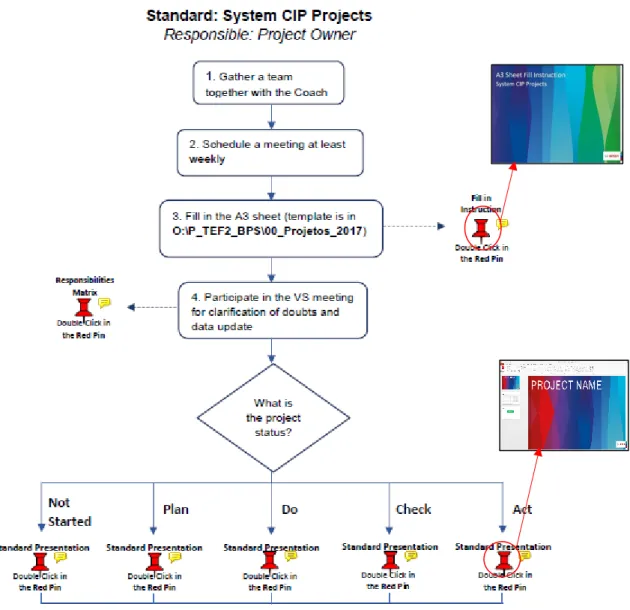
Figure 97 - Standard System CIP Projects ... 115
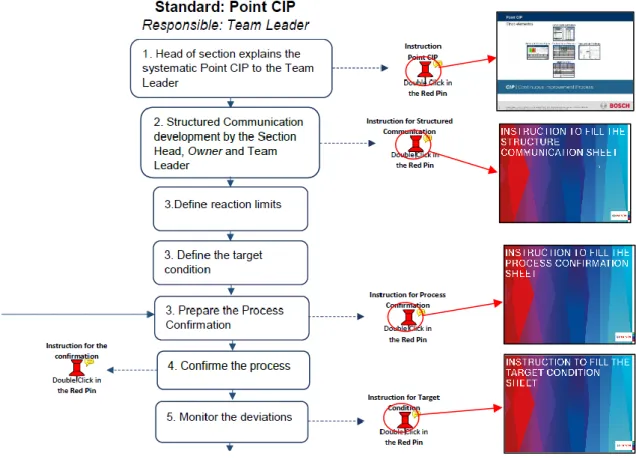
Figure 98 - Standard: Point CIP ... 117
Figure 99 - PDCA task management document ... 119
Figure 100 - VBA code for inserting the calendar in the document ... 119
Figure 101 - VBA code for the calendar to show up when start date cell is selected ... 119
Figure 102 - VBA code that returns the date when the task was concluded ... 120
Figure 103 - Flowchart guide for the Daily Management Board for the Coach ... 121
Figure 104 - PDCA Activities ... 123
Figure 105 - Exerpt of the standard for the Daily Management Board ... 125
Figure 106 - Excerpt of the standard for the Weekly Management Board ... 127
Figure 107 – Satisfaction Survey: Daily Management Board - Owner ... 129
Figure 108 - Satisfaction Survey: Daily Management Board – Coach ... 130
Figure 109- Satisfaction Survey: Weekly Management Board – Owners ... 131
xvii
T
ABLEI
NDEXTable 1 - Planned duration for the different stages ... 37
Table 2 - Planned duration for each meeting ... 42
Table 3 - Type of problem and respective tool to solve it ... 46
Table 4 - Lead Time: Initial Situation ... 47
Table 5 - Lead Time: Target ... 47
Table 6 - Analysis of the workshop's duration ... 52
Table 7 - Requirements for a VS Manager ... 54
Table 8 - Planned and real duration for each meeting ... 55
Table 9 - Time spent by using the standard's presentation ... 64
Table 10 - Results of the first round ... 70
Table 11 - Results of the second round ... 71
Table 12 - Results for the third round ... 72
Table 13 - Improvement on the neglected projects ... 87
Table 14 - Improvement on the VS meeting ... 88
xix
L
IST OFA
BBREVIATIONS ANDA
CRONYMSBPS: Bosch Production System B.U.: Business Unit
CC: Chassis system and Control
CIP: Continuous Improvement Processes DI: Drive Information
DMM: Daily Management Meeting IRR: Internal Rejection Rate IS: Instrumentation System KPI: Key Performance Indicator KPR: Key Performance Results MS: Manufacturing Service MTN: MainTeNance department NOK: Not OK
OEE: Overall Equipment Efficiency OPL: Open Point List
PDCA: Plan Do Check Act PS: Professional System
S.A.: Anonymous Society (Sociedade Anónima) SC: Steering Committee
SMART: Specific, Measurable, Relevant and Time-limited TPS: Toyota Production System
VS: Value Stream
VSD: Value Stream Design VSM: Value Stream Mapping WIP: Work in Process
1
I
NTRODUCTIONThis chapter presents the background and motivation for this dissertation project. Therefore, in this section the objectives are identified, the research methodology is presented and the dissertation structure is depicted.
Background
Nowadays, the companies are facing a considerable growth in competitiveness and, simultaneously the client’s demand has reached a high point. The tendency for these characteristics is incremental. Thus, continuous improvement, that is, the constant chase of perfection, is crucial to be a strong part of the market and to face the competition. For that, the Lean strategy and Kaizen, the continuous improvement, are used. The waste elimination is the main goal for this process and it is the responsible for searching and implementing new methods, such as, Six Sigma, Plan-Do-Check-Act (PDCA) cycle and Total Quality Management (Kumiega & Van Vliet, 2008).
Nevertheless, Lean Production is a methodology that, involving these methods, improves productivity and reduces costs. According to Womack, Jones and Roos (1990), Lean Production is a superior way for humans to make things. To achieve this, Lean uses a set of techniques that, when combined and developed, allow the reduction and elimination of waste (Wilson, 2009). These tools support a different thinking that defines a new way of producing, the Lean Thinking (Womack et al., 1996).
Lean Production had its roots in manufacturing, specifically, in the Toyota Production System (Ohno, 1988) but since then evolved to a philosophy called Lean Thinking (Womack & Jones, 2010). Lean Thinking has five principles: 1) Value; 2) Value Stream; 3) Flow; 4) Pull production and 5) Pursuit perfection. Nowadays these principles are applied in all areas and sectors (Alves, Kahlen, Flumerfelt & Manalang, 2014) and its application is equally advantageous to the application to the traditional gemba1.
One such application is in services, offices and indirect areas of companies and is known as Lean Office, that is, the Lean Thinking principles applied to administrative environments. Case studies of this application are, for example, Monteiro, Pacheco, Dinis-Carvalho and Paiva (2015) and Chen and Cox (2012).
2
Project management departments are one of such indirect areas. According to Munns and Bjeirmi (1996), the functions of project management include 1) The definition of the required work; 2) Work extension establishment; 3) Requirement of resources allocation; 4) Work execution planning; 5) Work progress monitoring and 6) Adjustments to plan deviations. Leadership, especially in project management, is crucial. A leader is someone whose followers are willing to follow his orders just because he is ordering. The inherent characteristics of a good leader are his competence, character, position and personality. The choice of a leader has to be pondered and based on the individual as a whole (Wilson, 2009). The project success is dependent on the elaboration of a realistic and well-defined goal, on the competition, client’s satisfaction, profitability, availability of the market, implementation process used and on the value of the project to the company. On the other hand, an inadequate management base to the project, lack of administration support, not well-defined tasks, lack of techniques for project management and their wrong utilization, and the lack of engagement with the project can lead to the project failure (Munns & Bjeirmi, 1996).
All this management process involves a lead time, that is, the total of time that a client waits to have an output of the process (Mehta, 2015). A company with low lead times is more reactive and flexible (Wilson, 2009) thus it is of high importance its reduction. Another Lean basis is the standardization, that is, the creation of a guideline for a certain activity where the steps are well-defined. If the standard is respected, it is possible to predict resources, tools and security precautions needed and what and when the output of the process is going to happen (Mehta, 2015).
The business environment is characterized by uncertainty and the future prediction is defying, so it is necessary the constant acquisition of new competences, mainly on project management, where the pursue of knowledge is one of the critical factors for success (Suikki, Tromstedt & Haapasalo, 2006). The development of an organization focused on the apprenticeship is fundamental, an organization that is gifted with creating, acquiring and knowledge transferring, and willing to change their behavior to reflect the learning (Kotnour, 2000).
This kind of environment is characteristic of the company where this project was developed that is an electronic components company, Bosch Car Multimedia, S.A. In this company, it was created a well-defined structure to improve the existing value streams constituted by three levels of Continuous Improvement Processes (CIP): System CIP; Point CIP and Daily Management Meeting. System CIP is sub-divided into two steps, System CIP Workshop and System CIP Projects.
3
Nevertheless, a lot of problems were identified in this process, namely, the lack of standardization, high lead times to conclude the projects, the number of projects concluded and the failure to achieve a suitable style of leadership, among others, originating the need for improvement. Under the Lean Thinking philosophy, a project development environment is also suitable to apply Lean Office, as lots of processes are necessary and always in progress (Cusumano & Nobeoka, 1998).
Objectives
The dissertation had its focus on the improvement of the processes performed in projects’ execution by using Lean tools, allowing the elimination of the existing wastes. In order to accomplish this goal, the research project was based on:
• The reduction of the time needed to conclude the projects; • The standardization of the project’s management practices; • The increase of the number of projects concluded.
For this section (section 1.2) a SMART (Specific, Measurable, Achievable, Relevant, Time-limited) objective was defined. So, the SMART objective of this dissertation is to reduce the lead time of a project inserted on the System CIP Approach from 97 days to 60 days or less and increase the number of projects concluded from 35% to 45% or more and hence move from the level 2 of the BPS (Bosch Production System) assessment to the level 3 in one year.
Research Methodology
The problem was identified and solved by participating on the activities having in consideration the theoretical lore behind it, which is to say, that the researcher worked under the “learning by doing” process, named Action-Research (O’Brien, 2002). This research methodology was introduced by Kurt Lewin in 1946 and one of the many definitions defends that the research follows five steps 1) diagnosing; 2) action planning; 3) action taking; 4) evaluating and 5) specifying learning (Susman & Evered, 1978). This line of thinking was followed in this dissertation project. The different phases aimed to be accomplished are enumerated below:
1. Literature review: The starting point of the dissertation was an exhaustive research about the topic. The use of filters such as keywords, year of publication and type of documents guided the search process. After a filtration, the first documents were analyzed and a literature review was made.
4
2. Study and analysis of the current situation: After an exhaustive study of the topic, a diagnosis was developed about the current situation of the company, naming the main problems found. For this to be achieved, appropriate tools were used in order to find the root-cause for each problem, namely, cause-effect diagrams, five Whys, and checklist usage for the expected points for each project process. 3. Definition of improvement measures: After the problems found and described, a planning of the improvement took place. In this step, the creativity to find new and refreshing ideas for improvement of the current situation was required. Quality tools were used to give consistency to the developed ideas. 4. Implementation of the new measures: The next stage involved the implementation of the developed ideas. To attain this, Lean tools and workshops with the intent of passing knowledge to the workers took place.
5. Analysis and discussion of the results: Implemented improvements were analyzed using a comparison between the situation before and after the proposals implementation. The results were monitored to assure the success of the process.
6. Learning specification: After the project’s consolidation, a critical analysis for the future occurred, with an approach using Lean and continuous improvement philosophies.
Structure of the Dissertation
This dissertation is divided in seven different chapters. The first is where this sub-chapter is inserted, the introduction of the dissertation, that is, where the background is described, the objectives identified and the research methodology used depicted.
The second chapter presents a literature review of the main topics addressed in this dissertation, serving as a theoretical background, where the main Lean concepts and its tools that support the methodology, i.e., the waste elimination, are explained.
The company where this dissertation was developed is presented in the third chapter. The main history landmarks for it are identified and the company’s journey around the world acknowledged. After that the level of detail starts to increase, deepening to the department in which the dissertation was inserted. In chapter four the current situation is analyzed and the problems identified, the data gathered is considered and the System CIP Approach, a systematic inserted on the continuous improvement process, is explained. After this analysis, a critical one took place in order to identify the existent problems. This analysis was based on the participants’ opinion and on the personal involvement in the systematic.
5
To solve the identified problems, the improvement measures are described in chapter five. In chapter six, the results obtained with the implemented measures are quantified and analyzed. Lastly, chapter seven presents the conclusions of the research and the proposals for future work.
For this dissertation, the A3 sheet tool was used (see Appendix I – A3 sheet for the dissertation) and its different sections are inserted in different chapters through this document.
7
L
ITERATURER
EVIEWIn this section, a literature review was made about the key points of Lean Production, Lean Office and its tools. These were the most relevant topics for this dissertation development.
Lean Production
This section presents a briefly introduction to Toyota Production System (TPS) as Lean had its roots in this system. Also, waste types and symptoms are presented. Next, Lean Thinking principles are described.
Toyota Production System: The Origin of Lean
Toyoda Automatic Loom Works, the basis of the current Toyota Motor Corporation, was founded by Kiichiro Toyoda in 1926. In 1950, after World War II, Japan had recently suffered an attack of two atomic bombs. The country and, hence, the industry, was devastated with the majority of the plants destroyed and consumers had no money to spend, an appalling situation for the country. Under these conditions, Taichii Ohno, the Toyota’s plant manager, based on the Henry Ford’s lessons, developed the Toyota Production System, TPS, and, ultimately Lean Production (Womack et al., 1996). To represent all the developed methods in a structured way, Fujio Cho, an Ohno’s disciple, summarized them into a house diagram, Figure 1.
Figure 1 - House of TPS(Liker & Morgan, 2006)
The top of the house represents the main goals of the TPS, best quality at a lowest cost with short lead times but never disregarding safety and morale. To attain this, the foundation of the house that gives the
8
stability needed for the pillars construction, are the stable and standardized processes and the leveled production, heijunka. Heijunka is the production’s levelling, to make the same amount and mix of products everyday (Liker, 2004). Once this is ensured the standard and stability opportunities occur, this processes guarantee the house’s overall stability (Liker & Morgan, 2006).
The house’s pillars are, primarily, the just-in-time production and, secondly, the jidoka. Just-in-time, JIT, it’s a principle for getting the right part to the right place at a right time, creating a rapid and efficient flow without inventory. Jidoka, also referred to as autonomation, “a machine with human intelligence”, where the intelligence is applied to stop the process when a defect occurs, making it impossible to go through the production (Liker & Morgan, 2006). TPS is focused not only on technical parts but also on getting everyone involved in the continuous improvement process (Liker, 2004).The heart of the house is converged in continuous improvement, kaizen, to get every part of the process engaged in it (Liker & Morgan, 2006).
“The insight that Toyota applies underlining principles rather than specific tools and processes explains why the company continues to outperform its competitors” (Spear, 2004). According to Liker (2004) there are four general categories organized in a pyramid, Figure 2, for the 14 existent principles of TPS.
Figure 2 - Pyramid of TPS (Liker, 2004)
The Philosophy is the support of the TPS structure. This slice comprises the first principle: • 1st principle: there is the need for a long-term philosophy that surpasses any short-term
decision to align the whole organization to a common purpose.
“The right process will produce the right results” (Liker, 2004). Many companies, misguidedly follow only the broad category that is Process and think that alone it translates “lean thinking” but to achieve the state of a complete lean company all layers have to be respected (Liker, 2004). This second layer of the 4P’s Toyota pyramid comprises 7 principles, these are:
9
• 2nd principle: stresses the importance of a continuous process flow to make problems easily
visible;
• 3rd principle: works when the customer’s order is the trigger for the start of the production,
where it is given to the client what he wants in the quantity he needs and when he wants it and this will result in a decrease in stock and work in process;
• 4th principle: enhances the heijunka, that is, the leveling of the production, which supports the
third principle. The client’s demand is not predictable, Toyota has found that the leanest operations are not always made to order but by leveling the production schedule; • 5th principle: is focused in Jidoka, this enhances the need to stop the process to fix the
problems and consequently have the quality demanded at the first time; this will have thus the overproduction prevention and the problems control (Sugimori, Kusunoki, Cho, & Uchikawa, 1977);
• 6th principle: it is stressed the basis of the continuous improvement culture, the standard. A
standardized process is the key for a continuous flow and a pull system which facilitates the prediction of the process allowing a regular output and timing and simultaneously increases the flexibility in the team, because the work that is required can be taught easily;
• 7th principle: addresses the importance of the visual control usage, when a system uses visual
control that allows them to check if the standard is being fulfilled and the problems come to the surface which makes it easier to correct them;
• 8th principle: enhances the importance of the technology and when to use it. The technology
should be an assistance to the worker and not a replacement; the usage of technology must be encouraged, but always pondered because new technology is always untrustworthy and to standardize it is a challenge.
Workers play an important role in Toyota, thus a system of respect for humans was developed (Sugimori et al., 1977). The third layer of the pyramid is the People and Partners. This layer comprises three principles:
• 9th principle: enhances the need of creating a leader that clearly understands the work, lives the
philosophy and is able to teach it to others;
• 10th principle: It is believed that a true Toyota leader has to live and meticulously understand
the Toyota culture which leads to a “non-shopping” leaders from outside culture, a leader is grown from within and has to be a role model respecting the company’s culture. This principle
10
stresses the importance of creating extraordinary people whom comprehend and follow the company’s culture;
• 11th principle: is underlined the need of challenging the outside partners aiming to make them
grow and develop always with respect throughout the process.
The top layer of the pyramid is the Problem Solving, which covers the continuous improvement and learning process through it. The last three principles are inserted on this layer:
• 12th principle: undertakes the practical way of solving problems, that is, the “go to the gemba
and see” to accurately understand the problem situation, genchi genbutsu 2;
• 13th principle: a decision has always to be made slowly and having on consideration the
possible options and from the moment the decision is made this has to be implemented the fastest way possible using the nemawashi, that is, the process of discussing the problem and possible solutions with all the involved in it;
• 14th principle: translates the aim to become a learning organization per the usage of continuous
improvement to find the root causes to apply effective actions, to eliminate inventory that hides the existent waste, to protect organizational knowledge by making usage of hensei, that is reflection throughout the process and create countermeasures to ensure that the problems don’t happen again and focus the learning process by standardizing the best measures created. The errors are seen as opportunities to learn and evolve, the company’s culture is based on the learning with the mistakes by empowering people to apply the actions that are thought to best fit the problem following a kaizen culture.
These fourteen principles work as guidelines to become a real lean culture. In this dissertation, the current situation will be compared with each one of them to find the proper counter-measures to correct the root causes behind the barriers to achieve a culture fully lean.
Wastes Types and Symptoms (Muda, Mura and Muri)
Firstly, for a systematic waste elimination, the companies should put effort to understand what is valuable for the client (Flinchbaugh, 2005). After identifying what are the value-adding activities, the remaining activities can be reduced or eliminated.
2Genchi Genbutsu: Japanese word that means “go and see for yourself”, this involves going to the shop-floor and analyze the
11
Secondly, to achieve a philosophy of systematic waste elimination is necessary to persistently pursue it, that is, developing a passion for eliminating waste (Flinchbaugh, 2005). Most of the companies ignore the importance of mura and muri (Rose et al., 2008) so in some references these are mentioned to as the forgotten M’s (Pereira, 2008).
Muri means overburdening people or equipment and outcomes in safety and quality problems. Sometimes muda 3 leads to muri because what is consistent occasionally causes an overburden of all the
involved (Rose et al., 2008). Mura, inconsistency, is the result from an irregular production schedule due to internal problems. “Muda will be a result of mura” (Liker, 2004). Muda, meaning waste, are the activities that don’t add value to the client’s order (Rose et al., 2008). Shingeo Shingo identified seven types of muda (Rose et al., 2008):
• Overproduction: Ohno considered this as the main waste because is the trigger for the other existent wastes (Liker, 2004). The overproduction happens when it is produced more quantity or earlier than is needed, leading to the production of items that weren’t ordered (Hines, Riccardo, & Bartolini, 2002). Some of the aftereffects of this overproduction are the anticipation of the purchases of raw materials to produce which leads to an increase of stock which hides the problems through the production processes, resulting in a non-flexible planning, since the warehouses are full of materials that aren’t needed, leaving no space for what the client really wants (Amaro & Pinto, 2007);
• Defects: these are identified errors in the production. These defects lead to rework, production replacement, scrap and inspection (Liker, 2004) which brings an increase in stock to compensate the defective products reducing the productivity and increasing the cost of the products and services (Amaro & Pinto, 2007)
• Unnecessary inventory: high levels of stock, that is, excessive storage, causes longer lead times and higher cost, because of the extra time and money that is needed to transport, production and storage of the extra quantity (Liker, 2004). Other issue is the coverage of the problems with stock such as feeble machines layout, high setup times, the existence of bottlenecks and quality problems (Amaro & Pinto, 2007);
• Over processing or inappropriate processing: select useless steps to process the parts, wrong tools instigate unnecessary movements and defects whereas often a simpler tool would be more effective (Amaro & Pinto, 2007);
12
• Excessive transportation: transportation includes any type of material being transported. The transportation systems occupy the company’ space, increase the production time and sometimes the product is damaged while being transported. It cannot be expected an elimination of the total time spent in transportation; one way to see it can be the reduction of the distance between processes and the creation of flow between them (Amaro & Pinto, 2007).
• Waiting: it refers to the time wasted by people, machines or product on waiting. This is an unproductive time that increases the lead time of the whole process (Amaro & Pinto, 2007). • Unnecessary motion: all the unnecessary movements performed by the employees during the
sequence of their work, or the movements that are too slow, too fast or excessive (Amaro & Pinto, 2007).
Liker (2004) identified an extra muda, the unused employee creativity. This waste meets the People and Partners layer of the pyramid and stresses the loss of the human potential, ideas, skills, improvement and learning opportunities by not engaging on listening to the employees. The eight wastes are mainly comprised on a manufacturing perspective but these can be allocated to the indirect areas as well. Lean is the watchword to fight these wastes.
Principles of Lean Thinking
The Lean Production was made renowned by Womack et al. (Van Amelsvoort, P., & Benders, 1996) and had its roots in TPS (Ohno, 1988) but since then it evolved to a philosophy called Lean Thinking. Lean can be seen from two different perspectives, practical and philosophical (Boyle, Scherrer-Rathje & Stuart, 2011). From a practical perspective, Lean involves the usage of tools and techniques, such as, 5 Why’s, Six Sigma and Kaizen, to reduce and then eliminate the waste (Wilson, 2009). From a philosophical perspective, these practices are interrelated to eliminate waste in functional areas, improve the integration and quality (Boyle, Scherrer-Rathje & Stuart, 2011).
This philosophical perspective is called Lean Thinking (Womack & Jones, 2010). Lean Thinking is based on five steps: 1) Value: the first step is to specify what is the value for the client; 2) Value Stream: secondly, the lean company must identify the value stream, i.e., the processes that a product needs to go through; 3) Flow: after eliminating the identified muda, the remaining steps must create flow. A complex task insofar as the human being is formatted to think in “departments” and “functions” and not with an holistic view; 4) Pull: the client’s order will trigger the whole process which makes the company produce only what is needed, the demand’s prediction will be facilitated because of the throughput time reduction
13
when the flux is created and 5) Pursuit of Perfection: the last step is the constant search of perfection; people should have the ability to continually improve (Womack et al., 1996).
Lean and Other Tools
This section presents some Lean tools and other tools used in the Lean context such as PDCA (Plan-Do-Check-Act) and SDCA (Standard-Do-(Plan-Do-Check-Act).
Kaizen
Kaizen, a Japanese word translated as continuous improvement was first introduced by Imai in 1986 and it was described as an “ongoing improvement involving everyone - top management and workers - and entails relatively little expense” (Imai, 2005). Kaizen is all about small incremental changes that bring major improvements to the process, which makes companies always look out of their comfort zone (Imai, 2005). , The comparison between innovation, maintenance and kaizen is represented in Figure 3, where the different classes of a company’s contributors can be seen.
Figure 3- Innovation, Kaizen and Maintenance Relationship (Imai, 2005)
Management, in general, is divided into maintenance that infers the monitoring of the current standards and improvement that is an act to amend the current situation and hence improve the current standards (Shingeo Shingo, 2007). This improvement, in turn, can be classified as innovation or kaizen. The first, innovation, includes a radical improvement with a massive investment in resources that involves top and middle management whereas kaizen implies small and inexpensive improvements as a result of enduring efforts and covers all layers of contributors (Imai, 2005).
The secret for a great longevity of a company is to develop the capacity to adapt, develop continual and incremental improvements and maintain them to satisfy the client’s demand (Rother, 2010). This little and incremental improvements allow a learning process to make adjustments to the system and discover the best way to achieve the main goal that is desired (Rother, 2010).
14
On a competitive point of view, when you achieve the cost and quality goal with the sum of incremental changes, which are difficult to copy, leads to a competitive advantage (Rother, 2010). Despite of this clear gain with developing incremental changes, it’s thought that the usage of cutting-edge technology is an easy way to win over our competitor but this is deceiving since this frequently gives a temporary competitive advantage and not a prolonged one (Rother, 2010).
Improvement shouldn’t be a periodic situation (Rother, 2010). The impressive statistics that corroborate the outstanding performance of Toyota are due to the continuous improvement where the productive processes are enhanced daily (Rother, 2010). Although there are clear advantages in follow a kaizen culture, it can only occur when a process is stable and standardized, since the problems are only visible when these are attained and there is a constant opportunity to learn with the improvements (Liker, 2004). Improvement is only possible when the current situation is fully understood and for this it is necessary to (1) find the problem, (2) clarify it and (3) find the cause. These are steps named as essential for problem solving by Shingo (2007). Although the Shingo’s book was only published in 2007, it was written in 1958, and since then the problem solving evolved to a more structured and detailed guideline.
Structured problem-solving process
Toyota’s philosophy defends that the financial results that the company wants to attain will be achieved if the focus is on the process itself and on the continuous improvement (Liker, 2004). This improvement can only occur when a “process is stable and standardized” for that the problem solving is required (Liker, 2004). Mann (2005) identified three categories for improvement:
• Solve an immediate problem: this task has a duration from one to five days and can be fixed using daily task assignment boards;
• More complex problem-solving, where the root cause analysis, solutions and recommendations are hard to find: here a visual project plan updated weekly with a duration from 6 to 30 days is needed; the A3 sheet, section 2.2.4, can be used;
• Long-term and complex problems: like the more complex problem-solving, the management will be made by using a visual project plan but the duration is extended from 30 to 90 days.
According to Mann (2005) the difference between a batch-and-queue system and a lean environment is the response towards the problem. In the first, the solution is to work around the problem whereas in a lean environment the problem is not hidden in creative or unconventional solutions. Instead the problem is confronted and the reason behind it is studied. For that, a structured problem-solving process is
15
necessary. The kaizen story, best known in Japan as QC story, is when the kaizen activities made by a small-group of the company’s staff and managers are recorded in a standardized way (Imai, 2005) and follows the Plan-Do-Check-Act cycle, described in section 2.2.5. The standardized eight-steps of this system are:
• Step 1: Select the theme. Here the theme is the motif of the project and may have different justifications for it, to achieve the business requirements or depend on different factors of the current circumstances;
• Step 2: Understand the current situation and define objectives. One way to understand the current state is to gather the data and the other way is to follow the five gemba principles, called the “five golden rules” which are (Imai, 2005):
1. When there is a problem, go to the gemba. The managers must swap the traditional conference room for the gemba to fully understand the problem and hence solve the problems;
2. Check the gembutsu 4 the actual material and problems (Liker, 2004). In gemba analyze
the gembutsu and recur to the simple 5Why’s tool to find the root cause;
3. Take temporary countermeasures on the spot. On the gemba-gembutsu find ways to fix the problem temporarily while the situation is analyzed. This type of countermeasures are named short-term due to the abidance of the countermeasure; it is compared to a “band aid” that will fix the situation temporarily until a long-term one is implemented (Liker & Meier, 2006);
4. Find the root cause. Around 90 percent of the problems can be solved right on the spot if the managers insist that it must be solved right away;
5. To avoid recurrence of the problem, standardize the new procedure. At this stage the SDCA cycle must be involved;
• Step 3: Analyze the collected data to identify the root causes. As mentioned on the Step 2, one way to understand the data is to collect it and on this step the data is analyzed;
• Step 4: Define countermeasures according to the data analysis. After the understanding of the problem define countermeasures to act against it. These countermeasures are named long-term and the aim is to eliminate permanently the root causes. Toyota defines the time to implement
4 Gembutsu; Japanese term that means the real product. This represents a mindset where before solving a problem is
16
the actions as 8 days, but when this time is extended, the task should be divided into smaller incremental changes that can be checked in an easier manner and more frequently (Liker & Meier, 2006);
• Step 5: Implement the countermeasures. The defined countermeasures are implemented as fast as possible;
• Step 6: Investigate the impact of the countermeasures. After the implementation its impact has to be measured;
• Step 7: Reconsider the standard to prevent recurrences. If the countermeasure had the expected impact, it will become a standard to avoid recurrences;
Step 8: Review the proceeding processes and work on the next steps. The kaizen story creates a guideline to solve the problems based on the data gathering and analysis. From the kaizen story, other approaches were developed for problem solving such as kobetsu kaizen, mostly used on Total Productive Maintenance (TPM), A3 problem-solving approach explained in section 2.2.4 (Imai, 2005).
Standardization
Imai (1986) stated that it is impossible to improve a process if it is not standardized. Considered the first stage of the continuous improvement, standardization, is the key for improvement (Liker &Meier, 2006). Being the support of the TPS house and one of the three main kaizen activities – 5S, described in section 2.2.6, standardization and muda elimination – standard work is seen as a translating tool where technological and engineering requirements are translated to the workers. They are considered the most important part of the standardization process because only when they fully understand the process they can contribute for its improvement (Imai, 2005).
To improve a process, it is crucial to standardize it. For example, if someone creatively applies changes to work whether they had any impact or not, the process only improves when this specific person is doing it. From the moment the standardization begins, the platform for improvement is created empowering teams to continuously improve the process and to become a learning organization, that is, an organization that learns with errors and transfers the knowledge (Liker & Meier, 2006; Liker, 2004).
Standardization is a way to avoid recurrences and maintain the improvement (Imai, 2005). For creating standardized processes, it is necessary to define, clarify by making it visible and use methods to achieve the best possible results. This is translated in an ongoing process of identifying problems, developing the best methods, stabilize them and define the way to use them (Liker, Jeffrey K. Meier, 2006).
17
The standardization has many advantages for the products and processes, such as quality and cost related advantages. In addition, it was noticed that when a product is standard, the claims and conflicts decrease, hence unplanned costs are diminished (Shook, 2008). The traditional manufacturing standardization process is focused on the cost, that is, to reduce to the maximum the cost per unit and create standards considering individual efforts. Although Toyota seeks the same aim of cost reduction, the main goal is the muda elimination (Liker, & Meier, 2006).
While there are many advantages of standardization, companies find it challenging to implement it. There are different myths stressed by Liker and Meier (2006), that represent barriers for companies to adopt correctly this culture of improvement. When applying standardized work, companies have the misleading thought that the documents where the work steps are defined translate the complete work made by the employee, which makes everyone able to learn how to do the work just by looking at the documents, but this can be unfavorable for both, the employee and the organization, because it seems the employees’ competency is undervalued by the organization (Liker & Meier, 2006).
Furthermore, the standardized work sheet is a document to describe the most effective process after the waste elimination. It is considered a tool with the aim to identify waste and eliminate it, illusory details and standards often are used by companies to achieve their unrealistic goal. Workers’ empowerment is sometimes confused with letting the workers define their own standard work, which makes the management reticent and worried that the worker will fail and will take advantage of this opportunity to reduce his amount of work.
This is far from the truth because the standardized work is developed by engineers after the process of waste elimination and must be followed by employees. There is a big difference between theoretical and practical standardized work; it is not enough to have the documents it is necessary to guarantee that the standard is followed. For that, it is required that others are visually attentive to assure that the standard is being followed (Liker & Meier, 2006).
Despite of its challenges, standardization is mandatory for a company to be fully lean. A3 Problem Solving Approach
The A3 problem-solving approach was created by Toyota and the A3 is the size of the paper where the problem-solving steps are described (Imai, 2005). This sheet concisely describes the problem, determines the root causes, suggests the alternative and recommended solutions and has a cost-benefit
18
analysis. This sheet must be read from the top left corner and then move to the top right column (Liker, 2004).
The A3 report on the Toyota Kata book is divided into six sections (Rother, 2010). Every section is build based on the previous one (Rother, 2010). The first section is the theme and business case, the background of the sheet the reason for why it is needed. When the theme is well-defined the easier it is to describe the current situation. The current situation is described based on the “go and see” philosophy and the better it is described the more accurate will the target situation description be and so on (Rother, 2010).
There is no right template for an A3, the common logic must be followed but the format and wording are flexible and can be adapt to the situation (Shook, 2008). The A3 sheet below, Figure 4 , shows the common logic but is only one example of how to format the A3 sheet.
Figure 4 - A3 Sheet Template (Rother, 2010)
One advantage of this type of logical process is the meetings management. Using only a sheet to explain the problem-solving steps allows to efficiently run a meeting (Liker, 2004).
There is a close relation between the A3 sheet and the PDCA cycle (Imai, 2005). The A3 sheet is a logical story of the problem solving where the deliverables of each stage of the PDCA cycle are described (Imai, 2005). On the image below, Figure 5 , it can be seen an example of how an A3 sheet template is related to the PDCA cycle.
Each phase of the PDCA cycle requires deliverables to solve the problem (Imai, 2005). The Plan phase entails the clarification of the current situation, target definition, root cause analysis and countermeasures definition (Imai, 2005). In the A3 sheet these will normally be represented on the left side of the sheet, as represented in Figure 5. After the countermeasures defined it’s time to implement them (Imai, 2005), Do phase, this is represented on the top right corner of the sheet. Check, that is, evaluate the impact of
19
the actions on the problem solving and analyze the results and process (Imai, 2005). The final stage, Act, involves the standardization and transferring of the practices (Imai, 2005). The Check and Act are represented on the lower right corner of the sheet.
Figure 5 - A3 sheet and PDCA cycle relation (LaHote, 2005)
PDCA
Plan-Do-Check-Act cycle also known as Deming cycle or Shewhart cycle was developed firstly by Shewhart in 1939 (Rother, 2010). When the way to achieve the solution for the problem is hidden in darkness it is necessary the Plan-Do-Check-Act cycle, Figure 6, to light it up and find the solution (Rother, 2010). The PDCA cycle execution is a scientific process to acquire knowledge, it’s a practical way to attain the target condition and to achieve continuous improvement (Rother, 2010).
Figure 6 - PDCA cycle. Adapted from(Imai, 2005)
The first stage of the cycle is the Plan. On this stage the target condition to be achieved, an hypothesis and prediction of what is going to be done and what is going to be attained are defined (Rother, 2010). After the target definition is necessary to define actions to achieve the pre-established target condition (Imai, 2005). The plan needs to be clear and aligned with everyone involved (Liker & Meier, 2006).This stage is finalized with defined actions to attain the target condition. Succeeding, on the Do stage these actions are implemented. It is common, in the middle of the implementation, to find opportunities for improvement. This improvement is always welcome but the actions’ impact has to be measured on the
20
next step (Liker & Meier, 2006). The next step of the cycle is Check. At this point the actions will be kept on track and the real improvement will be compared with the planned to check if the impact of the implemented actions was sufficient to attain the target condition (Imai, 2005). If the actions had the expected impact, in the Act segment the procedures will be standardized to prevent recurrences and always, with a kaizen culture in mind, new targets for improvement will be set and the PDCA cycle will be reset (Imai, 2005; Rother, 2010).
PDCA means never being satisfied with the current situation (Imai, 2005). The responsible for setting challenging targets to cultivate the PDCA continuous improvement on the workers is the company’s management (Imai, 2005). In Toyota, the management has the principle of being gentle with the workers and hard on the process, but this attitude cannot be confused with a “pat on the back” by the management to the worker but as a coach motivating the workers to achieve the goals (Rother, 2010). Following the PDCA cycle is not an easy task mostly because demands consistency and discipline, the “fire-fighting” on a company, that is only following the first two steps of the PDCA cycle Plan-Execute, has to stop. On the “fire-fighting” environment the workers have the tendency to neglect the importance of checking what happens and why (Suzaki, 1993). Although the PDCA cycle should be followed individually, when it is followed as a group its strength is massive.
Suzaki (1993) compares it to a “heartbeat”. When the “heartbeat” is strong and stable, it is possible to move faster and without complications. It can take a while to achieve this state but with work and training this can be accomplished throughout the company and when there are cooperation and dedication of everyone involved, this can lead to a common “heartbeat” for the organization (Suzaki, 1993).
5S and Visual Management
The 5S concept, also known as housekeeping, translates the caring towards the company to best sell the product. The five S’s according to Imai (2005) are:
• Seiri (Sort): the necessary and unnecessary materials are separated and the needless are removed;
• Seiton (Straighten): the necessary material is organized to facilitate the access to it;
• Seiso (Scrub/Shine): clean everything, machines and material and eliminate the dirt source. This will prevent the equipment and cables damage because of the dirt.
• Seiketzu (Systematize): according to Imai (2005) the seiketzu step is the next step and means the continually work on the seiri, seiton and seiso. Without a systematic, it’s easy for the
21
improvements to go back to the initial situation. On the other hand, Ortiz (2006) identified this as the last step, where weekly 5S audits and follow-up for the 5S improvements are created, resulting in a healthy competition between the employees and on a lifting up of the morale. • Shitzuke (Standardize): for Imai (2005), this is the last step of the 5S program and means
self-discipline, i.e., making the previous three steps a part of their daily routine and only in this step it is required the 5S performance evaluation. Contrariwise, Ortiz (2006) identified this step after seiso, and means to make the program consistent by using identification and colors.
5S and visual management are close related because both contribute for making the problems visible, facilitating the continuous improvement, and thus the kaizen culture.
Dombrowski and Zahn (2010) point out visual management as a field of activities for lean. It’s a means of communication that with the usage of simple visual tools, such as, andons 5, space borders and
information boards with performance indicators, makes the current situation and information simpler and easier for everyone to understand(Parry & Turner, 2006; Shingo, 1989). Visual management allows the comparison between what was expected and what is occurring. This comparison allows the identification of where the improvement is needed (Mann, 2005).
One tool used for visual management is the information board. There is an old battle against these boards because they are seen as old-fashion compared to existent high-tech options, but there are many advantages such as physical management.
Visual management makes all problems visible allowing its fast resolution. Frequently to solve a problem it has to go up many managerial layers to achieve the desirable top management. On the way, the detailed information gets lost, which makes the problem solving time-consuming and unreliable. Whereas with visual management a walk through the gemba is enough to see and understand the problems (Imai, 2005). Pinto (2008) refers some requisites for a visual management system such as, show how the work should be executed, the status of the process must be visible, alert when someone needs support, indicate the stock control level and support the error-proof activities.
According to Hall (1987) the aims of visual management are to:
• Make the information accessible and simpler to everyone, hence the work of the employees is facilitated;
5Andon: Japanese word for a visual production-control device that gives real time information about the production status and
22
• Increase the number of employees involved by getting the information shared with the largest possible number of workers;
• Promote team spirit since everyone has the same access to the information; • Increase the employees’ autonomy;
• Grow the culture of information sharing inside the organization.
These goals will bring many secondary benefits such as efficient meetings management, throughput time reduction and increase the employees’ motivation (McKellen, 2005).
Lean Office
Lean can be applied to indirect areas and the benefits are proven to be equally advantageous as Lean applied to the manufacturing environment (Monteiro, M. F., Pacheco, C. C., Dinis-Carvalho, J., & Paiva, 2015). On the majority of the companies the administrative tasks represent 25% of the total cost of the product (Lago, Carvalho, & Ribeiro, 2008), and as all the manufacturing processes, the indirect areas have non-value adding activities that can be eliminated. Case studies of this application are, for example, Chen & Cox (2012), Monteiro, Pacheco, Dinis-Carvalho & Paiva (2015) and (Foster, 2017).
Lareau (2003) identified, among other wastes to the indirect areas, these 10 wastes listed below: • Goal alignment waste: when the goals are poor-defined and people spends energy to pursue
and correct them to achieve and effective result;
• Assignment waste: an unnecessary or unsuitable task is done; this waste reflects the personal effort to complete it;
• Waiting waste: there is no value in waiting, for example, waiting for a signature or response; • Motion waste: needless movement that doesn’t add value;
• Processing waste: when a work isn’t executed in the best way possible;
• Control waste: the energy spent in monitoring or controlling that doesn’t contribute to improve the performance;
• Variability waste: when extra resources are used to compensate the non-achievement of the expected output results in a variability waste;
• Tampering waste: when something is changed and the consequences for that act are not studied beforehand, this results in a waste of time spent in correcting the consequences; • Strategic waste: when there is an action that has fulfil a short-term goal but does not add value
23
• Reliability waste: time spent on correcting a problem without knowing the causes.
To eliminate these wastes the Lean Thinking is applied and is named Lean Office. One of the main barriers for an organization to become a Lean organization is, and often forgot, the lean management that sustains it. For that it is necessary to follow a Lean leadership.
Lean Leadership
Frequently the problems behind an organization are, for example, inconsistency on follow-up of new responsibilities and processes, non-clear explanation of why the change of workers and the people’s questions are often ignored (Mann, 2005). Everybody needs to be involved on Kaizen but mainly top management who has to set the example (Imai, 2005). Without a strong lean management system, it is easy to come back to the old habits; a lot of lean’s implementation fail due to the lack of parallel development of lean management (Mann, 2005).
The customer defines what a value-adding activity for the product is and what is not. Following this logic, “leadership can’t never be a value-adding activity”; the shop floor worker is the one whom adds value to a product. Therefore, a leader is someone that defines the strategy, creates the team and motivates it. For this team creation, it is necessary to define clearly the roles for each member. For that, the RASIC matrix is used, that is, a matrix where for the different activities the responsibilities are allocated (Bilnoski, 2011):
• R: Responsible, this figure is responsible for the activity success; • A: Approves, the person who gives the approval of the activity;
• S: Supports, gives the support when needed for the activity execution;
• I: Is informed, this person is informed about the activity but is not involved in the decision-making;
• C: Cooperates, gives essential input for the activity.
Lean leadership can be defined as a logical system for successfully implement lean and continuously improve it (Dombrowski & Mielke, 2013).
Mann (2005) identified eight dimensions of lean leadership:
• Passion for Lean: it can be something more than mere conduct; it is something that needs seriously commitment. One of the factors that most contribute for this passion is the fierce competitiveness that push the companies to be the best they can be to thrive in the world. When