Invited Review
Models of protein and amino acid requirements for cattle
Luis Orlindo Tedeschi1, Danny Gene Fox2, Mozart Alves Fonseca1,3, Luigi Francis
Lima Cavalcanti1,4
1 Texas A&M University, College Station, TX, United States. 2 Cornell University, Ithaca, NY, United States.
3 Universidade Federal de Viçosa, Viçosa, MG, Brasil.
4 Universidade Federal de Minas Gerais, Belo Horizonte, MG, Brasil.
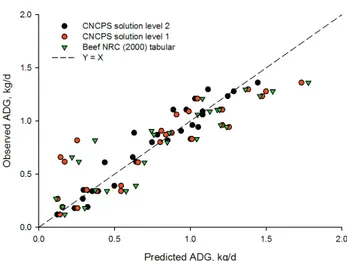
ABSTRACT - Protein supply and requirements by ruminants have been studied for more than a century. These studies led to the accumulation of lots of scientific information about digestion and metabolism of protein by ruminants as well as the characterization of the dietary protein in order to maximize animal performance. During the 1980s and 1990s, when computers became more accessible and powerful, scientists began to conceptualize and develop mathematical nutrition models, and to program them into computers to assist with ration balancing and formulation for domesticated ruminants, specifically dairy and beef cattle. The most commonly known nutrition models developed during this period were the National Research Council (NRC) in the United States, Agricultural Research Council (ARC) in the United Kingdom, Institut National de la Recherche Agronomique (INRA) in France, and the Commonwealth Scientific and Industrial Research Organization (CSIRO) in Australia. Others were derivative works from these models with different degrees of modifications in the supply or requirement calculations, and the modeling nature (e.g., static or dynamic, mechanistic, or deterministic). Circa 1990s, most models adopted the metabolizable protein (MP) system over the crude protein (CP) and digestible CP systems to estimate supply of MP and the factorial system to calculate MP required by the animal. The MP system included two portions of protein (i.e., the rumen-undegraded dietary CP — RUP — and the contributions of microbial CP — MCP) as the main sources of MP for the animal. Some models would explicitly account for the impact of dry matter intake (DMI) on the MP required for maintenance (MPm; e.g., Cornell Net Carbohydrate and Protein System — CNCPS, the Dutch system — DVE/OEB), while others would simply account for scurf, urinary, metabolic fecal, and endogenous contributions independently of DMI. All models included milk yield and its components in estimating MP required for lactation (MPl) and calf birth weight and some form of an empirical, exponential equation to compute MP for pregnancy (MPp). The MP required for growth (MPg) varied tremendously among the original models and their derivative works mainly due to the differences in computing growth pattern and the composition of the gain. The calculation of MCP differs among models; some rely on the total digestible nutrient (TDN; e.g., NRC, CNCPS level 1) intake to estimate MCP, while others use fermentable organic matter (FOM; e.g., INRA, DVE/OEB), fermentable carbohydrate (e.g., CNCPS level 2, NorFor), or metabolizable energy (ME; e.g., ARC, CSIRO, Rostock). Most models acknowledged the importance of ruminal recycled N, but not all accounted for it. Our Monte Carlo simulation indicated the prediction of most models for required MPl overlapped, confirming uniformity among models when predicting requirements for lactating animals, but a large variation in required MPg for growing animals exists.
Key Words: modeling, nutrition, prediction, ruminants, simulation © 2015 Sociedade Brasileira de Zootecnia
ISSN 1806-9290
www.sbz.org.br R. Bras. Zootec., 44(3):109-132, 2015
Received July 10, 2014 and accepted January 9, 2015. Corresponding author: luis.tedeschi@tamu.edu http://dx.doi.org/10.1590/S1806-92902015000300005
Copyright © 2015 Sociedade Brasileira de Zootecnia. This is an Open Access article distributed under the terms of the Creative Commons Attribution Non-Commercial License, which permits unrestricted non-commercial use, distribution, and reproduction in any medium, provided the original work is properly cited.
Introduction
Historically, protein requirements for cattle recommended by the National Research Council (NRC) were expressed as concentrations in the diet because most of the feeding trials were conducted by measuring animal responses to graduated concentrations in the diet. Scientific investigations regarding protein requirements
on Animal Nutrition chaired by Dr. H. H. Mitchell in 1926. In particular, it was shown that different proportions of amino acids in the protein would modify the nutritive value of the protein and thence “protein requirement ultimately can be expressed in terms of the amounts of the different indispensable amino acids, function, either singly or together, as its components” (Mitchell, 1926). In 1929, a detailed report by the Subcommittee on Animal Nutrition chaired by Dr. H. H. Mitchell provided the first guidelines for minimum protein requirements of cattle (Mitchell, 1929). In addition, because electronic calculators did not become available until the 1970s, most diets were balanced with hand calculations and the recommendations had to be simple enough to balance a diet with either trial and error or by Pearson’s square.
Prior to the 1970s, the requirement for protein was based on the summary of experiments using feeding trials in which performance and digestibilities were routinely measured. In the 1960s, metabolism trials started to take place and by the 1980’s the factorial method was used to compute protein requirements. Throughout the years, better fractionation of feed protein and requirement for protein by the different physiological stages of the animal were determined, but little advancement with individual amino acid requirements instead of protein requirement had been made. During the late 1980s and 1990s, desktop computers and software became powerful enough to calculate series of complex equations to estimate requirements. Thus, the development of nutrition models that could be used on farms became feasible when adequate data had been published to describe mathematically each of the above physiological functions, and computer technology advanced tremendously to integrate and apply them in production situations. Concurrent to the evolution of the NRC publications, other feeding systems (British: Agricultural Research Council, 1980; French: Institut National de la Recherche Agronomique, 1989; Australian: Commonwealth Scientific and Industrial Research Organization, 1990; and German: Beyer et al., 2003) were developed and some overlap existed among them regarding protein requirements.
For purposes of this paper, we define a ruminant nutrition model as an integrated set of equations and coefficients that predict animal requirements for maintenance, growth, pregnancy, and lactation, and supply of nutrients available to meet those requirements as the result of rumen fermentation, intestinal digestion, and metabolism of the feeds consumed in each unique production situation. The prediction of protein and amino acid requirements are components of this model,
because their requirements are interdependent with energy requirements and the complete model is needed to determine which is first limiting.
The objectives of this paper are (1) to describe selected feeding systems (i.e., nutrition models) that are currently being used in production situations to predict protein requirements, (2) to compare the protein requirement calculations of these models, and (3) to summarize our vision for the next generation of cattle nutrition models. Table 1 has the list of acronyms used in this paper.
Description of major feeding systems
National Research Council (NRC)
In 1945, the NRC released the “Recommended Nutrient
Allowances for Beef Cattle” (NRC, 1945), in which the requirements for protein were based on the factorial concepts previously delineated by Mitchell (1929). For maintenance, 0.6 lb of digestible protein (DP) was assigned for 1,000 lb of live body weight (BW), which is essentially 0.6 g DP/kg BW. For growth, a Missouri dataset was used and a protein digestibility of 50% was assumed to compute the DP of feeds. It was established at that time that lower percentages of protein were needed for finishing cattle as their BW increased. The first revision of the beef NRC publication was released in 1950. In addition to the 1945
Beef NRC, the “Recommended Nutrient Allowances for
Dairy Cattle” was also released in 1945. The first revision of the dairy NRC was issued in 1950 and the second revision was issued six years later in 1956 with a different
title: “Nutrient Requirements of Dairy Cattle” (NRC,
1956). The concept of digestible protein was still being adopted and the 0.6 lb/1000 lb for maintenance was still used but the amounts for other BW were calculated at the
same rate per unit of metabolic BW (BW0.75), which would
be equivalent to approximately 2.77 g DP/kg0.75 of BW (i.e.,
(0.6/2.204) × 1000/(1000/2.204)0.75). Several other releases
of the beef and dairy NRC publications were disseminated throughout the years, some with minor while others with major modifications.
The beef NRC had the second revision released in 1958 (NRC, 1958), the third revision in 1963 (NRC, 1963), and the fourth revision in 1970 (NRC, 1970). The NRC
(1970) included a new section on “Nutrient needs of rumen
Table 1 - Description of acronyms
Name Unit Description
AAT g/d AA absorbed in the small intestine
ADIN % CP, % DM, g/d Acid detergent insoluble nitrogen ADIP % CP, % DM, g/d Acid detergent insoluble protein (ADIN × 6.25)
BW kg Body weight
CBW kg Calf birth weight
CHO % DM, g/d Carbohydrate
CPr g/d Crude protein requirement
CW kg Conceptus weight
DCP %, g/d Digestible crude protein
DOM %, g/d Digestible organic matter
DP %, g/d Digestible protein
DPLS % MP, % CP, g/d Digestible protein leaving the stomach
dRUP % CP, % DM, g/d Discounted ruminally-degraded protein
dTDN % DM Discounted total digestible nutrients
DVE kg/d Intestinal digestible protein
EAA % MP, % DM, g/d Essential amino acids
EBW kg Empty body weight
EDN g/d Endogenous dermal nitrogen loss
EE % DM, g/d Ether extract
EFP g/d Endogenous fecal protein
(EFN × 6.25)
EqSBW kg Equivalent shrunk body weight
EUN g/d Endogenous urinary nitrogen
EUP g/d Endogenous urinary protein
(EUN × 6.25)
EWG kg/d Empty weight gain
FC % NDF, % DM, g/d Fiber carbohydrate
FCM kg/d Fat-corrected milk
FME % DM Fermentable metabolizable energy
FOM % DM, g/d Fermentable organic matter IDM % DM, g/d Indigestible dry matter
iNDF % NDF, % DM, g/d Indigestible neutral detergent fiber kd 1/h, %/h Fractional ruminal degradation rate
kng g/g Efficiency of use of MP for growth
(gain)
knl g/g Efficiency of use of MP for lactation
knm g/g Efficiency of use of MP for
maintenance
knp g/g Efficiency of use of MP for conceptus
(pregnancy)
knr g/g Efficiency of use of MP for body
reserves
kp 1/h, %/h Fractional ruminal passage rate
L Level of feeding as multiple of
maintenance ME required
MCP g/d Microbial crude protein
MEI Mcal/d, MJ/d Metabolizable energy intake
MP g/d Metabolizable protein
MPg g/d Metabolizable protein required for
growth
MPl g/d Metabolizable protein required for
lactation
MPm g/d Metabolizable protein required for
maintenance
MPp g/d Metabolizable protein required for
pregnancy (conceptus)
Name Unit Description
MPr g/d Metabolizable protein required for
body reserves
MTP g/d Microbial true protein
MY kg/d Milk yield
NAAN % CP, % DM, g/d Non-amino acid nitrogen NAN % CP, % DM, g/d Non-ammonia nitrogen NDF % DM, g/d Neutral detergent fiber
NDIN % CP, % DM, g/d Neutral detergent insoluble nitrogen NDIP % CP, % DM, g/d Neutral detergent insoluble protein (NDIN × 6.25)
NE Mcal/d Net energy
NEl Mcal/d, MJ/d Net energy required for lactation NFC % CHO, % DM, g/d Non-fiber carbohydrate (CHO)
NP g/d Net protein
NPb g/d Net protein required for basal
endogenous
NPd g/d Net protein required for scurf and hair growth
NPg g/d Net protein required for growth
NPl g/d Net protein required for lactation
NPm g/d Net protein required for maintenance
NPN % CP, % DM, g/d Non-protein nitrogen
NPp g/d Net protein required for pregnancy
(conceptus)
NPr g/d Net protein required for body reserves
OM % DM, g/d Organic matter
OEB kg/d Rumen-degraded protein balance
PBV g/d Protein balance in the rumen
PDI % CP, % DM, g/d Digestible protein in the intestine PDIA % CP, % DM, g/d Dietary undegraded protein PDIE % CP, % DM, g/d PDI when energy limits microbial growth
PDIM % CP, % DM, g/d Microbial protein
PDIME % CP, % DM, g/d PDIM when energy is limiting PDIMN % CP, % DM, g/d PDIM when ruminal degradable nitrogen is limiting
PDIN % CP, % DM, g/d PDI when nitrogen limits microbial growth
peNDF % NDF, % DM Physically effective neutral detergent fiber
PROT % DM, g/d Protein
RDN % CP, % DM, g/d Rumen-degraded nitrogen RDP % CP, % DM, g/d Rumen-degraded protein
RE Mcal/d, MJ/d Retained energy
RN g/d Retained nitrogen
RPM % MP, % DM, g/d Rumen-protected methionine RUP % CP, % DM, g/d Rumen-undegraded protein
SWG kg/d Shrunk weight gain
TDOM % DM, g/d Total digestible organic matter TMN g/d Net AA supplied by ruminal microbes
TNr g/d Total nitrogen requirement
TP % CP, % DM, g/d True protein
TPt g/d Tissue protein
UDN % CP, % DM, g/d Undegraded dietary nitrogen UDP % CP, % DM, g/d Undegraded dietary protein (UDN × 6.25)
Likewise, the dairy NRC had its third revision released in 1966 (NRC, 1966), the fourth revision in 1971 (NRC, 1971), and the fifth revision in 1978 (NRC, 1978). The NRC (1978) contained major modifications to the calculation of protein requirements as proposed by Swanson (1977) and discussions about unavailable feed protein and feed protein solubility. The sixth revision was released in 1989 (NRC, 1989) and included the concept of rumen-undegraded protein (RUP) and microbial CP (MCP) being the main sources of metabolizable protein (MP).
Because of limitations in accuracy of inputs available and variation accounted for, recommendations were in terms of feeding allowances, which included substantial amounts added for safety factor. The development of net energy (NE) systems for beef (NRC, 1970, 1984) and dairy (NRC, 1971, 1989) cattle and mathematically describing rumen fermentation (NRC, 1985, 1989, 1996) provided the equations needed to begin predicting requirements for each primary physiological function (maintenance, growth, pregnancy, lactation, rumen fermentation, intestinal digestion and absorption, and metabolism).
The seventh and most recent revision of the beef NRC was released in 1996 (NRC, 1996) and updated in 2000 (NRC, 2000). These versions of the beef NRC included more complex and mechanistic nutritional models. Similarly, the seventh and most recent revision of the dairy NRC was released in 2001 (NRC, 2001). This version included the concept of degradation kinetics for feed protein to compute readily, potentially, and unavailable protein fractions. In the last two decades, the NRC (1996, 2000, 2001) developed nutrition models for cattle to predict energy, protein and amino acid requirements to support precision feeding, which became a priority due to the need to reduce cost/ unit of production while reducing the excretion of excess nutrients, including N, P, and greenhouse gasses to meet government regulations.
The beef NRC. The NRC (2000) has two different approaches to compute MP supply, depending on the level of solution used. The solution level 1 assumes that MP is comprised of 80% of the undegraded intake protein (UIP, also known as RUP) and 64% of MCP. The UIP is a user input value while the MCP is computed as 13% of TDN and corrected for the effect of rumen pH, using physically effective neutral detergent fiber (peNDF) as described by Russell et al. (1992). The solution level 2 uses the Cornell Net Carbohydrate and Protein System (CNCPS) as described by Fox et al. (1992), Sniffen et al. (1992), Russell et al. (1992), and O’Connor et al. (1993).
The dairy NRC. The MP requirement for lactation (MPl) is computed from net protein (NP) in the milk with
67% efficiency (Eq. [3] and [7]). However, the efficiency of use of MP to NP may not be constant for ruminal N deficient diets (Ruiz et al., 2002) and may be as high as 75% (NRC, 1985). Lapierre et al. (2005) analyzed 14 studies (33 treatment means) and reported an average apparent N digestibility of 65%, which is the efficiency adopted by the beef NRC (2000) (Eq. [7]). The NRC (2001) recommended the use of essential AA (EAA) requirement for methionine and lysine as 2.2 to 2.4% and 6.6 to 7.2% of MP, respectively, with an optimum lysine:methionine ratio of 3 to further fine tune diet formulation for lactating dairy cows. The NRC (2001) also adopted a variable
rumen-degradable protein (RDP)/RUP based on the kinetics of in
situ fermentation of protein as described by Ørskov and McDonald (1979) (Eq. [1] and [2]):
RDP = a + b × (kd/(kd + kp)), [1] RUP = b × (kp/(kd + kp)) + c, [2] in which a is the soluble protein; b is potentially RDP; and
c is indigestible protein.
Although this kinetic method provides a more mechanistic modeling approach, it also contains inaccuracies. The soluble protein fraction (a) is comprised of fine particles, intact protein, and non-protein N — NPN, which contains peptides, and it is not completely degraded in the rumen (Gierus et al., 2005) and between 7 and 13% of the non-ammonia N (NAN) escapes the rumen (Aufrère et al., 2002), suggesting a possible overprediction of RDP. Interestingly, Broderick et al. (2010) meta-analyzed data of 32 studies and reported that the NRC (2001) underpredicted RDP (i.e., overpredicted RUP) by 22% than observed omasal values. This discrepancy may be due to incorrect prediction of fractional passage rate (kp) or microbial protein, which is assumed to be 130 g MCP per kg of TDN discounted for that not degraded in the rumen. Additionally, the NRC (2001) committee recommended estimating TDN by using an empirical equation similar to that proposed by Weiss et al. (1992). These two approaches entail a calculation disconnection between energy and protein in the rumen (i.e., predicted RDP and RUP with Eq. [1] and [2] are not explicitly used in the prediction of TDN), posing another level of difficulty in formulating and optimizing rations.
Requirement for maintenance. The dairy NRC (2001) uses the factorial approach by including equations for scurf, urinary, metabolic fecal CP, and endogenous requirements in predicting the MP required for maintenance (MPm), whereas the beef NRC (2000) uses a much simpler approach as shown in Eq. [3]:
in which CW is conceptus weight, kg; MPBact is MP supplied by microbial protein, g/d; and MPEndo is endogenous MP (i.e., 0.4×EndoCP).
Requirement for growth. The dairy NRC (2001) uses the equations developed by the beef NRC (2000) to predict growth requirements for NP (NPg). These equations predict the protein required for growth from equivalent shrunk BW (EqSBW), retained energy (RE), and shrunk weight gain (SWG). The EqSBW uses a scaling approach to determine the BW of the actual animal that is equivalent in composition to the medium-frame size steer used to develop the California NE system (Lofgreen and Garrett, 1968). The MPg is computed based on NPg and an efficiency of use that depends on EqSBW as shown in Eq. [4] and [5]:
NPg = SWG × (268 − 29.4 × RE/SWG), [4]
[5]
Requirement for lactation. The dairy NRC (2001) and
beef NRC (2000) compute the required MPl using the milk yield (MY) and its content of true protein (TP), but with a different efficiency of conversion of MP to NP for lactation (NPl). The beef NRC (2000) predicts MY based on estimated peak milk production, while the dairy NRC (2001) requires an input.
NPl = MY × Milk TP, [6]
[7]
Requirement for pregnancy. The MP required for pregnancy (MPp, g/d) is computed differently between the dairy NRC (2001) and beef NRC (2000), as shown in Eq. [8]. Remarkably, the dairy NRC (2001) assumes an efficiency with which MP is used for pregnancy of 33%, whereas the beef NRC (2000) uses 65%. Both systems adjust for calf birth weight (CBW).
[8]
in which t is days pregnant (gestating).
Cornell Net Carbohydrate and Protein System (CNCPS)
The most recent complete CNCPS version published is that described by Fox et al. (2003) and Fox et al. (2004), which includes both beef and dairy cattle with two levels of solution (L1 and L2). Modifications have been made to L2 for CPM Dairy as described by Tedeschi et al. (2008), CNCPS version 6.0 as described by Tylutki et al.
(2008), and CNCPS v. 6.1 as described by Van Amburgh et al. (2010), and to both levels for the Large Ruminant Nutrition System (LRNS) as described by Tedeschi and Fox at http://nutritionmodels.tamu.edu/lrns.html. The original description of the mechanistic ruminal fermentation submodel of the CNCPS was provided by Russell et al. (1992), Sniffen et al. (1992), and O’Connor et al. (1993), and the original requirements’ submodels were described by Fox et al. (1992). Additional modifications and submodels were developed subsequently (Tylutki et al., 1994; Tedeschi et al., 2000a; Tedeschi et al., 2000c; Tedeschi et al., 2001; Tedeschi et al., 2002a; Tedeschi et al., 2002b; Tedeschi et al., 2008). The CPM Dairy was developed for dairy cattle based on the engine of the CNCPS version 5 with additional features as published by Boston et al. (2000) and Tedeschi et al. (2008). A historical perspective on the development of the CPM Dairy was given by Chalupa and Boston (2003). Similar to the beef NRC (2000), the CNCPS version 5 has two levels of solution. Solution level 1 uses empirical equations to compute MP (Eq. [9] and [10]), in which MCP is computed assuming 13% of discounted TDN (dTDN), 64% availability, and dietary peNDF and RUP is discounted for level of intake above maintenance energy requirement (dRUP) and 80% of availability. The CNCPS uses the neutral detergent fiber (NDF) content and feed particle size to predict ruminal pH and its impact on microbial growth.
MP = dTDN × DMI × 0.13 × 0.64 × peNDF f + dRUP × CP × DMI × 0.8, [9]
version 6.1 (Van Amburgh et al., 2010), peptides are shifted from the NPN to the soluble protein fraction that degrades with a reduced kd, and the liquid kp is used to predict the proportion of this fraction that passes undegraded from the rumen, as documented by Lanzas et al. (2008).
Requirement for maintenance. The CNCPS uses the factorial approach to compute MPm: urinary protein (term 1 in Eq. [11]), scurf protein (term 2 in Eq. [11]), and metabolic fecal protein (term 3 in Eq. [11]), which is assumed to be 9% of indigestible dry matter (IDM). The IDM can be computed as one minus total tract digestibility of the DM, multiplied by DMI to obtain IDM as g/d. Like the NRC (2001), the efficiency of MPm to NP for maintenance (NPm) is assumed to be 67%.
MPm = (2.75 × SBW0.5)/0.67 + (0.20 × SBW0.6)/0.67 + 0.09 × IDM. [11]
Requirement for growth. The NPg is computed as shown in Eq. [4] and MP for growth (MPg) with the beef NRC (2001) (Eq. [5]).
Requirement for lactation. It is identical to the dairy NRC (2001) and beef NRC (2000).
Requirement for pregnancy. It is identical to the dairy NRC (2001) for dairy cattle, but the CNCPS uses an efficiency of use of MPp of 50% for beef cattle, whereas in the beef NRC (2000) it is 65% in computing NE for pregnancy (NPp).
Detailed description of the AA submodel was given by Fox and Tedeschi (2003). One of the key challenges in the AA submodel is the determination of efficiency of use of specific AA. In the CNCPS, each AA has a fixed efficiency of use of MP depending on the physiological stage of the animal (i.e., maintenance, pregnancy, or lactation), except for growth, which uses a common efficiency of use.
Agricultural Research Council (ARC)
As with other national systems, early ARC committees utilized digestible CP (i.e., DP) to compute their protein requirement recommendations, which had limitations when NPN sources were used in protein supplements. The protein equivalent method was proposed to correct the overestimation of the NPN value by assuming that NPN was fully digested but had only half of the value of DP. However, after the 1960s, the DP method was again being used because the protein equivalent method was underestimating the value of NPN in some feedstuffs such as silages (ARC, 1980). The specific problem with silages was determining the best source of supplemental protein in the diet and other factors such as energy supply, interaction among feeds, and processing levels of feedstuffs, among many others. The
next step to overcome most of the problems found with the DP method surfaced in 1965 when the available protein methodology based on the factorial system was used to express the protein requirements for ruminants. In that way, the CP that would meet the nutritional requirements for a given situation would have to have a biological value which would meet the requirements for tissue retention (body and conceptus) or milk production and maintenance (endogenous loss in urine, scurf, and hair). The approach allowed independence of the value in any particular feed (ARC, 1980), breed or rates of productivity.
The newly proposed protein methodology (i.e., factorial system) also had its limitations that were especially related to the practical separation of the N excreted in the feces into undegraded feed and metabolic N sources. The metabolic sources vary with the extent and type of AA from RUP from the diet. Consequently, a new approach based on the total amount and individual characterization of AA absorbed from the small intestine was proposed (ARC, 1980). Part of the AA required for the animal would be met by the microbial protein that was synthesized in the rumen and the rest of the requirements would be provided by the protein that had escaped the ruminal fermentation (i.e., RUP). Thus, the concept of MP was born. It is defined as the amount of protein digested (or AA absorbed) in the post-ruminal portion of the alimentary tract and it has been implemented since the 1970s.
The source of those AA can be variable because not all N required by the tissue will be necessarily supplied by the rumen microbial amino acid N. If the amino acid N available for the tissue is greater than the tissue requirements then the tissue requirements are the rumen-degraded N needed by rumen microorganisms. If the N provided by the rumen microorganisms does not suffice the total tissue requirements then extra N has to be provided as rumen-undegraded protein.
The ARC (1980) computes the N transactions into four categories: N needed by the ruminal microbes, amino acid N supplied by ruminal microbes, N from undegraded feedstuffs, and total N required by the animal.
apparent DOM was 0.65; (c) the microbial N yield was 30 g/kg of DOM; and (d) the efficiency to convert degraded N into microbial N was 100%.
RDN = MEI × 0.06418 × 0.65 × 30 × 1 = 1.25 × MEI. [12]
Available ruminal microbe amino acid N. The amount of ruminal microbe amino acid N available to the ruminant (TMN) is based on RDN requirement and a coefficient (Eq. [13]) that assumed the (a) proportion of amino acid N in ruminal microbial N is 0.80; (b) the apparent absorbability of microbial amino acid N in the small intestine is 0.70; and (c) the efficiency of utilization of absorbed microbial amino acid N is 0.75.
TMN = RDN × 0.80 × 0.70 × 0.75 = 0.42 × RDN = 0.53 × MEI. [13]
Requirement for undegraded dietary N. The undegraded dietary N (UDN) is computed based on the tissue N requirement and the amount of TMN supplied, assuming an efficiency of 0.525 (0.7 × 0.75) as shown in Eq. [14]. If the tissue N required is less than TMN, then UDN is zero because no extra N is required to fulfill the animal’s requirement of N. The total N requirement by the animal is the sum of RDN and UDN.
[14] in which TN is total N required by the animal (N retention + N required for lactation + N required for maintenance), in g/d.
Requirement for pre-ruminant calves. The pre-ruminant tissue requirement for protein (CPr) is computed assuming the N retention (RN, g/d), endogenous urinary N (EUN, g/d), dermal N losses (EDN), the apparent N digestibility (0.92 for milk protein, lower value for non-milk protein sources), and efficiency of use of absorbed N (0.80 for milk protein, possibly lower value for some non-milk protein sources), as shown in Eq. [15].
CPr = 6.25 × RN + EUN + EDN /(0.92 × 0.80). [15]
Requirement for growth. The tissue-required protein or total protein requirement (maintenance + growth) is the sum of EUN and EDN, and the net protein required for ADG (NPg). EUN = 6.25 × (5.9206 log(BW) − 6.76), [16]
EDN = 6.25 × (0.018 BW0.75), [17]
NPg = ADG × (168.07 − 0.16869 × BW + 0.0001633 × BW2)
× (1.12 − 0.1223 × ADG). [18]
A 10% increase is recommended for bulls and large (late maturity) breeds, and a 10% discount is recommended for heifers and small (early maturity) breeds. The conversion
of empty BW (EBW) to live BW is BW = 1.09 × (EBW + a),
in which a is the weight of the gut fill content (4 for high
concentrate diets, 14 for green forages, pelleted dry forages and many mixed diets, and 25 for long dried roughages).
Requirements for lactation and pregnancy. The requirement for lactation and pregnancy include EUN (Eq. [16]), EDN (Eq. [17]), protein secreted in the milk (Eq. [19]) for lactating animals, and gravid uterus for pregnant animals (Eq. [20] and [21]), assuming a calf birth weight of 40 kg.
NPl = MY × CP in milk, [19] NPp (g/d) = TPt × 0.03437 × e−0.00262×t, [20] log TPt = 3.707 − 5.698 × e−0.00262×t, [21]
in which t is the number of days from conception.
Agriculture and Food Research Council (AFRC)
The AFRC (1993) is a revision of the ARC (1965, 1980) that was originally released as a series of publications by the AFRC committee (AFRC, 1987a, b, 1988, 1990, 1991, 1992). Due to its factorial nature, the total MP requirements are computed as the sum of each relevant metabolic function.
Requirement for maintenance. The required MPm (Eq. [22]) is the sum of the endogenous N, scurf, and hair losses. The efficiency of use is 100% (NPm = MPm).
MPm = 2.30 × BW0.75. [22]
Requirement for lactation. The required MPl (Eq. [23]) are based on the composition of the milk, and the efficiency of use of absorbed AA for milk production is 68%.
MPl = (1/0.68) × milk TP = 1.471 × milk TP. [23] For dairy and beef cows in the UK, the committee considered a 95% of TP content in milk with mean density of 1.03 kg/L; therefore, MPl can be computed as shown in Eq. [24].
MPl = ((1.41 × CP × 10 × 0.95)/1.03) = 13.57 × CP. [24]
Requirement for growth. The MP and NP required for growth are given by the content of protein in the ADG (Eq. [18]).
The C6 coefficient in Eq. [25] is an adjustment for a medium-size steer so the actual values have to be corrected for maturity (breed) size and gender. A 10% increase is recommended for bulls and large (late maturity) breeds, and a 10% discount is also recommended for heifers and small (early maturity) breeds. The MPg is computed from NPg assuming an efficiency of 59% (1/0.59 = 1.695), as shown in Eq. [25].
MPg = C6 ×(168.07 − 0.16869 × BW + 0.0001633 × BW2)
× (1.12 − 0.1223 × ADG) ×1.695 × ADG. [25]
and MPp, respectively) are computed based on the daily protein retention in the gravid uterus tissue, assuming an efficiency of use of 85% (Eq. [26] to [28]). NPp = TPt × 34.37 × e−0.00262×t, [26]
log TPt = 3.707 − 5.698 × e−0.00262×t, [27]
MPp = 1.01 × Wc × (TPt × e−0.00262×t), [28]
in which Wc represents conceptus weight, kg; and t is days.
Requirement for body reserves change. For lactating, growing cows, the AFRC (1993) assumed an efficiency of 59% for tissue deposition and 100% for tissue mobilization for the BW change requirements for maintenance and gain, respectively, as shown in Eq. [29].
[29]
Feed into Milk (FiM)
The FiM (Thomas, 2004) has been reported as the most used system in the UK because the recommendations from AFRC (1993) were no longer answering the urges of industry and producers. The main concerns were the prediction of DMI, energy standards for cows especially at high levels of production, and the inaccuracy of the MP prediction. The FiM shares the main core calculation of the AFRC (1993) for MP requirements for dairy cows, but with a modified maintenance requirement.
MPm = 4.1 × BW0.75 + 0.3 × BW0.6 + 30 × DMI − 0.5 × (DMTP/0.8 − DMTP)
+ 2.34 × DMI, [30]
in which DMTP is the digestible MTP.
In the AFRC (1993), FME has been reported unsatisfactory to estimate the energy supply to the ruminal microbes because it is an imprecise estimate of the ME and includes undegraded carbohydrates and proteins that do not provide available energy in the rumen. The FiM adopted adenosine triphosphate yield and the effective degradable N. For each feed in the ration, the first limiting potential MCP calculated from either adenosine triphosphate yield or effective degradable N is used.
Commonwealth Scientific and Industrial Research Organization (CSIRO)
The CSIRO (1990, 2007) also uses the factorial approach to predict requirements and supply of N by ruminants, and it is a modification of the ARC (1965, 1980) and AFRC (1993) for Australian conditions. The conversion factor adopted to convert N to CP was 6.25 except for the milk protein, which was 6.38. Since 1990, the CSIRO has divided the intake of protein in two fractions: RDP and
undegraded dietary protein (UDP). The RDP is the sum of all N in the rumen/reticulum that can be assimilated by microbes, including dietary protein, recycling urea (through saliva and rumen wall diffusion, which is assumed to offset intermittent inadequacies of RDP for short periods) and sloughed cell from the rumen/reticulum epithelium; it is composed mainly of peptides, amino acids, and ammonia. Differently from other systems, the CSIRO (2007) did not evaluate the kinetics of these components separately. Thus, the entire N in the RDP is the source of N for microbial protein synthesis, which they define as MCP. The UDP contains all N sources from the diet that were not available for microorganism assimilation and eventually escaped the rumen. This fraction is estimated by using models of degradation and auxiliary analysis of neutral and acid detergent insoluble proteins, as shown in Eq. [31] to [33].
dg = a + b × (1 − exp(−c × t)), [31]
Edg = a + b × c/(c + kp), [32]
Udg = b × kp/(c + kp) + d, [33] in which dg is degradability; a is the soluble component of the CP, which disappears rapidly; a + b is the total
amount of potentially degradable CP in the feed; c is the
rate of disappearance, per h, of the CP in the component
b; Edg is effective degradation; Udg is the fraction of
protein escaping undegraded from the rumen; and d is
the fraction of protein that is completely indigestible. Alternatively, it can be estimated using the feed composition (Eq. [34]). The UDP added to MCP multiplied by their small intestinal digestibility coefficients represent the truly digestible protein leaving the rumen (DPLS; Eq. [36]).
Edg = (0.9 − 2.4 × k) × (CP − 0.059 × NDF)/CP, [34]
UDP = ADIP + (NDIP − ADIP) × (kp/(kp + c)), [35]
DPLS = a × (0.85 × b × FOM) + c × (UDP), [36] in which a, b, and c are digestibility coefficients.
acids from silage fermentation) that are not available to the microbes in the rumen or provide little energy to them. MCP = FME × (7 + 6 × (1 − exp(−0.35 × L))). [37]
For fresh temperate forages, Eq. [37] is corrected by an expression that depends on the latitude and day of the year to account for the effects of location and season (Eq. [38]). For tropical forages, there is no correction for season effects, but the intercept of Eq. [37] is reduced by one unity due to the lower efficiency of synthesis for these feeds when compared with temperate forages.
MCP = FME × (7 + 6 × (1 − exp(−0.35 × L))) × (1.0 + 0.1 × ( λ × sin(0.0172 × t)/40)), [38] MCP = FME × (6 + 6 × (1 − exp(−0.35 × L))). [39]
in which λ is the latitude (negative for the south hemisphere) and t is the day of the year.
Requirement for maintenance. The maintenance requirements are the sum of protein lost through excreta and skin. The CSIRO (1990, 2007) adopted different equations to estimate the endogenous protein losses. The main reason is that the equation used by the ARC (1980) to predict total endogenous N loss based on BW gives unrealistic results when applied to common scenarios in Australia with cattle surviving on poor-quality pastures. Even with a diet with much better quality than those, the animal would have a protein deficiency status. However, the CSIRO (1990, 2007) adopted the same equation presented by the ARC (1980) to predict endogenous urinary protein (EUP; Eq. [40]), and recommended a reduction of 20% for B. indicus cattle.
EUP = 16.1 × ln (BW) − 42.2). [40] The estimated EUP obtained with Eq. [40] is lower than that obtained with the CNCPS (Fox et al., 2004). The experimental data used to develop the equation used by ARC (1980) was collected from animals receiving diets with little or no protein, which probably underestimates the excretion on higher N diets, and may explain the difference when compared with the CNCPS. The endogenous fecal loss (EFP; Eq. [41]) is computed using the work of Hulme et al. (1986):
EFP = 15.2 × DMI. [41] Based on experimental confirmation of the protein requirements for dairy cattle provided by the NRC (1978), when it allowed an EFP of 15.2 g/kg of DMI, the estimates become similar to other studies that evaluated the EFP. The dermal loss (ED) is computed in the same way as ARC (1980).
Requirement for pregnancy. The requirement for pregnancy follows the ARC (1980).
Requirement for growth. The protein gained or lost (g/kg) is a function of breed, relative weight (BW/standard
reference weight, with a maximum of 1), and level of nutrition as a multiple of ME required for maintenance (Eq. [42]). In addition, the protein gain or loss can be assessed based on the variation in the BCS (Eq. [43]).
[42] CPg = EWG × (d − f × BCS), [43] in which b is 120 for Charolais, Simmental, Chianina, Maine Anjou, Limousin, and Blonde d’Aquitaine, and 140 for all other beef breeds; Z is the proportion of BW relative to the standard body weight, with a maximum value of 1;
d is 144 for Charolais, Simmental, Chianina, Maine Anjou,
Limousin, and Blonde d’Aquitaine, 124 for all other beef breeds and 119 for dairy cattle; R is an adjustment for rate of gain or loss and is equal to the MEI divided by the MEm
requirement minus 2; and f is 17.3 for beef cattle and 10.4
for dairy cattle. The body condition score (BCS) varies from 0 to 5 for beef and 1 to 8 for dairy cattle, in which 0 and 1 are emaciated animals and 5 and 8 are very fat animals, respectively.
Requirement for lactation. The requirement for lactation follows the ARC (1980).
Requirement for pre-ruminant calves. Because of the absence of significant microbial activity, the requirements are based on the protein digestibility of the feed (for milk, 92%) and a constant efficiency of use of 0.80. The other requirements such as gain and maintenance are equal to ruminants except for the fecal endogenous losses that adopted the value of 12 g/kg of DMI.
Institut National de la Recherche Agronomique (INRA)
degradability is estimated by the in situ and in sacco
techniques and is essential for the calculation of PDIA and PDIMN, the latter being one multiplied by 0.576 to correct for digestibility and N availability derived from ruminal microbes to the intestine.
PDIE = PDIA + PDIME, [44]
PDIN = PDIA + PDIMN, [45]
PDIA = CP × [1.11 × (1 − a)] × b, [46]
PDIM = CP × [1.11 × (1 − a)] × 0.9 × 0.8 × 0.8, [47]
in which a is protein degradability and b is intestinal digestibility of AA. The PDIA is also adjusted for the digestibility of protein in the intestine, which is estimated by the protein not digested in the lower digestive tract. This digestibility is determined using the mobile nylon bags technique and the digestibility of the organic matter (OM). Otherwise, the PDIME is estimated through the fermentable OM (FOM), which is the result of the subtraction of ether extract (EE), RUP, and silage acids from the total DOM (TDOM). Then, PDIME is calculated as shown in Eq. [48]. PDIME = FOM × 0.145 × 0.8 × 0.8, [48]
According to the INRA system, a diet meets the protein requirement when the dietary PDIE and PDIN are provided in equal amounts, meaning that the rumen microbe requirements for energy and N had been met. This condition is almost impossible to be achieved in practical situations; therefore, it is accepted that there will be some difference between these fractions, since both exceed the required PDI. This accepted difference varies with the animal category. For example, a dairy cow with MY greater than 25 but less than 35 kg is allowed a difference of –4 while a growing beef steer older than 2 years of age is allowed a –18 in favor of PDIE. The dairy cattle requirements for MP, as in others systems, is computed using the factorial approach in which the total requirement of protein for dairy cattle is the sum of the requirements for maintenance, growth (primiparous or young animals), lactation, and pregnancy. Requirement for maintenance. The PDI requirement for maintenance for dairy cattle is computed as 3.25 g/BW0.75, which does not include physical activity. For primiparous or females younger than 40 months, the daily maintenance requirements is increased by 422 g of PDI minus 10.4 times the age in months, as shown in Eq. [49]: BesPDIc = 422 − (10.4 × Age), [49]
in which BesPDIc is the requirement for maintenance. Requirement for lactation. The PDI requirements for lactation were based on the MY (kg), milk TP content (g), and the fixed efficiency of use of 64% (Eq. [50]). BesPDIPL= (MY × TP)/0.64, [50]
in which BesPDIPL is the requirement for milk production. Requirement for pregnancy. The PDI requirements for early pregnancy are low but increase rapidly in the last three months of gestation. For pregnant cows with low MY or during the dry period, the pregnancy requirement is easily met by rations usually fed. The requirement follows an exponential function of the week of pregnancy and CBW (Eq. [51]). BesPDIG= 0.07 × CBM × e(0.11×WIP), [51]
in which BesPDIG is the requirements for pregnancy; and
WIP is week of pregnancy.
Requirement for amino acids. The high demand for protein for lactation can make the EAA the first limiting nutrient for milk synthesis. This can be offset by the supplementation of EAA in the fixed proportions in relation to the PDIE required as follows: methionine, 2.5%; lysine, 7.3%; leucine, 8.9%; and histidine, 3.0 to 3.5% (Rulquin et al., 1993; Rulquin and Vérité, 1993; Rulquin et al., 1995). Based on this information, the optimum requirement of duodenal flow of lysine to duodenal flow of methionine ratio for dairy cows is 3.0 (Rulquin et al., 1993).
The beef cattle requirements for MP are based on specific parameters of the Gompertz growth curve that was adjusted to 16 different genotypes as described by INRA (1989). These parameters were obtained by fitting the Gompertz non-linear function to the BW and body composition of reference animals from different genotypes. The protein composition for animals at different BW is estimated with the Gompertz parameters, allometric relations between body composition, EBW, and ADG. It is also used to predict the composition of the gain for growing animals. Therefore, the requirements for beef cattle are the sum of maintenance protein requirements (3.25 g/kg0.75) and the protein content
of the gain divided by an efficiency of conversion of PDI. This coefficient is affected by the sex, age, and genotype, as presented by Geay et al. (1987).
The Dutch System (DVE/OEB)
DVE = DVBE + DVME − DVMFE, [52] in which DVBE is undegraded feed CP digested in the small intestine; DVME is rumen synthesized MCP digested in the small intestine; and DVMFE is endogenous protein losses during the digestion.
Different from other models, the endogenous N losses are discounted from the feed instead of being included in the maintenance requirement, and they are estimated from the total amount of IDM multiplied by a factor of 0.075, which is the result of a loss of 50 g of protein/kg of IDM with an efficiency of re-synthesis of 0.67. The IDM is estimated from the subtraction of DMI minus DOM and digestible inorganic matter. The impact of IDM on endogenous N loses is similar to the approach used by the CNCPS.
The degradation of the feed protein is estimated with the nylon bag technique and assuming a kp of 4.5 %/h for roughages and 6 %/h for concentrates. The digestibility of RUP is estimated with the mobile nylon bag technique and for feeds lacking experimental data, it is calculated using empirical equations. In the Dutch system, the percentage of AA in this fraction is not considered. Like the French system, the microbial growth is estimated from the FOM. However, a correction (0.75 plus 10% of the total starch) is allowed for undegraded starch estimated by the nylon bag technique. For silage products of fermentation (volatile fatty acids), a 50% discount over the total amount due to the inefficiency of energy utilization for microbial growth was adopted. For microbial protein synthesis, the value of 150 g of microbial protein/kg of FOM, which is slightly greater than the value used by the French system (145 g/kg of FOM), was adopted. The reasoning is because the French system does not correct for undegradable starch and due to the greater level of DMI by high-producing cows that improves the microbial synthesis compared to the low DMI of animals during the trials used to derive the French value. For the N in this fraction, it was assumed that 75% are AA and a true digestibility of 85%, resulting in a total digestible MCP of 95.625 g of TP/kg of FOM. Like the French system, it is possible to check for balance between energy and protein availability in the rumen in order to improve the microbial synthesis. The goal is to have a value closer to zero (or slightly greater than zero) for the difference between potential microbial protein synthesis based on the available RDP and the potential MCP yield from the FOM.
Requirement for maintenance. Because the endogenous fecal losses are assigned to the feed, the maintenance cost (DVEM) is the losses of N through the urine and skin, divided
by a efficiency of use of 0.67 (Eq. [53]).
DVEM= (2.75 × BW0.75 + 0.2 × BW0.6)/0.67. [53]
Requirement for lactation. The Dutch system is based on production trials performed under Dutch conditions only and it has variable efficiency of milk protein synthesis whereas other systems use a fixed coefficient. This efficiency depends on the diet energy/protein and level of production. Therefore, the protein requirement for milk synthesis is assessed by a quadratic regression with the milk protein production (g/d) as the independent variable (Eq. [54]).
DVEP = 1.396 × GRP + 0.000195 × GRP2, [54]
in which GRP is milk protein production, in g/d.
Requirements for growth and tissue mobilization. For growth and mobilization of tissue, the Dutch system adopted the efficiencies of 50% (growth and replenish body protein) and 80% for protein mobilized for milk synthesis from AA when a negative energy balance occurs. It is also assumed that from the energy in the body reserves, 10% is derived from protein, which contains 24 MJ/kg. This means that an animal with a negative energy balance of 6.9 MJ/d has a loss of 29 g of protein in products such as milk and the animal has to mobilize 36 g of body protein, compared with 45 g if protein were derived from DVE. On the other hand, for a positive energy balance of 6.9 MJ, the restoration process would require 57 g of protein.
Requirement for pregnancy. The pregnancy requirement for protein is based on the NRC (1985) with a double exponential equation that used days pregnant (ranging from 141 to 281) as the independent variable and a fixed efficiency of protein use of 50% (Eq. [55]).
[55] in which DP is days after conception, from 141 to 281.
A Brazilian System (BR-Corte)
The first version of a Brazilian system for nutritional
requirements of zebu cattle (Bos indicus and crosses) was
Animal) study funded by the National Council of Scientific Development and Technology (CNPq). The microbial N requirement is assumed to be 120 g MCP/kg of TDN and the TDN is computed based on Detmann et al. (2008). The RDP requirement is assessed by multiplying the MCP by 1.11 and the required UDP (g/d) is computed as shown in Eq. [56]. The total CP requirement is the sum of RDP and UDP. UDP = [(MP − (MCP × 0.64)]/0.80. [56]
Requirement for maintenance. The original MPm calculation (Eq. [57]) was evaluated with an updated dataset using a meta-analytical regression.
MPm = 4 × BW0.75. [57]
Requirement for growth. The MPg considers the gender and gain composition. The NPg (Eq. [58]) is computed from empty weight gain (EWG) and RE. The RE is computed for each class differently and the efficiency MPg to NPg is computed depending on the EBW of the animal (Eq. [59]).
[58]
[59] in which EqEBW is obtained by multiplying the EBW by 1.023 or 0.967 for Nellore or crossbred animals, respectively.
The Nordic Feed Evaluation System (NorFor)
This modern system shares the same framework for protein calculations used by other models to calculate the protein contents in feedstuffs and the amount of protein required by the animal even though they may differ in units and factors (i.e., coefficients). The Nordic Feed Evaluation System is called NorFor (Volden, 2011). NorFor is a semi-mechanistic system that was developed from 2002 to 2006 to be used by dairy farmers in Denmark, Norway, Iceland, and Sweden. It was the result of an extensive evaluation of feed systems available in Western countries. The protein system in the NorFor was based on the Norwegian model of AA absorbed in the small intestine (AAT) and protein balance in the rumen (PBV) (Volden, 2001). The AAT-PBV system was the first Nordic model used to formulate rations for dairy cows in practical conditions and, as described by Hvelplund and Madsen (1993), the AAT-PBV system differs from other country systems in three aspects. The main differences are (1) it expresses the protein supply
by the microorganisms relative to their need for rumen-degradable N, (2) the AA proportion in the undegraded protein is 0.85 for concentrates and 0.65 for forages (nearly all other systems use a factor of 1.0 that could lead to an overestimation of the contribution of amino acid N from undegraded feed protein), and (3) the MCP synthesis in the rumen is related to the amount of totally digested carbohydrates rather than FOM. The NorFor, on the other hand, assumes a variable proportion of AA in the feedstuffs ration and the MCP synthesis depends on the individual nutrient digested for each feedstuff.
As indicated above, NorFor uses some ruminal fermentation concepts developed in Karoline (Danfær et al., 2006), which is considered a dynamic and mechanistic whole-animal model of a lactating cow that was developed for feed evaluation for teaching and research purposes in the Nordic countries (Danfær et al., 2006). It is composed of two sub-models: digestive (digestive process occurring at forestomach, small intestine and hindgut levels) and metabolic (at different levels such as portal drained viscera, liver, extracellular fluid, mammary gland, muscle and connective tissues, and adipose tissue). For dairy cattle, the main input variables are BW, week of lactation (1 to 44), pregnancy day, and planned or potential daily MY. According to Karoline, the feed value can only be precisely assessed by accounting for animal performance, which relies on feeding level, physiological state, and so forth, so many different results could be expected with any variation in a given ration. For growing animals (bulls, steers and heifers), NorFor uses BW and ADG.
The Rostock Feed Evaluation System
The Rostock feed evaluation system came along with the necessity to establish the basis for a system of feed evaluation and requirements of animals with different productivities raised in Germany. The first edition was published in 1971 (Jentsch et al., 2003). The use of DP was assumed inadequate to express the total amino acid N supplied to the animal because of the lack of accounting for the N conversions in the alimentary tract. Hence, a German working group on protein evaluation was created to develop a feeding system to account for variable degradation of the dietary protein in the rumen, an influence of energy supply on MCP synthesis, and further partition of rumen microbes and animals requirements.
The core of the Rostock system uses the ARC (1980) recommendations, so the tissue requirements are given by the summation of the endogenous losses, dermal losses, body protein deposition, and milk production. The fecal endogenous losses (g/d) are calculated differently (2.91 × DMI), assuming an average duodenal flow of 14.6 g amino acid N/kg DMI in which 70% of the amino acid N are apparently digested in the small intestine and 90% of it are absorbed. Also the requirements for N accretion in pregnant cows are based on studies conducted in Germany as described by Robelin and Daenicke (1980). The accretion of conceptus protein (g/d) is calculated as 1.9385 × e0.0108×t, in
which t represents the days of pregnancy. The NP requirements for lactation uses a fixed value (34 g CP/kg of fat-corrected milk — FCM), which represents an average of the main breeds used in Germany.
The rumen undegraded protein requirement (UDP = NAN
× 6.25 − MCP − Endogenous CP) is calculated with an average value of 80% efficiency of amino acid N utilization and assumes the same 90% absorption at the small intestine level and 70% of the N arriving at the duodenum is presented as amino acid N. So the total CP requirement at the duodenum is calculated as the multiplication of the total tissue requirement by the factor 1.984, which is the reciprocal for an efficiency of utilization of NAN of 80%, with a true digestibility of 90% and containing 70% of amino acid N. For the degradability of the protein, three
groups (65, 75, and 85%) were derived from in vivo trials
and they accommodate the main feedstuff used in Germany. For animal-origin byproducts, the protein degradability is assumed smaller than 65%. The MCP synthesis was assumed to be 10 g MCP/MJ ME for most of the diets and up to 20% of the microbe’s N requirement can be obtained from recycled N. The endogenous protein is 2.4 g N/kg DMI, which represents 67% the DMI reaching the small intestine.
Evaluation of feeding systems
Lactating Dairy Cows
CNCPS-based models and the dairy NRC (2001). The models evaluated in this section differ in assumptions, level of aggregation, and internal consistency; for example, two models may predict the same total MP supply, but if one has a higher proportion coming from MCP, the lysine: methionine ratio (lysine:methionine) differs. Therefore, the most important consideration is how well the model selected will predict nutrient balances, required supplemental nutrients, and animal performance under the conditions that it will be applied. The data were selected based on adequacy of the inputs needed for the models. All of the models compared were versions that are being used on
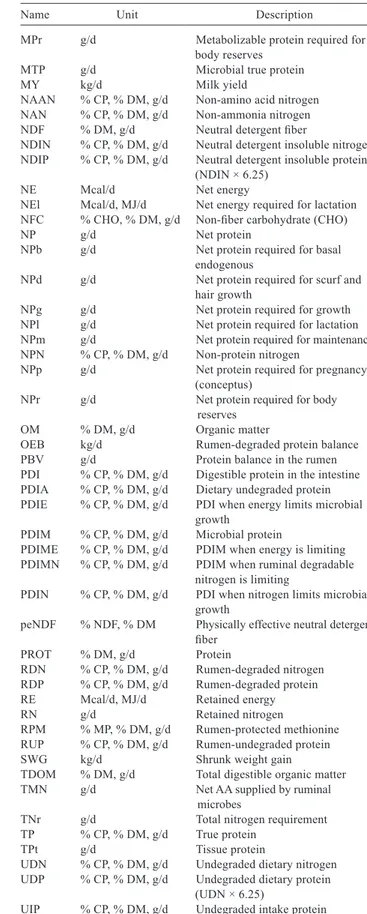
actual farms by feeding advisors. Predictions of four models — dairy NRC (2001), CNCPS version 5.0 solution levels 1 and 2 (Fox et al., 2004), and CNCPS version 6.1 (Tylutki et al., 2008; Van Amburgh et al., 2010) — were used in this evaluation, as applied in four computer programs being used on dairy farms: dairy NRC (2001), Co-operative Feed Dealers (CFD) Dairy version 5 (https://www.cfd.coop/), LRNS, and the Agricultural Modeling and Training Systems (AMTS) (http://agmodelsystems.com/AMTS/), respectively. Table 2 contains a summary of simulations that compare predictions by these models for ME, MP, methionine and lysine supply and balances with the observed data reported
Table 2 - Summary of the evaluation of four models for lactating dairy cows1
Items2
Positive control (16.8% CP) Negative control (NC: 15.6% CP) NC + 9 g/d metabolizable Met
NRC Dairy LRNS AMTSCFD NRC DairyCFD LRNS AMTS NRC DairyCFD LRNS AMTS
Milk
Yield, kg/d 41.2 41.2 41.2 41.2 41.8 41.8 41.8 41.8 41.7 41.7 41.7 41.7
Fat, % 3.85 3.85 3.85 3.85 3.52 3.52 3.52 3.52 3.77 3.77 3.77 3.77
TP, % 3.05 3.05 3.05 3.05 3.03 3.03 3.03 3.03 3.15 3.15 3.15 3.15
ME, Mcal/d
Required 62.2 61.9 61.4 61.9 60.8 60.6 59.9 60.7 62.7 62.4 62.2 62.4
Supplied3 62.6 64.8 69.7 64.7 61.9 65.8 71.4 65.1 61.4 64.9 70.6 64.4
Balance 0.4 2.87 7.84 2.7 1.1 5.19 11.5 4.6 –1.3 2.54 7.65 2.0
ADG, kg/d
Predicted4 0.05 0.39 1.06 0.36 0.15 0.70 1.55 0.62 –0.18 0.34 1.03 0.13
Actual4 0.45 0.45 0.45 0.45 0.56 0.56 0.56 0.56 0.50 0.50 0.50 0.50
MP, g/d
Required 2738 2716 2654 2709 2760 2712 2638 2709 2820 2776 2718 2767
Supplied 2719 2886 2677 2670 2521 2603 2541 2631 2489 2567 2514 2604
Bacteria 1333 1414 1459 1354 1333 1435 1591 1444 1320 1416 1574 1429
Feed 1386 1472 1219 1316 1188 1169 949 1187 1169 1152 940 1175
MPm required, g/d 862 841 779 833 869 821 747 816 860 815 739 807
MPl supplied, g/d 1857 2044 1898 1837 1652 1782 1794 1815 1629 1752 1775 1797
NPl required, g/d 1257 1256 1256 1257 1267 1267 1267 1267 1314 1314 1314 1314
NPl/MPl efficiency5, % 67.7 61.4 66.2 68.4 76.7 71.1 70.6 69.8 80.7 75.0 74.0 73.1
MP balance at MPl 67%6, g/d –19 170 22 –39 –239 –109 –97 –75 –331 –208 –204 –163
Rumen N balance, g/d 22 87 122 108 31 118 107 105 30 118 106 104
Methionine
Required7, g/d 49 49 49 44 49 49 49 44 50 50 50 45
Supplied, g/d 49 53 52 51 47 49 53 50 54 58 61 59
Supplied, % of MP 1.82 1.85 1.94 1.91 1.85 1.90 2.09 1.85 2.17 2.25 2.43 2.28
Balance, g/d 0 5 3 7 –2 0 4 6 4 8 11 14
Lysine
Required7, g/d 166 163 166 146 165 162 165 147 169 166 169 150
Supplied, g/d 168 178 173 170 164 172 178 175 163 169 176 173
Supplied, % of MP 6.17 6.16 6.46 6.37 6.52 6.61 7.01 6.70 6.53 6.59 7.00 6.63
Balance, g/d 2 15 7 24 –1 10 13 28 –6 3 7 22
Lys:Met ratio 3.39 3.33 3.33 3.34 3.52 3.48 3.36 3.62 3.01 2.93 2.89 2.90
1 CFD Dairy is Co-operative Feed Dealers Dairy version 5.0, which is based on CNCPS level 1 (Fox et al., 2004 and Tedeschi et al., 2005) and NRC (2001); LRNS is Large
Ruminant Nutrition System Level 2, which is based on CNCPS version 5.0 level 2 (Fox et al., 2004); and AMTS is Agricultural Modeling and Training Systems LLC, which is based on CNCPS v. 6.1 (Van Amburgh et al., 2010).
2 Full Body Weight (BW) was computed as (5/7 older cows × 632 kg) + (2/7 younger cows × 535 kg) = 604 kg for each treatment group. A SBW of 580 kg (604 kg FBW × 0.96)
was used to compute maintenance requirements for all evaluations. The feed composition is based on the values provided by Chen et al. (2011) for all models as much as possible. For carbohydrate and protein digestion rates, LRNS (CNCPS version 5.0) feed library values were used. For AMTS, its library rates and % of NPN in SP were used.
3 DMI was 24.7, 24.9, and 24.6 kg/d for the three diets, respectively.
4 ME required/kg BW gain = 7.4 mcal, based on Fox et al. (2004) energy reserves daily live weight gain equation. 5 MP lactation (MPl) efficiency is NP lactation (NPl) required divided by MPl supplied × 100.
6 Based on a MPl efficiency of 67%.
7 Met and Lys requirements are not in the NRC (2001) software output, so those computed with the LRNS for the actual milk production and composition within treatment
by Chen et al. (2011) for the positive and negative controls and the negative control diet + rumen-protected methionine (positive control — PC, negative control — NC, and NC plus rumen-protected methionine (RPM; 9 g methionine), respectively), as summarized below.
Positive controls. The CFD Dairy (i.e., CNCPS version 5 level 1) predicted dTDN and ME supply were approximately 5% higher than the NRC (2001) because of a lower TDN 1x discount, as predicted by the Tedeschi et al. (2005) discount equations. The LRNS predicted a 7.8% higher ME supply than AMTS. The AMTS (i.e., CNCPS version 6.1) predicted a 6.2% lower ME supply than LRNS as a result of not subtracting neutral detergent insoluble N (NDIN) from NDF in estimating NFC, and using individual fatty acid intestinal digestibilities rather than a fixed 95% digestibility for fat. The CFD Dairy and AMTS most accurately predicted energy balance, as evidenced by the predicted versus observed ADG. The MP from bacteria predicted by CFD Dairy was higher than the NRC (2001) because of the higher predicted dTDN. The MP from feed was higher for the CFD Dairy, primarily because of a higher % RUP in the CP of distillers grains. Compared with the LRNS, the AMTS predicted lower MP from bacteria because of a lower NFC and carbohydrate A fraction flowing out of the rumen in the liquid pool. However, this was more than offset by a higher RUP supply due to shifting peptides from the protein A to the protein B1 pool, lowering protein A and B1 rates, and using the liquid kp for the protein B1 pool to compute proportion degraded in the rumen. The net effect is a similar total MP supply predicted with AMTS and LRNS models. All models predicted the supply of both methionine and lysine to be adequate. However, the % of MP for both were lower and the lysine:methionine ratio was higher than those recommended by Schwab and Foster
(2009), Schwab (2012), and Whitehouse et al. (2009), as shown in Table 3.
Negative controls. There was no significant reduction in the amount of milk or milk TP kg or percentage when the diet CP was reduced from 16.8 to 15.6% (Chen et al., 2011). However, all models predicted negative MP balances. Assuming the MP supply was first limiting and therefore the actual MP balance was zero for the NC and improved MP efficiency was due to MP for lactation NP, the apparent MP efficiency for NPl varied from 69.8 to 76.7% for the four models. Three of the four models predicted methionine and lysine to be adequate, but as with the PC, the % of MP values were lower and the lysine:methionine ratios were all higher than those recommended in Table 3.
Negative controls plus 9 g RPM. Actual milk production was not different from PC, but milk TP was 0.10 percentage units higher than the PC. All four models predicted large negative MP balances. However, the methionine (% of MP) and the lysine:methionine ratios were similar to those recommended (Table 3). We conclude the increased TP % in milk was due to the improved methionine (% of MP) and lysine:methionine ratio. Except for the NRC (2001), which predicted a deficiency of 6 g lysine, all models predicted methionine and lysine supply (g/d) to exceed requirements. Assuming the MP supply was first limiting and therefore the apparent MP balance was 0 for the NC and improved MP efficiency was due to MP for lactation NP, the apparent MP efficiency for the NC + 9 g RPM for the NRC (2001), CFD Dairy, LRNS, and AMTS models were 80.7, 75.0, 74.0, and 73.1%, respectively, instead of the fixed 67% used in the model.
Schwab and Foster (2009) concluded that research with lactating dairy cows has shown that increasing predicted concentrations of lysine and methionine in MP to recommended levels increases efficiency of use of MP for milk protein synthesis. The NRC (2001) utilized published data to develop ratios of methionine and lysine required in the MP for lactating dairy cows to optimize milk production. The NRC (2001) committee decided that the current knowledge was too limited to develop and test a complete factorial model to predict requirements for metabolizable AA (NRC, 2001; page 81). Therefore, they utilized the dose response approach to predict the optimum ratios of lysine and methionine in the MP to maximize protein content of milk. They found that 7.2% lysine and 2.5% methionine as percent of the MP yielded optimum use of the MP for maintenance and milk protein yield. Their ratios were very similar to the 7.3 and 2.5% for lysine and methionine, respectively reported by Rulquin et al. (1993). This result is consistent with the concept that when the EAA Table 3 - Breakpoint estimates for required concentrations of
lysine and methionine in metabolizable protein for maximal content and yield of milk protein1
Items Lysine Methionine Lys:Met ratio
NRC (2001) model
Milk protein, % 6.80 2.29 2.97
Milk protein yield 7.10 2.52 2.82
CPM model2
Milk protein, % 7.46 2.57 2.90
Milk protein yield 7.51 2.50 3.00
AMTS model3
Milk protein, % 6.68 2.40 2.78
Milk protein yield 6.74 2.31 2.92
1 Analysis using the dairy NRC (2001) database (Schwab and Foster, 2009;
Whitehouse et al., 2009; Schwab, 2012).
2 CPM is CPM Dairy v.3, which is based on CNCPS v. 5.0 level 2 and the feed library
of CNCPS v. 6.0.
3 AMTS is Agricultural Modeling and Training Systems LLC, which is based on