ISSN 1941-7020
© 2014 A. El Ghoulbzouri et al., This open access article is distributed under a Creative Commons Attribution (CC-BY) 3.0 license
Corresponding Author: A. Khamlichi,Modeling and Analysis of Systems Laboratory, Department of Physics, Faculty of Sciences at Tetouan, University Abdelmalek Essaâdi, Tetouan 93002, Morocco
332
Evaluating some Reliability Analysis Methodologies in Seismic Design
1
El Ghoulbzouri, A.,
1A. Khamlichi,
2F. Lopez Almansa,
3
M.A. Parron Vera and
3M.D. Rubio Cintas
1
Modeling and Analysis of Systems Laboratory, Department of Physics,
Faculty of Sciences at Tetouan, University Abdelmalek Essaâdi,
Tetouan 93002, Morocco
2
Department of Structures in Architecture,
High Technical of Architecture in Barcelona,
Polytechnic University of Catalonia, Av. Diagonal 649,
08028 Barcelona, Spain
3
Department of Civil and Industrial Engineering,
High Polytechnic School of Algeciras,
University of Cadiz, Ramon Puyol Avenue, Algeciras 11202, Spain
Abstract: Problem statement: Accounting for uncertainties that were present in geometric and material data of reinforced concrete buildings was performed in this study within the context of performance based seismic engineering design. Approach: Reliability of the expected performance state is assessed by using various methodologies based on finite element nonlinear static pushover analysis and specialized reliability software package. Reliability approaches that were considered included full coupling with an external finite element code and surface response based methods in conjunction with either first order reliability method or importance sampling method. Various types of probability distribution functions that model parameters uncertainties were introduced. Results: The probability of failure according to the used reliability analysis method and to the selected distribution of probabilities was obtained. Convergence analysis of the importance sampling method was performed. The required duration of analysis as function of the used reliability method was evaluated. Conclusion/Recommendations: It was found that reliability results are sensitive to the used reliability analysis method and to the selected distribution of probabilities. Durations of analysis for coupling methods were found to be higher than those associated to surface response based methods; one should however include time needed to derive these lasts. For the reinforced concrete building considered in this study, it was found that significant variations exist between all the considered reliability methodologies. The full coupled importance sampling method is recommended, but the first order reliability method applied on a surface response model can be used with good accuracy. Finally, the distributions of probabilities should be carefully identified since giving the mean and the standard deviation were found to be insufficient.
Key words: Reliability analysis, first order moment, importance sampling method, response surface, finite element, seismic design, material data
INTRODUCTION
Realistic modeling based on reliability analysis of structural behavior of buildings at risk of earthquake events is the subject of increasing interest from the community of seismic building designers (Arulselvan and Subramanian, 2008; Buratti et al., 2010; Celik and Ellingwood, 2010; Ebrahimi et al., 2010). Among the reasons beyond the intensive research activity in this
field, one finds the huge need for diagnosis and rehabilitation of pre-code constructions, particularly in the case of historic monuments. Other reasons are associated to the emergence of new design approaches which are founded on the concept of performance-based engineering.
333 elaborated to ensure essentially a priori life safety of buildings occupants, this new approach includes additional critical states that could be important for buildings use. These performance states are associated to indicators such as the tolerable amount of damage or the accepted economic loss resulting from temporarily loss of functionality.
Predicting these performance states is considered in terms of probabilities such that occupants or owners of buildings could be aware of the risk level they are undergoing. To realize that, adequate numerical modeling of the building structural behavior and satisfactory description of uncertainty propagation are required. This is generally performed within the framework of reliability analysis. Uncertainties arising in the problem could be the result of the inherent randomness in material characteristics, geometric dimensions or applied forces. These categories of uncertainties are termed stochastic parameters. But, uncertainties could be also epistemic such as those due to lack of knowledge regarding the real values of some parameters in existing constructed buildings: reinforcement sections in structural members or junctions features that exist between columns and beams.
Accounting for the various uncertainties affecting the structural model is performed by assuming the input data for the finite element computation to be random variables that depict the uncertain variations in the material, geometry and loading parameters. Uncertainty propagating modeling such as Monte Carlo process enables then to compute the resulting probability of response events. Finite element reliability analysis needs specifying some performance function defining a given limit-state. The performance function comes out generally to be an implicit function of the input data (Mayoral and Romo, 2008). The performance function separates the data space into two regions: The safe region and the failure region. The probability of failure is linked to the minimum distance separating the actual design realization from the most probable failure point laying on the limit surface, called also the design point. Since the performance function is not explicitly known and Monte Carlo process is too time consuming, search of the design point is performed habitually through various approximate reliability analysis methods.
In the First Order Reliability Method (FORM) the limit-state is approximated, at the most likely failure point in the transformed space of uncorrelated standard normal random variables, by a hyper-plane. A review of coupling between FORM reliability analysis and the finite element method is given in (Kiureghian, 1996).
Finite element reliability analysis using full coupling between a finite element code and reliability methods such as FORM or Monte Carlo tends however
to be high computational time consuming for practical problems that include large number of random variables. This is because, at any iteration, the limit-state function and its derivatives are to be evaluated through finite element computations.
In this study, a Response Surface based Method (RSM) is considered in order to simplify further reliability analysis and to accelerate calculation process of the approximate performance index. RSM is considered in combination with either ISM or FORM methods. Validity of this approach is discussed in the following by considering decisive factors influencing its efficiency such as the effect due to some particular choice of probability distribution functions that model parameters uncertainties or the effect of convergence criterion used in the ISM.
MATERIALS AND METHODS
Reliability analysis methodologies: Reliability analysis is performed by using the Pacific Earthquake Engineering Research Center (PEER) computational platform OpenSees, (Haukaas, 2004). OpenSees is an abbreviation of Open System for Earthquake Engineering Simulation, which is an open-source, general-purpose finite element code which was specifically developed for earthquake engineering analysis. In order to enable finite element reliability analysis OpenSees was extended with reliability and response sensitivity capabilities.
OpenSees is a collection of software components that interrelate in combination with finite element analysis. These include probability transformation, search algorithms to determine the Most Probable Failure Point (MPP), random number generation and limit-state functions.
Eight analysis types are available in the version of Open Sees used in this study. However, only two methods will be considered in the following: the approximate method FORM and the more accurate Importance Sampling Method (ISM).
FORM analysis is based on two mean operations. Firstly, the design point in the transformed uncorrelated standard normal space should be located. Secondly, the limit-state surface at this point is approximated by a hyper-plane and use is made of the properties of the standard normal space to obtain the probability estimate. The distance from the origin of the standard normal space to the design point, denoted in the original space, is termed the reliability index and is denoted β. The first-order probability estimate is then found as
1
f f
P =P = Φ −β( ) where Φ is the standard normal cumulative distribution of probabilities.
334 events occur in general in the tail regions of probability distributions, a large number of samples are required to obtain good failure probability estimates. A major concern in finite element reliability analysis is then the large number of evaluations of the performance function that are needed to guarantee accuracy.
By centering the sampling distribution near the failure domain at a point Ycenter, a far more efficient
sampling scheme is obtained. This technique is referred to as the importance sampling method.
Denoting x a vector of n independent random variables in the physical space, y its transformed in the normal space and g(x) = 0 a given limit-state, introducing an indicator function I(y) such that I(y) = 1 if g(x(y))≤0 and I(y) = 0 otherwise, it can be easily shown that the failure probability writes as follows Eq. 1:
f
(y)
P I(y) (y) dy I(y) f (y)dy q(y)f (y)dy f (y)
Ω Ω Ω
ϕ
= ϕ = =
∫
∫
∫
(1)With φ and f the joint standard normal Probability Distribution Functions (PDF) Eq. 2-3:
t n / 2
1 1
(y) exp y y
2 (2 )
ϕ = π −
(2)
center n / 2
t 1
center
1
(y y )
1
2
f (y) exp
(2 ) det
(y y )
−
− −
=
π ∑
Σ −
(3)
The sampling analysis implemented in Open Sees evaluates Pf by performing sequential generation of
vector y of independent and normally distributed random numbers having zero means and unit variances. y is then transformed according to y=ycenter+Ly, where L is the Cholesky decomposition of a user provided covariance matrix Σ. The covariance matrix is typically chosen as a unit matrix. But, the user has the possibility to enter a diagonal or a full matrix Σ where the off-diagonal terms provide correlation between random variables. The most effective choice of the mean vector ycenter is the design point. Since this point is not
known the user introduces an approximate value of it. The vector y is transformed back into the original space x = x(y) where the performance function g (x) is evaluated for this realization of the random variables. I (x) is assigned a value based on the outcome of g (x). The variable q(y)=I(x(y)) (y) / f (y)ϕ is then evaluated in the standard normal space. This enables estimating the probability of failure as Eq. 4:
N
f f ,sim i
i 1
1
P P q
N =
≅ =
∑
(4)where, qi=q (yi) and is the number of samples.
A measure of accuracy of the probability estimate is the coefficient of variation of the probability estimate: Eq. 5
(
)
2 N N 2 i ii 1 i 1
f ,sim N
i i 1
1 1
q q
N(N 1) N
c.o.v P 1 q N = = = − − =
∑
∑
∑
(5)The sampling is repeated a user-defined number of times or until the c.o.v. estimate falls below a specified target which is typically lesser than 50%.
Finite element seismic reliability analysis of buildings: The performance-based engineering approach is based on simulation of real structural behavior. This feature sets it apart from classical prescriptive rules associated to code-based design. The client or government regulations prescribe desired performance objectives, which are translated into decision variables or functions and serve defining performance criteria.
Applying reliability analysis methods in the context of performance-based engineering uses the specified performance functions as performance criteria or limit-states. The term failure denotes then the event of not meeting a given performance criterion. It is then important to know how to translate such performance requirements into explicit performance functions attainable by finite element structural analysis.
In this study reference is made to the performance level introduced by the Moroccan seismic code RPS, 2000 which intends limiting the building roof displacement ratio. Other performance criteria introduced to distinguish performance-based engineering states with regards to earthquake events could be considered.
In this study, finite element analysis was performed by means of open sees platform. The beam-column element used is a displacement-based element having the aptitude to take into account distributed plasticity that develops through fiber cross-sections. The element uses the stiffness formulation approach. A user-selected number of integration points along the element can be prescribed. The fiber cross-sections are composed of uniaxial material models.
335 Case of study: In order to evaluate the different methodologies introduced to account for uncertainties within the framework of finite element reliability analysis under Open Sees environment, a two-story reinforced concrete building structure is considered. It consists of a regular building for which the nonlinear static pushover analysis is sufficient to assess seismic performance. The inter story height is fixed at. The bay length in both seismic directions is fixed at. Figure 1 gives the vertical elevation and the plane view. Figure 2 gives concrete sections of members with their reinforcements as computed by using Eurocode 2 code. The vertical load resultants at the structural nodes, in kN, are:
W2=W6=W8=94.4,W3=W9=47.2
The seismic lateral loads, in kN, are: F2 = 25 and F3 = 50
(a)
(b)
Fig. 1: Two-storey two-bay reinforced concrete structure; (a) Vertical elevation, (b) Plane view
The ultimate strengths of outer layer of concrete and of the core concrete as well as Young’s modulus of the reinforcement steel are modeled as random variables. These are intended to model the inherent, irreducible uncertainty in the finite element model parameters. All the other material and geometric parameters as well as loads will be considered to be deterministically known. Table 1 gives the deterministic nominal parameters values of material data that were used during reliability analysis of the RC structure. Table 2 defines the uncertainty modeling of the random variables.
All the random variables are assumed to be distributed according to one of the following three probability distribution functions: Normal, lognormal or gamma. Denoting the mean value and the standard deviation, these PDF write as follows Eq. 6-8:
Normal distribution:
2
2
1 (x )
f (x) exp
2 2
− µ
= −
σ π σ (6)
(a)
(b)
(c)
Fig. 2: Members reinforcements; (a) Exterior columns, (b) Interior columns, (c) Section girders
Table 1: Deterministic nominal parameters values of the reinforced concrete building
Parameter Value
Compressive strain of outer layer of concrete, εc,uc 0.002
Ultimate strength of outer layer of concrete, fcu,uc′ (MPa) 0.000
Ultimate strain of outer layer of concrete, εc,uc 0.006
Compressive strain of the core concrete, εc,uc 0.005
Ultimate strength of the core concrete, fcu ,uc′ (MPa) 30.000 Ultimate strain of the core concrete, εc,uc 0.020
Tensile strength of the reinforcement steel, f(y) (MPa) 500.000 Second slope stiffness ratio of the reinforcement steel, α 0.020
336
Table 2: Uncertainty modeling of the random variables of the reinforced concrete buildings
Variable Mean value Deviation ratio Standard deviation
c,cc
f′ (MPa) 37.92 0.15 5.69
c,uc
f′ (MPa) 27.00 0.15 4.05
E (MPa) 200000.00 0.05 10000.00
Lognormal distribution:
1
2 2 2
2
2
2 2 2 2
2 2
1
f (x) exp
2 ln x
x
log 2log
=
µ + σ
π
µ
µ + σ µ + σ
−
µ µ
(7)
Gamma distribution:
2 2 2 2
2
2 2
2
2
x
x exp
f (x)
µ µ −σ
σ σ
µ µ
−
σ σ
=
µ
Γ
σ
(8)
This limit-state function seeks the probability that the horizontal displacement at the roof of the structure exceeds 0.4% of the building height, when deterministic lateral seismic load is evaluated according the Moroccan seismic code RPS2000 for a given geographic zone, soil site, ductility coefficient and building priority. The limit state function writes Eq. 9:
roof
g(x)=0.004 H− δ (x) (9)
where H is the total height of the building, in units of mm, δroof is the horizontal displacement, in units of
mm, of the roof node as obtained from a static nonlinear pushover-type analysis and x is the vector of random variables: x=fc,cc′ fc,uc′ Et.
Knowing that H = 6000mm, the limit-state function writes Eq. 10:
roof
g(x)=24− δ (x) (10)
Two kinds of parametric studies were performed as indicated in the following:
• Using full coupling reliability analysis, comparison between FORM and ISM methods was conducted and the influence of PDF’s on results investigated
• Using response surface method and full coupling reliability analysis, comparison between FORM and ISM methods was considered and convergence of the ISM as function of the c.o.v was analyzed
RESULTS
Full reliability coupling FORM and ISM methods and influence of probability distribution functions on results: Figure 3 gives sensitivity of the probability of failure to PDF’s for the two FORM and ISM methodologies of reliability analysis while Fig. 4 gives duration of the analysis associated to each one of these methods.
FORM and ISM reliability methods applied to a response surface model of the building: The response surface writes as g(fc,cc c,uc′ ,f′ ,E) 24= −δroof(fc,cc c,uc′ ,f′ ,E)
where is the interpolated displacement over the domain of variables (fc,cc′ ,fc,uc′ ,E)
.
Interpolation is performed according to a full factorial design of experiment table containing a total number of 27 combinations. The combinations include values of parameters corresponding to:• Lower threshold -hσ • Average value • Higher threshold +hσ
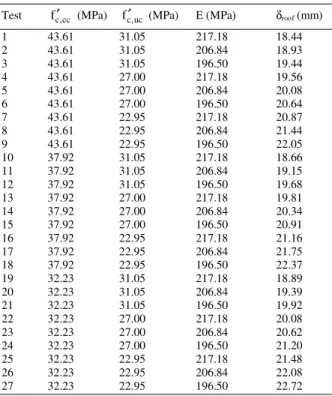
Table 3 recalls the obtained results when using lognormal probability distributions and fiixing the value of magnitude h = 1. The interpolated roof displacement, expressed in (mm), writes:
337 Fig. 4: Duration of analysis for the various PDF’s
modeling uncertainties
Table 3: Roof displacement as function of the considered combination
Test fc,cc′ (MPa) fc,uc′ (MPa) E (MPa) δroof (mm)
1 43.61 31.05 217.18 18.44
2 43.61 31.05 206.84 18.93
3 43.61 31.05 196.50 19.44
4 43.61 27.00 217.18 19.56
5 43.61 27.00 206.84 20.08
6 43.61 27.00 196.50 20.64
7 43.61 22.95 217.18 20.87
8 43.61 22.95 206.84 21.44
9 43.61 22.95 196.50 22.05
10 37.92 31.05 217.18 18.66
11 37.92 31.05 206.84 19.15
12 37.92 31.05 196.50 19.68
13 37.92 27.00 217.18 19.81
14 37.92 27.00 206.84 20.34
15 37.92 27.00 196.50 20.91
16 37.92 22.95 217.18 21.16
17 37.92 22.95 206.84 21.75
18 37.92 22.95 196.50 22.37
19 32.23 31.05 217.18 18.89
20 32.23 31.05 206.84 19.39
21 32.23 31.05 196.50 19.92
22 32.23 27.00 217.18 20.08
23 32.23 27.00 206.84 20.62
24 32.23 27.00 196.50 21.20
25 32.23 22.95 217.18 21.48
26 32.23 22.95 206.84 22.08
27 32.23 22.95 196.50 22.72
roof roof c,cc c,uc c,cc
-3 c,uc
-3
c,cc c,uc
-4
c,uc c,cc
2 c,cc
2 -7 2
c,uc
(f , f , E) 64.79-7.338 f -47.11 f -7.973 10 E
4.214 f f +2.626 10 f E 4.166 10 E f
0.5478 (f ) 15.02 (f ) 4.142 10 E
′ ′ ′
δ = δ =
′ ×
′ ′
+ × ×
′ × + × × ′
′
+ +
′ + ×
(11)
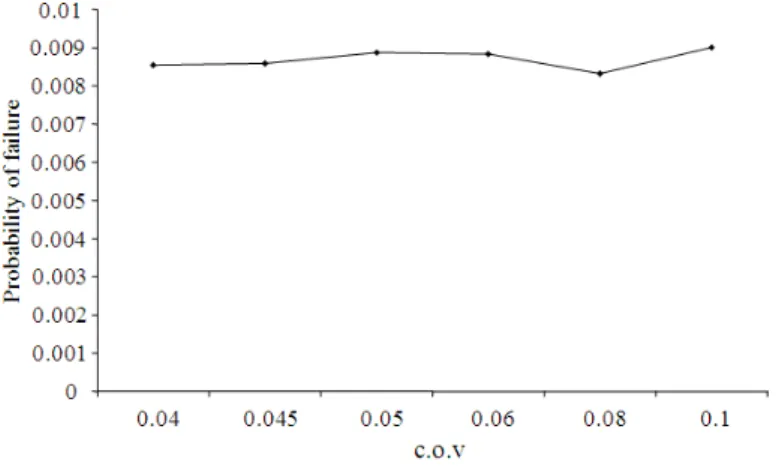
The two approximate methods RSM/FORM and RSM/ISM are considered in the following in order to assess their accuracy. In case of RSM/ISM the coefficient of variance (c.o.v) has been varied in the set {0.04, 0.045, 0.05, 0.06, 0.08 and 0.01} in order to study effect of truncated convergence of ISM on reliability results.
The response surface in terms of the performance function as derived from Eq. 10 and 11 is identified from the discrete displacement results that are listed in Table 3. This is provided by using the least-square inversion technique.
Figure 5 gives for RSM/ISM the probability of failure as function of the c.o.v. Figure 6 gives the total number of samples needed for RSM/ISM to get convergence within the specified value of c.o.v.
Figure 7 summarizes for the four methodologies (Coupling/FORM; Coupling/ISM, RSM/FORM and RSM/ISM) the probability of failure. Figure gives a general comparison in terms of duration of analysis of all these reliability methodologies.
DISCUSSION
It is clearly shown from Fig. 3 that the reliability analysis with FORM and with ISM do not yield the same results. Figure 4 shows that duration of analysis varies a lot as function of the selected PDF’s. It shows also that duration of analysis associated to FORM is always very small in comparison with that needed in ISM.
Considering FORM and ISM methods, Figure 3 shows that the probabilities of failure are in general close. But, significant deviations occur however between these two methods since the highest relative error is bounded by -7 and +13% when ISM method is taken as the reference.
Considering now duration of analysis associated to the FORM and ISM methods, as given in Fig. 4, it is clear that the ISM is hugely time consuming, as it is quite expected, in comparison with the approximate FORM. Figure 4 shows also that the duration of analysis depends a lot on the chosen PDF.
338
Fig. 5: Evolution of the probability of failure as function of c.o.v when using coupling and ISM method of reliability analysis
Fig. 6: Evolution of total number of samples as function of c.o.v when using coupling and ISM method of reliability analysis
339
Fig. 8: Duration of analysis for the various reliability analysis methodologies Figure 7 shows that the four methodologies give results
that are rather close one from each other. The coupling/FORM method has the tendency to underestimate the probability of failure. On the opposite, the RSM/ISM has the tendency to overestimate the probability of failure. The more accurate coupling/ISM and the simpler RSM/FORM are quite surprisingly closer one from each other than the both from the others. This could be justified by a sort of compensation which appears while performing interpolation and FORM analysis. For the building considered in this study, there is no need to perform coupling/FORM and RSM/ISM which are time consuming (Fig. 8) and which are both less accurate than RSM/FORM.
CONCLUSION
It has been shown that the full coupling reliability analysis does not predict the same results than the approximate response surface based reliability method. This last underestimates in general the probability of failure. The maximum relative difference between these various methodologies results has reached 41.5%. This occurs between the Coupling/FORM and the SRM/ISM methods.
Within the framework of the same methodology of reliability analysis (either full coupling or response surface), the approximate method FORM does not give the same results than the more precise modified Monte Carlo ISM Method. In general, FORM overestimates the probability of failure.
The obtained results have shown that full coupling reliability analysis conducted with ISM is recommended because FORM analysis could
exaggerate sometimes the probability of failure. It is remarkable to observe the antagonist effect resulting from the association of SRM/FORM because this method gives results that are closer to the more exact Coupling/ISM. The ISM method is always more time consuming than FORM approximation. To make an objective comparison regarding computational cost, one should recall also that response surfaces must be identified and that additional labor is required for that.
Influence on reliability data of the chosen PDF’s to model uncertainties is very significant when considering full coupling reliability analysis. This effect reduces however when surface response based reliability analysis is performed. In order to perform reliability analysis of seismic performance based design, huge care should be given to selection of PDF’s that model parameters uncertainties (these should be is general identified through experiments). It is not sufficient to give only means and standard deviations, the PDF’s must also be specified.
When applying surface response based reliability analysis, it was shown that FORM approximation overestimates here again the probability of failure in comparison with the accurate ISM.
These conclusions could not be generalized without precautions to other problems dealing with reliability analysis and thorough analysis is needed to assess performance of the various methodologies.
ACKNOWLEDGMENT
340 REFERENCES
Arulselvan, S. and K. Subramanian, 2008. Experimental investigation on three dimensional RC infilled frame-RC plane frame interactions with slab for seismic resistance. Am. J. Applied Sci., 5: 328-333. DOI: 10.3844/ajassp.2008.328.333 Buratti, N., B. Ferracuti and M. Savoia, 2010. Response
Surface with random factors for seismic fragility of reinforced concrete frames. Struct. Safety, 32: 42-51. DOI: 10.1016/J.STRUSAFE.2009.06.003 Celik, O.C. and B.R. Ellingwood, 2010. Seismic
fragilities for non-ductile reinforced concrete frames-role of aleatoric and epistemic uncertainties. Struct. Safety, 32: 1-12. DOI: 10.1016/J.STRUSAFE.2009.04.003
Escobar, J.A.S., J.A. Mendoza and M.R. Gómez, 2008. Effect of earthquakes on some kind of buildings. Am. J. Environ. Sci., 4: 189-197. DOI: 10.3844/ajessp.2008.189.197
Ebrahimi, M., H. Sharifian and M. Ahangar, 2010. Seismic response evaluation of moment resistant frame with built-up column section. Am. J. Eng.
Applied Sci., 3: 37-41. DOI:
10.3844/ajeassp.2010.37.41
Haukaas, T., 2004. Finite element reliability methods in earthquake engineering practice. Proceedings of the 13th World Conference on Earthquake Engineering, Aug. 1-6, Vancouver, B.C., Canada, pp: 1-13.
Kiureghian, A., 1996. Structural reliability methods for seismic safety assessment: a review. Eng. Structures, 18: 412-424. DOI: 10.1016/0141-0296(95)00005-4