PRELIMINARY EVALUATION OF ACID MINE
DRAINAGE IN MINAS GERAIS STATE, BRAZIL
(1)
Jaime Wilson Vargas de Mello(2), Luiz Eduardo Dias(2), Alfredo Mucci Daniel(3), Walter Antonio Pereira Abrahão(2), Eleonora
Deschamps(4) & Carlos Ernesto G.Reynald Schaefer(2)
SUMMARY
Mining in the State of Minas Gerais-Brazil is one of the activities with the strongest impact on the environment, in spite of its economical importance. Amongst mining activities, acid drainage poses a serious environmental problem due to its widespread practice in gold-extracting areas. It originates from metal-sulfide oxidation, which causes water acidification, increasing the risk of toxic element mobilization and water resource pollution. This research aimed to evaluate the acid drainage problem in Minas Gerais State. The study began with a bibliographic survey at FEAM (Environment Foundation of Minas Gerais State) to identify mining sites where sulfides occur. Substrate samples were collected from these sites to determine AP (acidity potential) and NP (neutralization potential). The AP was evaluated by the procedure of the total sulfide content and by oxygen peroxide oxidation, followed by acidity titration. The NP was evaluated by the calcium carbonate equivalent. Petrographic thin sections were also mounted and described with a special view to sulfides and carbonates. Based on the chemical analysis, the acid-base accounting (ABA) was determined by the difference of AP and NP, and the acid drainage potential obtained by the ABA value and the total volume of material at each site. Results allowed the identification of substrates with potential to generate acid drainage in Minas Gerais state. Altogether these activities represent a potential to produce between 3.1 to 10.4 billions of m3 of water at pH 2 or 31.4 to 103.7 billions of m3 of water at pH 3. This, in turn, would imply in costs of US$ 7.8 to 25.9 millions to neutralize the acidity with commercial limestone. These figures are probably underestimated because some mines were not surveyed, whereas, in other cases, surface samples may not represent reality. A more reliable state-wide evaluation of the acid drainage potential would require
(1)Pesquisa realizada com apoio financeiro da FAPEMIG. Recebido para publicação em janeiro de 2004 e aprovado em abril de 2006. (2) Professor do Departamento de Solos, Universidade Federal de Viçosa – UFV. CEP 36571-000 Viçosa (MG). Bolsista do CNPq.
E-mails: [email protected]; [email protected]; [email protected]
(3)Gerente de Pesquisa e Meio Ambiente. Rua procópio Ferreira 237, Cond. Horto Florestal, Bro. Horto, CEP 36770-000 Cataguases
(MG). E-mail: [email protected]
(4)Fundação Estadual do Meio Ambiente – FEMA. Av. Prudente de Morais 1671, CEP 30380-000 Belo Horizonte (MG). E-mail:
further studies, including a larger number of samples. Such investigations should consider other mining operations beyond the scope of this study as well as the kinetics of the acid generation by simulated weathering procedures.
Index terms: acid mine drainage, acid-base accounting; sulfide minerals.
RESUMO:AVALIAÇÃO PRELIMINAR DE DRENAGEM ÁCIDA NO ESTADO
DE MINAS GERAIS, BRASIL
A despeito da importância econômica de atividades mineralógicas para o estado de Minas Gerais, perceber-se que elas causam significativo impacto ao ambiente. Drenagem ácida é um dos aspectos ambientais considerados pela atividade em função de seus impactos. Ela tem origem a partir da oxidação de sulfetos metálicos que acidificam as águas, com possibilidade de mobilizar elementos tóxicos e poluir os recursos hídricos. Este trabalho teve como objetivo realizar uma avaliação preliminar do problema em Minas Gerais. O trabalho teve início a partir de um levantamento bibliográfico junto a Fundação Estadual de Meio Ambiente (FEAM) para identificar minerações cujo minério está associado a sulfetos. Amostras dos substratos foram retiradas para determinar o potencial de acidez (AP) e de neutralização (NP). AP foi avaliado por dois procedimentos: pelo teor total de sulfetos e pela oxidação com peróxido seguida da titulação ácida. O NP foi avaliado pelo teor equivalente de carbonato de cálcio. Lâminas petrográficas foram preparadas para a descrição mineralógica com ênfase em sulfetos e carbonatos. O balanço ácido-base (ABA) foi determinado pela diferença entre AP e NP, enquanto o potencial de geração de águas ácidas foi obtido pelo valor de ABA e o volume total de material de cada atividade minerária. Os resultados permitiram identificar quatro substratos com potencial para gerar drenagem ácida no estado de Minas Gerais. Juntas, estes materiais representam um potencial de geração de cerca 3,14 a 10,37 bilhões de metros cúbicos de água a pH 2,0 ou 31,4 a 103,7 bilhões de metros cúbicos de água a pH 3,0. Estes valores significam custos entre US$ 7,8 e 25,9 milhões para neutralizar a acidez com o uso de calcário. Estas estimativas são provavelmente subavaliadas, uma vez que algumas minerações não foram incluídas no levantamento e, para outras, as amostras superficiais podem não representar a realidade. Uma avaliação mais rígida do potencial de drenagem ácida em nível estadual requer estudos futuros. Estes estudos precisariam incluir um número maior de amostras e mineradoras não incluídas neste trabalho. Eles poderiam considerar, ainda, a cinética de geração de acidez por meio de procedimentos de intemperismo simulado.
Termos de indexação: drenagem ácida de minas; balanço ácido-base; minerais sulfetados.
INTRODUCTION
Mining is one the most important traditional and economical activities in Brazil, which accounts for considerable economic and social benefits. Nevertheless, mining is considered to cause a number of negative environmental impacts. Acid mine drainage (AMD) is one of the currently most discussed environmental problems. It is initiated during the mining process, where a variety of metallic sulfides is exposed to the atmosphere and
spontaneously oxidizes in the presence of O2 (Geidel
& Caruccio, 2000). Sulfide materials may also be exposed by highway construction and other large scale excavations (Skousen, 2000). The products of such reactions are not only highly soluble, but also strongly acidic. Thus, high sulphate and iron contents make the water drainage acid. If potentially
toxic elements are present, such as Al, Mn, Cu, Zn, Pb, Hg, Cd, etc., they are mobilized in the drainage water, increasing the risk of toxic metal incorporation in biological systems, promoting biomagnification by the trophic chain (Mello & Abrahão, 1998). Among the sulfide minerals, pyrite
and marcasite (FeS2) are dominant in the state’s
mining regions, but other metals may be complexed
with these sulfides, forming chalcopyrite (CuFeS2),
covellite (CuS), galena (PbS), sphalerite (ZnS), and arsenopyrite (FeAsS).
The pH values of acid drainage (AD) in mined areas is usually below 3.5, with total amounts of soluble
metals of over 50 mg L-1 (Ziemkiewics et al., 1977).
In fact, high metal concentrations are common in acid drainage from coal mines, where average values of Fe and Mn in solution can vary from 20 to
300 mg L-1 and sulfate from 20 to 2,000 mg L-1
(Richards et al., 1993).
An important aspect to control the occurrence of AD is an accurate prediction of the acid-producing potential of the material. Several methods of determining the acidity potential (AP) have been proposed, for example: Smittenberg et al. (1951); Neckers & Walker (1952); Murthy & Sharada (1960); Pons (1964); Petersen (1969); Aspiras et al. (1972); Caruccio (1975); and Sorenson et al. (1979). In Brazil,
Soares et al. (1997) used the “aqua regia” (HNO3:HCl
1:3) digestion as a simplified method to evaluate the total sulfide content in coal mining samples from Rio Grande do Sul. Each of these methods measures either S or Fe associated with iron sulfides and therefore provides an indirect estimate of the potential acidity by the stoichiometric equation for pyrite oxidation. The constraints on such estimates are that sulfides other than pyrite may be present, which produce acidity in a different stoichiometry in relation to that of pyrite, as described by Singer and Stumm (1970). Such estimates would therefore require a detailed description and an accurate evaluation considering all sulfides present in the sample, which is a very laborious and demanding determination. To overcome this problem, the acid-producing potential can be measured directly. A rapid oxidation technique has been proposed with 30 %
H2O2 that oxidizes iron sulfides (Yoneda, 1961; Grube
Jr. et al., 1971; Sobek et al., 1978), followed by a direct titration of the produced acid.
The occurrence of AMD is not only determined by the presence of sulfides since it is very common to find carbonates associated with sulfides, which may reduce or neutralize the acidity generated by sulfide oxidation. Acid-Base Accounting (ABA) is a widely used method to estimate the potential of acid generation (Sobek et al., 1978). It is calculated by the difference between the acidity (AP) and neutralization potential (NP). In the case of negative values, the neutralization potential of the substratum is higher than its potential of acidity and AMD is, therefore, not expected.
With regard to the fact that Brazilian environmental regulations are yet incipient concerning AMD aspects, the scope of the problem needs to be evaluated. It is therefore important to identify suitable simple analytical methods for such an assessment. The “aqua regia” digestion appears to be a simple enough option for AMD studies.
The present study aimed to compare direct measures of the acid-producing potential technique as described by O’Shay et al. (1990) with the total
sulfide oxidation evaluated by the “aqua regia” digestion technique. Furthermore, the potential of some mining activities in the state of Minas Gerais, Brazil to generate acid drainage was outlined in a preliminary evaluation.
MATERIAL AND METHODS
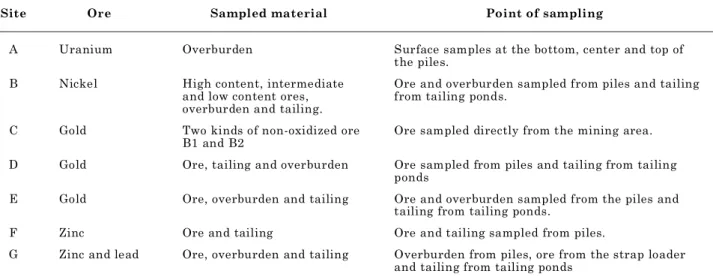
In a thorough bibliographic survey at the Minas Gerais Environmental Agency (FEAM), sites where mining activities are associated with sulfides were identified. Seven large mining sites were listed whose activities have the potential to generate acid drainage, including uranium, nickel, gold, and zinc exploitations. The second step consisted in the sampling of the different substrates including ore, overburden, and tail (Table 1) according to the peculiarities of each mine. In all situations, at least three simple surface (0–0.2 m) samples were taken to compose the final sample.
After each sample had been dried and ground (0.149 mm), analyses were carried out to determine the pH and electrolytic conductivity (EC) in water (1:2.5 v/v), the acidity potential (AP) and neutralization potential (NP). AP was evaluated by two procedures: total sulfide content after
HCl + HNO3 mixture (3:1 v/v) digestion (Soares,
1995) and oxygen peroxide (30 %) oxidation followed by acidity titration (O’Shay et al., 1990). NP was evaluated as calcium carbonate equivalent by titration of the remaining HCl after reaction with a ground sample (Embrapa, 1979). Based on the chemical analysis, the acid-base accounting (ABA) was determined by the difference of AP and NP. The generation potential of acid drainage was obtained from ABA values and the total amounts of the respective materials of each mining activity. This potential was stated as acid water volume at pH 2.0 or 3.0.
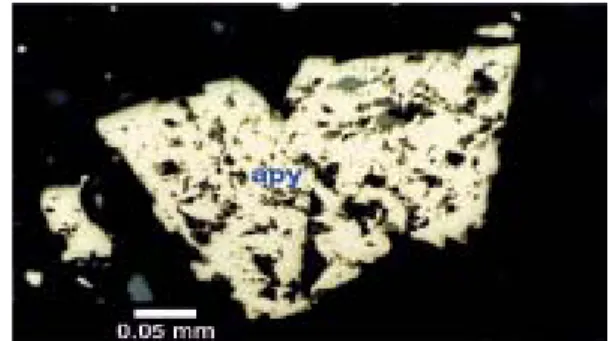
Petrographic thin sections were produced after impregnating representative rock samples from each site. The main minerals were described, focusing on the presence of sulfite/carbonate. Sulfites were identified based on the following criteria (Winchell, 1933; Kerr, 1977):
•
Pyrite (FeS2) was identified by cubic tooctahedral crystals, opaque, showing a brilliant metallic luster, creamy white color under reflected light and yellowish colors under dimmed reflected light.
•
Sphalerite (ZnS) was identified by isotropictetrahedral crystals, with refringence, brownish to yellow color, with spectral tonality.
•
Pyrrhotite (FeS) was identified by hexagonalreflected light; Color yellow to copper, darker than pyrite; cream-colored under vertical reflected light; usually associated with chalcopyrite.
•
Arsenopyrite (FeAsS) with octahedral tosubhedral prismatic crystals, silvery white to grayish, white color under vertical reflected light, commonly intergrown with chalcopyrite and especially pyrite.
•
Chalcopyrite (CuFeS) was identified bytetrahedral crystals, often striated, of brass-yellow color, light brass-yellow under vertical reflected light; there was no visible plane rotation under polarized reflected light. In the overall discussion the mining companies were identified by letters rather than by names, hence preserving their legal rights and to avoid ethical issues.
RESULTS AND DISCUSSION
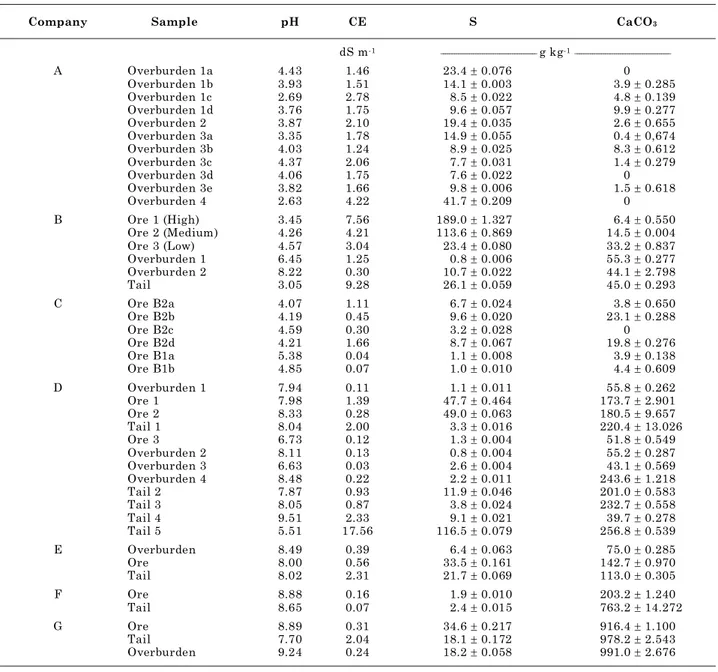
pH, electrolytic conductivity, sulfur and carbonate contents
According to the pH values, the samples were classified in two groups. The first one had low to very low pH values (2.6 to 5.4) and included samples from sites A, B, and C (Table 2), with exception of site B overburdens which presented lower sulfide content and the presence of carbonates. The group formation was corroborated by the microscopic observation of thin sections under high magnification (Figure 1). The low pH suggests the presence of sulfides and, possibly, AMD. The second group, including samples from sites D, E, F, and G, showed
high pH values (> 7.0) due to the substantial presence of carbonates. Among all sites, the highest (9.5) as well as lowest (5.5) pH values were observed in tails from a gold mining site.
The high pH values associated with the presence of carbonates are in agreement with the geology of each area. Samples from sites F and G showed high pH values due to the dominance of carbonates in the limestone and dolomites of the Bambuí Group. Samples from sites D and E showed high pH values ascribed to the presence of carbonates associated to the Banded Iron Formation (BIF) of the Rio das Velhas Supergroup. In such cases, not only calcium (calcite) and magnesium (dolomite), but also iron (siderite) are expected. It is worth mentioning that the presence of siderite in a sample can overrate its neutralization potential (Caruccio and Geidel, 1996).
Higher pH values than expected in a saturated CaCO3
solution in equilibrium with atmospheric CO2 are
probably associated with the presence of salts or hydroxides, arising from the mineral concentration process.
The EC results showed greater variability than pH.
Values ranged from 0.04 dS m-1 in ore B1 from site C
to 17.56 dS m-1 in tailing from site D. The highest
EC values are expected in tailing samples due to the mineral concentration process. In general, EC values are higher in samples containing sulfides and are associated with the AMD process. Sulfide oxidation involves solubilization reactions that increase the ionic activity and, consequently, raise EC values.
Acid base accounting
The different ABA values resulting after subtracting the acidity (AP) from the neutralization potential (NP) (Table 3) only allowed an identification of the AMD potentiality in overburden samples from
Site Ore Sampled material Point of sampling
A Uranium Overburden Surface samples at the bottom, center and top of
the piles.
B Nickel High content, intermediate
and low content ores, overburden and tailing.
Ore and overburden sampled from piles and tailing from tailing ponds.
C Gold Two kinds of non-oxidized ore
B1 and B2
Ore sampled directly from the mining area.
D Gold Ore, tailing and overburden Ore sampled from piles and tailing from tailing
ponds
E Gold Ore, overburden and tailing Ore and overburden sampled from the piles and
tailing from tailing ponds.
F Zinc Ore and tailing Ore and tailing sampled from piles.
G Zinc and lead Ore, overburden and tailing Overburden from piles, ore from the strap loader
and tailing from tailing ponds
site A, ore samples from site C, ore and tail samples from site B, and in an old tail (5) from site D. The ABA estimates resulted in different values of acid drainage potential according to the adopted criteria. Table 3 shows that the total sulfide content criteria resulted in higher ABA values, probably due to the presence of other sulfides such as chalcopyrite (samples from sites B and C), sphalerite (site A) and pentlandite (site B), as well as arsenopyrite (sites A, C, and E) besides pyrrhotites. The presence of such a variety of sulfide minerals, identified by petrographic observation (Figures 2 to 6), may have resulted in overestimated ABA values since the acid generation reactions from these sulfides probably have an stoichiometry other than pyrite. In this
Table 2. pH and electrolytical conductivity values and total sulfur and carbonate content of the materials sampled at each mining company
Company Sample pH CE S CaCO3
dS m-1 ____________________________________________ g kg-1 ____________________________________________
A Overburden 1a 4.43 1.46 23.4 r 0.076 0
Overburden 1b 3.93 1.51 14.1 r 0.003 3.9 r 0.285
Overburden 1c 2.69 2.78 8.5 r 0.022 4.8 r 0.139
Overburden 1d 3.76 1.75 9.6 r 0.057 9.9 r 0.277
Overburden 2 3.87 2.10 19.4 r 0.035 2.6 r 0.655
Overburden 3a 3.35 1.78 14.9 r 0.055 0.4 r 0,674
Overburden 3b 4.03 1.24 8.9 r 0.025 8.3 r 0.612
Overburden 3c 4.37 2.06 7.7 r 0.031 1.4 r 0.279
Overburden 3d 4.06 1.75 7.6 r 0.022 0
Overburden 3e 3.82 1.66 9.8 r 0.006 1.5 r 0.618
Overburden 4 2.63 4.22 41.7 r 0.209 0
B Ore 1 (High) 3.45 7.56 189.0 r 1.327 6.4 r 0.550
Ore 2 (Medium) 4.26 4.21 113.6 r 0.869 14.5 r 0.004
Ore 3 (Low) 4.57 3.04 23.4 r 0.080 33.2 r 0.837
Overburden 1 6.45 1.25 0.8 r 0.006 55.3 r 0.277
Overburden 2 8.22 0.30 10.7 r 0.022 44.1 r 2.798
Tail 3.05 9.28 26.1 r 0.059 45.0 r 0.293
C Ore B2a 4.07 1.11 6.7 r 0.024 3.8 r 0.650
Ore B2b 4.19 0.45 9.6 r 0.020 23.1 r 0.288
Ore B2c 4.59 0.30 3.2 r 0.028 0
Ore B2d 4.21 1.66 8.7 r 0.067 19.8 r 0.276
Ore B1a 5.38 0.04 1.1 r 0.008 3.9 r 0.138
Ore B1b 4.85 0.07 1.0 r 0.010 4.4 r 0.609
D Overburden 1 7.94 0.11 1.1 r 0.011 55.8 r 0.262
Ore 1 7.98 1.39 47.7 r 0.464 173.7 r 2.901
Ore 2 8.33 0.28 49.0 r 0.063 180.5 r 9.657
Tail 1 8.04 2.00 3.3 r 0.016 220.4 r 13.026
Ore 3 6.73 0.12 1.3 r 0.004 51.8 r 0.549
Overburden 2 8.11 0.13 0.8 r 0.004 55.2 r 0.287
Overburden 3 6.63 0.03 2.6 r 0.004 43.1 r 0.569
Overburden 4 8.48 0.22 2.2 r 0.011 243.6 r 1.218
Tail 2 7.87 0.93 11.9 r 0.046 201.0 r 0.583
Tail 3 8.05 0.87 3.8 r 0.024 232.7 r 0.558
Tail 4 9.51 2.33 9.1 r 0.021 39.7 r 0.278
Tail 5 5.51 17.56 116.5 r 0.079 256.8 r 0.539
E Overburden 8.49 0.39 6.4 r 0.063 75.0 r 0.285
Ore 8.00 0.56 33.5 r 0.161 142.7 r 0.970
Tail 8.02 2.31 21.7 r 0.069 113.0 r 0.305
F Ore 8.88 0.16 1.9 r 0.010 203.2 r 1.240
Tail 8.65 0.07 2.4 r 0.015 763.2 r 14.272
G Ore 8.89 0.31 34.6 r 0.217 916.4 r 1.100
Tail 7.70 2.04 18.1 r 0.172 978.2 r 2.543
Overburden 9.24 0.24 18.2 r 0.058 991.0 r 2.676
case, AP estimates of the total S content, after “aqua regia” digestion, were calculated on the basis of pyrite oxidation stoichiometry, as described by Singer & Stumm (1970). On the other hand,
estimates from H2O2 oxidation by the method of
O´Shay et al. (1990) are probably underestimated, due to incomplete sulfide oxidation, as verified by Corrêa et al. (2002). An evaluation of the true potential of generating acid water, the costs and environmental risks must consider the peculiarities of each situation. The actual values probably range somewhere between the estimates of both criteria.
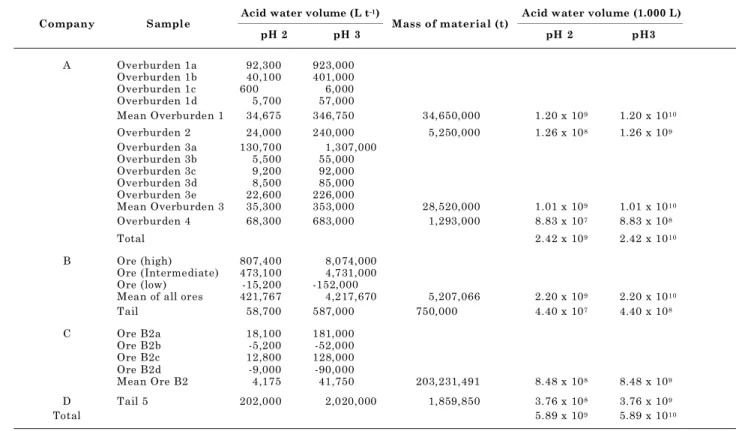
AMD estimates
The ABA values, in mols per metric ton (Table 3) were converted to liters per metric ton of acid water at pH 2.0 or 3.0. The total acid water volumes were calculated from the ABA values versus the mass (in metric tons) of each material (Tables 4 and 5). The calculations were only carried out for samples with an acid drainage potential (i.e., with positive ABA values), taking the mean values of the same materials. Thus, the estimates of acid drainage
reached 13.3 x 10⁹ m3 of acid water at pH 2.0, or
Table 3. Acidity potential (AP) obtained by total S and H2O2 procedures, neutralization potential (NP) and acid-base accounting (ABA) values for different materials sampled at each mining company
AP ABA
Company Sample
Total S H2O2
NP
Total S H2O2
____________________________________________ mol t-1 _______________________________________________________________________________________________
A Overburden 1a 1463 923 0 1463 923
Overburden 1b 881 478 77 804 401
Overburden 1c 531 103 97 434 6
Overburden 1d 600 256 199 401 57
Overburden 2 1213 291 51 1162 240
Overburden 3a 931 1316 9 922 1307
Overburden 3b 556 222 167 389 55
Overburden 3c 481 120 28 453 92
Overburden 3d 475 85 0 475 85
Overburden 3e 613 256 30 583 226
Overburden 4 2606 683 0 2606 683
B Ore (high) 11813 8202 128 11685 8074
Ore (Intermediate) 7100 5020 289 6811 4731
Ore (low) 1463 513 665 798 -152
Overburden 1 50 0 1106 -1056 -1106
Overburden 2 669 555 881 -212 -326
Tail 1631 1487 900 731 587
C Ore B2a 419 256 75 344 181
Ore B2b 600 410 462 138 -52
Ore B2c 197 129 0 197 128
Ore B2d 544 307 397 147 -90
Ore B1a 69 0 79 -10 -79
Ore B1b 63 0 88 -25 -88
D Overburden 1 69 325 1116 - 1047 - 791
Ore 1 2981 814 3475 - 494 - 2661
Ore 2 3063 673 3610 - 547 - 2937
Tail 1 206 359 4408 - 4202 - 4049
Ore 3 81 34 1036 - 955 - 1002
Overburden 2 50 17 1103 - 1053 - 1086
Overburden 3 163 51 862 - 699 - 811
Overburden 4 138 0 4872 - 4734 - 4872
Tail 2 744 0 4019 - 3275 - 4019
Tail 3 238 547 4655 - 4417 - 4108
Tail 4 569 68 794 - 225 - 726
Tail 5 7281 7156 5136 2145 2020
E Overburden 400 0 1499 - 1099 - 1499
Ore 2094 854 2855 -761 -2001
Tail 1356 239 2261 -905 -2022
F Ore 119 0 4064 -3945 -4064
Tail 150 137 15264 -15114 -15127
G Ore 2163 0 18328 -16165 -18328
Tail 1131 0 19564 -18433 -19564
Figure 4. Photomicrograph under reflected light with parallel polarizers showing anhedral crystals of pyrite (py) and ground mass of sphalerite (sl) at the center.
Figure 6. Photomicrograph under reflected light with parallel polarizers. In the picture euhedral arsenopyrite (apy) crystal wrapped in anhedral mass of pyrrhotite (po).
Figura 5. Photomicrograph under transmitted light with parallel polarizers. In the picture subhedral to euhedral arsenopyrite (apy) crystals.
Figure 3. Photomicrograph under reflected light with parallel polarizers. In the picture intergrowing of chalcopyrite (cp), pyrite (py) and arsenopyrite (apy).
Figure 2. Photomicrograph under reflected light with parallel polarizers showing intergrowing of chalcopyrite (cp) droplets in pyrrhotite (po) as anhedral crystals, and magnetite (mg) as anhedral mass.
132.8 x 10⁹ m3 at pH 3.0 according to the calculations,
and considering the total S content extracted by “aqua regia” (Table 4). On the other hand, the hydrogen peroxide criteria presented estimates of around
5.9 x 10⁹ m3 with pH 2.0 or 58.9 x 10⁹ m3 with pH 3.0
(Table 5). The real contribution to the acid drainage generation depends on the different mitigation measures adopted by local companies, as mentioned below.
In the case of site A, mining activities have ceased and acid water arises from the sampled overburdens. Thus, the estimate of acid drainage for site A is
between 2.42 and 5.28 x 10⁹ m3 of acid water at
pH 2.0 or 24.2 to 52.8 x 10⁹ m3 at pH 3.0 (Tables 4
and 5). It is known that the company mitigates the problem by damming and neutralizing the acid water. Besides, the overburden piles were covered with clayey soil to seal them.
Site B has a potential for acid drainage generation
of around 2.24 x 10⁹ m3 of acid water at pH 2.0 or
22.4 x 10⁹ m3 at pH 3.0, according to the lowest
estimate criterion (Table 5). Nevertheless, ore processing at this mine includes a plant for sulphuric acid production, which decreases acid generation by
68.1 %, from 421,767 L t-1 in the ore to 58,700 L t-1
in tailing, according to the lowest estimate at pH 2.0. Calculations of the acid water generation should therefore take into consideration that 46 % of the ore is converted into tailing (Brandt, 1996). Thus, 5,207,066 t of ore produce around 2,395,250 t of tailing and the acid generation potential would be between
185 and 230 millions m3 of water at pH 2.0 or 1.85 to
2.30 x 10⁹ m3 at pH 3.0 (Table 6). Another
Table 4. Acid water generation potential with pH 2.0 and pH 3.0, as estimated by the total sulfide content criteria for different materials sampled at each mining company
Acid water volume (L t-1) Acid water volume (1.000 L)
C ompany Sample
pH 2 pH 3 M ass of materials (t) pH 2 pH3
A Overburden 1a 146,300 1,463,000
Overburden 1b 80,400 804,000
Overburden 1c 43,400 434,000
Overburden 1d 40,100 401,000
Mean Overburden 1 77,550 775,500 34, 650, 000 2.69 x 10⁹ 2.69 x 10¹⁰
Overburden 2 116,200 1,162,000 5,520,000 6.41 x 10⁸ 6.41 x 10⁹
Overburden 3a 92,200 922,000
Overburden 3b 38,900 389,000
Overburden 3c 45,300 453,000
Overburden 3d 47,500 475,000
Overburden 3e 58,300 583,000
Mean Overburden 3 56,440 564,400 28, 520, 000 1.61 x 10⁹ 1.61 x 10¹⁰
Overburden 4 260,600 2,606,000 1,293,600 3.37 x 10⁸ 3.37 x 10⁹
Total 5.28 x 10⁹ 5.28 x 10¹⁰
B Ore (high) 1,168, 500 11, 685, 000
Ore (Intermediate) 681,100 6,811,000
Ore (low) 79,800 798,000
Mean of the ores 643,133 6,431,330 5,207,066 3.35 x 10⁹ 3.35 x 10¹⁰
Tail 73,100 731,000 750,000 5.48 x 10⁷ 5.48 x 10⁸
Ore B2a 34,400 344,000
Ore B2b 13,800 138,000
C Ore B2c 19,700 197,000
Ore B2d 14,700 147,000
Mean Ore B2 20,650 206,500 203,231,491 4.20 x 10⁹ 4.20 x 10¹⁰
D Tail 5 214,500 2,145,000 1,859,850 3.99 x 10⁸ 3.99 x 10⁹
Total 13. 28 x 109 13.28 x 10¹⁰
Table 5. Acid water generation potential with pH 2.0 and pH 3.0, as estimated by the H2O2 digestion criteria for different materials sampled at each mining company
Acid water volume (L t-1) Acid water volume (1.000 L)
Company Sample
pH 2 pH 3
Mass of material (t)
pH 2 pH3
A Overburden 1a 92,300 923,000
Overburden 1b 40,100 401,000
Overburden 1c 600 6,000
Overburden 1d 5,700 57,000
Mean Overburden 1 34,675 346,750 34,650,000 1.20 x 10⁹ 1.20 x 10¹⁰
Overburden 2 24,000 240,000 5,250,000 1.26 x 10⁸ 1.26 x 10⁹
Overburden 3a 130,700 1,307,000
Overburden 3b 5,500 55,000
Overburden 3c 9,200 92,000
Overburden 3d 8,500 85,000
Overburden 3e 22,600 226,000
Mean Overburden 3 35,300 353,000 28,520,000 1.01 x 10⁹ 1.01 x 10¹⁰
Overburden 4 68,300 683,000 1,293,000 8.83 x 10⁷ 8.83 x 10⁸
Total 2.42 x 10⁹ 2.42 x 10¹⁰
B Ore (high) 807,400 8,074,000
Ore (Intermediate) 473,100 4,731,000
Ore (low) -15,200 -152,000
Mean of all ores 421,767 4,217,670 5,207,066 2.20 x 10⁹ 2.20 x 10¹⁰
Tail 58,700 587,000 750,000 4.40 x 10⁷ 4.40 x 10⁸
C Ore B2a 18,100 181,000
Ore B2b -5,200 -52,000
Ore B2c 12,800 128,000
Ore B2d -9,000 -90,000
Mean Ore B2 4,175 41,750 203,231,491 8.48 x 10⁸ 8.48 x 10⁹
D Tail 5 202,000 2,020,000 1,859,850 3.76 x 10⁸ 3.76 x 10⁹
the tails is destined for landfills of the underground mine, jointly with the overburdens. In this situation it is possible that, depending on the physical conditions and mixture quality, the overburden with a negative ABA will further neutralize the acidity tailing causes. Such considerations would suggest a more optimistic estimate of the acid drainage potential at site B (Table 6).
At site C, only ores were sampled, since there were no overburden piles. In this case, the AMD potential depends on the quantities and composition of the ores to be processed, as well as on the sulfide recovery rate during the process. The proportion of each ore type in the blend depends on the gold price, which is rather variable. Nevertheless, a gold price of US$ 325.00 per oz can be assumed. In this case, the blend composition would be 72 % of ore B2 (227,054,880 t) and 24 % of ore B1 (88,299,120 t) to be exploited and processed from 1998 to 2014. Hence, the potential for acid drainage generation would be as shown in Table 7.
Considering a minimum recovery rate of 58 % for sulfides at the “flotation” process, the acid drainage potential at the tailing dam would be only 42 % of the estimate in Table 7. The difference corresponds to the material to be settled in pools, where environmental control measures are strict.
The AMD estimate for site C was 211 x 106 to
4.53 x 10⁹ m3 of acid water at pH 2.0 or 2.11 to
45.3 x 10⁹ m3 at pH 3.0 (Table 7). These values are
lower than the ones established by Pinto and Nepomuceno (1998). The reason for this difference is probably the surface sampling done at the “mining front”. Under such conditions, the B2 samples could be partially oxidized and might not represent the sulfide body as deeper probe sampling would.
At site D, an old tail dam (tail 5) is a potential acid drainage generator (Table 3), estimated similarly
by both criteria at 376 to 399 x 109 m3 of acid water
at pH 2.0 (Table 4 and 5). It is known that the dam is lined with clayey soil and environmental control is probably increasing. Nevertheless, the AMD
Acid water volume (L t-1) Acid water volume (1.000 L)
Sample
pH2 pH3
Mass of materials (t)
pH2 PH3
TSC criteria
B1 -1,750 -17,500 88,299,120 -1.55 x 10⁸ -1.55 x 10⁹
B2 20,650 206,500 227,054,880 4.69 x 10⁹ 4.69 x 10¹⁰
Mean 4.53 x 10⁹ 4.53 x 10¹⁰
H2O2 criteria
B1 -8,350 -83,500 88,299,120 -7.37 x 10⁸ -7.37 x 10⁹
B2 4,175 41,750 227,054,880 9.48 x 10⁸ 9.48 x 10⁹
Mean 2.11 x 10⁸ 2.11 x 10⁹
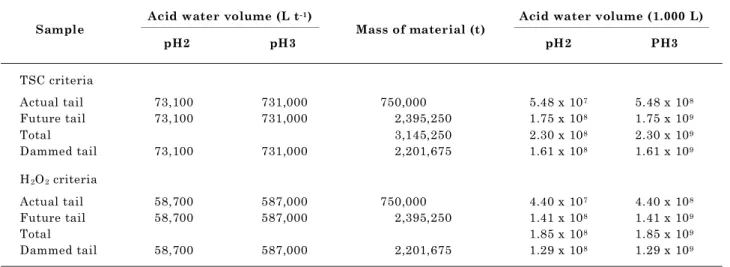
Table 7. Acid water generation potential of company C samples Table 6. Acid water generation potential of company B samples
Acid water volume (L t-1) Acid water volume (1.000 L)
Sample
pH2 pH3
Mass of material (t)
pH2 PH3
TSC criteria
Actual tail 73,100 731,000 750,000 5.48 x 10⁷ 5.48 x 10⁸
Future tail 73,100 731,000 2,395,250 1.75 x 10⁸ 1.75 x 10⁹
Total 3,145,250 2.30 x 10⁸ 2.30 x 10⁹
Dammed tail 73,100 731,000 2,201,675 1.61 x 10⁸ 1.61 x 10⁹
H2O2 criteria
Actual tail 58,700 587,000 750,000 4.40 x 10⁷ 4.40 x 10⁸
Future tail 58,700 587,000 2,395,250 1.41 x 10⁸ 1.41 x 10⁹
Total 1.85 x 10⁸ 1.85 x 10⁹
potential in site D is probably underestimated since there were other tailing pools not sampled in our study. These pools contain around 1,191,105 t of potentially acid generating tailing, as informed by the Minas Gerais Environmental Agency (FEAM).
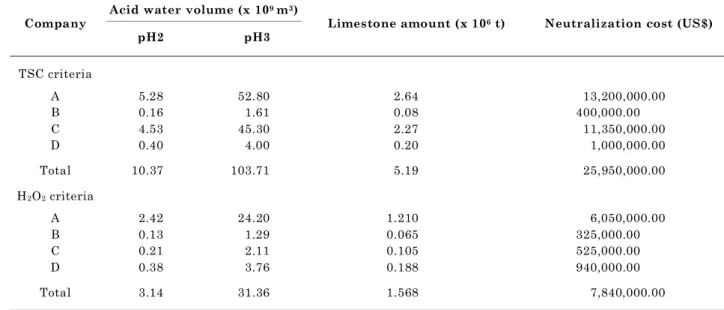
The AMD generation potential for Minas Gerais State is presented in table 8, but it should be kept in mind the limitations and constraints discussed above for each mine. The costs for neutralization with lime, which is the cheapest and most abundantly available neutralizing product, were estimated at
US$ 5.00 t-1. Considering this cost, AMD represents
a potential cost of US$ 7.8 to 25.9 millions to neutralize acidity.
CONCLUSIONS
1. The estimates of the AMD generation potential differ according to the adopted criteria. They are higher when calculated based on the total content of sulfides after “aqua régia” digestion than with the acidity potential (AP) measured after peroxide oxidation. The AP calculated from the total sulfide content is probably overestimated due the presence of other sulfides such as arsenopyrite, calcopyrite, sphalerite, and pentlandite, whose stoichiometry of acid generation differs from that of pyrite. On the other hand, the peroxide analysis probably underestimated AP due to incomplete sulfide oxidation.
2. The results identified four mining sites with potential to generate acid drainage in Minas Gerais.
Acid water volume (x 109m3) Company
pH2 pH3
Limestone amount (x 106 t) Neutralization cost (US$)
TSC criteria
A 5.28 52.80 2.64 13,200,000.00
B 0.16 1.61 0.08 400,000.00
C 4.53 45.30 2.27 11,350,000.00
D 0.40 4.00 0.20 1,000,000.00
Total 10.37 103.71 5.19 25,950,000.00
H2O2 criteria
A 2.42 24.20 1.210 6,050,000.00
B 0.13 1.29 0.065 325,000.00
C 0.21 2.11 0.105 525,000.00
D 0.38 3.76 0.188 940,000.00
Total 3.14 31.36 1.568 7,840,000.00
Table 8. Acid drainage evaluation potential and costs for neutralization based on total sulfide content (TSC) of samples and the H2O2 digestion criteria
Jointly, these activities represent a potential to
generate around 3.14 to 10.37 billions of m3of water
at pH 2 or 31.4 to 103.7 billions of m3 of water at
pH 3. This, in turn, represents costs of US$ 7.8 and 25.9 millions for acidity neutralization with limestone. These quantities are probably underestimated because some mines were not included in the survey, and for other mines, surface samples may not represent the whole picture. A more reliable evaluation of the acid drainage potential at state level would require further studies. These studies must include a larger number of samples from mining operations not considered in this study. They should further consider the kinetics of the acid generation by simulated weathering methods.
ACKNOWLEDGEMENTS
The authors would like to thank FAPEMIG (Minas Gerais Research Foundation Agency) for the financial support of this research, as well as FEAM and the staff of the companies involved in this study. A. Daniel thankfully acknowledges the scholarship granted by CAPES (Brazilian Federal Sponsor).
LITERATURE CITED
BRANDT W. Projeto de aproveitamento de minério B2. Estudo de impacto ambiental, RPM. Paracatu, 1996. 172p. CARUCCIO F.T. Estimating the acid potential of coal mine
refuse. In: CHADWICK, M.J. & GOODMAN, G.T., eds. The ecology of resource degradation and renewal. London, Blacwell Sci. Publ., 1975. p.35-76.
CARUCCIO, F.T & GEIDEL, G. Acid mine drainage, the laboratory & field settings. Knoxville, American Society for Surface Mining and Reclamation, 1996. 58p. CORRÊA, M.L.T.; MELLO, J.W.V.; RIBEIRO, A.C. & COSTA,
L.M. Métodos de análise de sulfetos em amostras de rochas e sedimentos. R. Bras. Ci. Solo, 26:103-115, 2002. EMPRESA BRASILEIRA DE PESQUISA AGROPECUARIA -EMBRAPA. Serviço Nacional de Levantamento e Conservação de Solos. Manual de métodos de análises de solo. Rio de Janeiro,. 1979. Não paginado.
GEIDEL, G. & CARUCCIO, F.T. Geochemical factors affecting coal mine drainage quality. In:. BARNHISEL, R.I.; DARMODY, R.G. & DANIELS, W.L., eds. Reclamation of Drastically Disturbed Lands. Madison, America Society of Agronomy, 2000. p.105-130. (Agronomy Monograph, 41)
GRUBE Jr., W.E.; JENCKS, E.M.; SINGH, R.M.; SMITH, R.M. & WILSON, H.A. Mine spoil potentials for water quality and controlled erosion. USEPA/OWR proj. 14010 E.J.E. Morgantown, West Virginia University, 1971. 128p. KERR, P.F. Optical mineralogy. 4.ed. New York, McGraw
Hill, 492p. 1977.
MELLO, J.W.V. & ABRAHÃO, W.A.P. Geoquímica da drenagem ácida. In: DIAS, L.E. & MELLO, J.W.V., eds. Recuperação de áreas degradadas. Viçosa, Folha de Viçosa, 1998. p.45-58.
MURTHY, A.R.V. & SHARADA, K. Determination of sulphides sulphur in minerals. Analyst, 85:299-300, 1960. NECKERS, J.W. & WALKER, C.R. Field test for active sulfides
in soil. Soil Sci., 74:467-470, 1952.
O’SHAY, T.; HOSSNER, L.R. & DIXON, J.B. A modified hydrogen peroxide oxidation method for determination of potential acidity in pyritic overburden. J. Environ. Qual., 19:778-782, 1990.
PETERSEN, L. Chemical determination of pyrite in soils. Acta Agric. Scand., 19:40-44, 1969.
PINTO, A.C.P. & NEPOMUCENO, A.L. Testes de predição e controle do processo de drenagem ácida na Rio Paracatu Mineração S.A. In: DIAS, L.E. & MELLO, J.W.V., eds. Recuperação de áreas degradadas. Viçosa, Folha de Viçosa, 1998. p. 59-68.
PONS, L.J. A quantitative microscopical method of pyrite determination of soils. In: FONERIUS, A., ed. Soil micromorphology. New York, Elsiever Publ., 1964. p.401-409. RICHARDS, I.G.; PALMER, J.P. & BARRATT, P.A. Water quality. In: The reclamation of former coal mines and steelworks. Amsterdam, 1993. 718p. (Studies in Environmental Science, 56)
SANTANA FILHO, S. Impactos do processo de drenagem ácida sobre recursos hídricos no estado de Minas Gerais. Viçosa, MG, Universidade Federal de Viçosa, 2000. 173p. (Tese ge Mestrado)
SINGER, P.E. & STUMM, W. Acid mine drainage: The rate-determining step. Science, 167:1121-1123, 1970. SKOUSEN J.G.; SEXSTONE, A. & ZIEMKIEWICZ, P.F. Acid
mine drainage control and treatment. In: BARNHISEL, R.I.; DARMODY, R.G. & DANIELS, WL, eds. Reclamation of Drastically Disturbed Lands. America Society of Agronomy, 2000. p.131-168. (Agronomy Monograph, 41) SMITTENBERG, J.; HARMSEN, G.W.; QUISPEL, A. & KEENEY, D.R. Rapid methods for determination different types of sulphur compounds in soil. Plant Soil, 3:353-360, 1951.
SOARES E.R. Mobilidade de metais pesados em materiais provenientes do complexo carboenergético de Candiota-RS. Viçosa, MG, Universidade Federal de Viçosa, 1995. 95p. (Tese de Mestrado)
SOARES, E.R.; MELLO, J.W.V.; COSTA, L.M. & CORRÊA, M.L. Drenagem ácida em materiais provenientes da mineração de carvão de Candiota, RS. Geonomos, 5:67-72, 1997.
SOBEK, A.A.; SCHULLER, W.A.; FREEMAN, J.R. & SMITH, R.M. Field and laboratory methods applicable to overburdens and minesoils. Washington, DC, 1978. EPA-60012-78-034.
SORENSON, D.L.; KNEIB, W.A. & PORCELHA, D.B. Determination of sulfide in pyritic soils and minerals with a sulfide ion electrode. Anal. Chem., 51:1870-1872, 1979. WINCHELL, A.N. Elements of optical Mineralogy. 3.ed. Description of minerals. New York, John Wiley & Sons, 1933. 459p. Part 3.
YONEDA, S. Studies on polder soils in Japan. XVI. Rapid method for determining oxidizable sulfur and change of soil reaction of sea muds and polder soils. Soil Sci. Rep., 17:39-46, 1961.