Can microcystins affect zooplankton structure
community in tropical eutrophic reservoirs?
T. A. S. V. Paes
a,b, I. A. S. Costa
c, A. P. C. Silva
cand E. M. Eskinazi-Sant’Anna
d*
aLaboratory of Limnology, Universidade Federal de Minas Gerais – UFMG, Av. Antônio Carlos, 6627, Pampulha,
CEP 31270-901, Belo Horizonte, MG, Brazil
bPostgraduate Program Ecology of Tropical Biomes, Universidade Federal de Ouro Preto – UFOP,
Campus Morro do Cruzeiro, s/n, CEP 35400-000, Ouro Preto, MG, Brazil
cCentro Biociências, Universidade Federal do Rio Grande do Norte – UFRN, Campus Universitário Lagoa Nova,
CEP 59072-970, Natal, RN, Brazil
dLaboratory of Aquatic Ecology, Evolution and Conservation, Biodiversity, Evolution and Environment Department,
Universidade Federal de Ouro Preto – UFOP, Campus Morro do Cruzeiro, s/n, CEP 35400-000, Ouro Preto, MG, Brazil *e-mail: eskinazi@iceb.ufop.br
Received: October 5, 2014 – Accepted: March 5, 2015 – Distributed: May 31, 2016
(With 5 figures)
Abstract
The aim of our study was to assess whether cyanotoxins (microcystins) can affect the composition of the zooplankton community, leading to domination of microzooplankton forms (protozoans and rotifers). Temporal variations in
concentrations of microcystins and zooplankton biomass were analyzed in three eutrophic reservoirs in the semi-arid northeast region of Brazil. The concentration of microcystins in water proved to be correlated with the cyanobacterial biovolume, indicating the contributions from colonial forms such as Microcystis in the production of cyanotoxins. At the community level, the total biomass of zooplankton was not correlated with the concentration of microcystin (r2 = 0.00; P > 0.001), but in a population-level analysis, the biomass of rotifers and cladocerans showed a weak
positive correlation. Cyclopoid copepods, which are considered to be relatively inefficient in ingesting cyanobacteria,
were negatively correlated (r2
= – 0.01; P > 0.01) with the concentration of cyanotoxins. Surprisingly, the biomass
of calanoid copepods was positively correlated with the microcystin concentration (r2
= 0.44; P > 0.001). The results
indicate that allelopathic control mechanisms (negative effects of microcystin on zooplankton biomass) do not seem
to substantially affect the composition of mesozooplankton, which showed a constant and high biomass compared to
the microzooplankton (rotifers). These results may be important to better understand the trophic interactions between
zooplankton and cyanobacteria and the potential effects of allelopathic compounds on zooplankton.
Keywords: cyanotoxins, microcystin, zooplankton, composition, reservoirs, tropical.
Microcistinas podem afetar a estrutura da comunidade zooplanctônica em
reservatórios eutróficos tropicais?
Resumo
Com o objetivo de avaliar se as cianotoxinas (microcistinas) podem afetar a composição da comunidade zooplanctônica, levando à dominância de formas microzooplanctônicas (protozoários e rotiferos), as variações nas concentrações de microcistina e a biomassa do zooplâncton foram analisadas em três reservatórios eutróficos na região semi-árida do nordeste brasileiro. A concentração de microcistinas na água esteve correlacionada com o biovolume de cianobactérias, indicando a contribuição de formas coloniais como Microcystis na produção de cianotoxinas. A nível de comunidade, a biomassa total do zooplâncton não apresentou correlacão com a concentração de microcistina (r2
= 0.00; P > 0.001), mas
em uma análise a nível de populações, a biomassa de rotíferos e cladóceros apresentou uma fraca correlação positiva. Copépodos Cyclopoida, os quais são considerados relativamente ineficientes na ingestão de cianobactérias, estiveram negativamente correlacionados com a concentração de microcistinas (r2
= - 0.01; P > 0.01). Surpreendentemente, a
biomassa de copépodos Calanoida foi positivamente correlacionada com a concentração de cianotoxinas (r2 = 0.44;
P > 0.001). Os resultados indicam que mecanismos de controle alelopáticos (efeitos negativos da microcistina sobre
o zooplâncton) parecem não afetar substancialmente a composição do mesozooplâncton, que apresentou uma alta e constante biomassa, quando comparada à biomassa do microzooplâncton (rotíferos). Esses resultados podem ser importantes para um melhor entendimento das interações tróficas entre o zooplâncton e cianobactérias, e do efeito
potencial de compostos alelopáticos sobre o zooplâncton.
1. Introduction
Cyanobacteria are a group of prokaryotic microorganisms that reach high levels of biomass and density when they bloom in eutrophic environments (Paerl and Huisman, 2008). One of the reasons suggested to explain this dominance is that morphological and chemical defenses can negatively affect zooplanktonic herbivores (Carmichael, 1992; Chan et al., 2004; Camacho and Thacker, 2006).
Some of the allelopathic compounds (especially cyanotoxins) have shown inhibitory effects on herbivorous
zooplankton (Gliwicz, 1990; Leflaive and Ten-Hage, 2006; Alva-Martinez et al., 2007). The sensitivity to toxic cyanobacteria may vary among zooplankton species and is a function of the capacity to ingest and digest single
cells, colonies, or filaments (Ferrão-Filho and Azevedo,
2003), or of the susceptibility to dissolved and cell-bound toxins (De Mott et al., 1991).
One of the most common cyanotoxins found in eutrophic systems is microcystin, a hepatotoxin produced by certain genera of cyanobacteria such as Microcystis,
Anabaena, Oscillatoria and Nostoc. The majority of studies on the effects of cyanobacteria on the structure of the
zooplankton community have yielded conflicting results,
but in general, they suggest that in systems dominated by cyanobacteria, the zooplankton community is dominated by small cladocerans and rotifers, in response to the toxic
effects of the cyanotoxins, difficulties in ingesting cells, and nutritional deficiency of the food source (Ferrão-Filho et al.,
2000; Hansson et al., 2007).
In some eutrophic reservoirs of the semi arid region
of Brazil (state of Rio Grande do Norte), the zooplankton
community is dominated by the microzooplankton during certain periods of the year (Eskinazi-Sant’Anna et al., 2013). Nevertheless, calanoid copepods also show a high and constant biomass, and in some reservoirs can constitute the dominant mesozooplankton fraction (Sousa et al., 2008). To investigate if the presence of cyanotoxins has some negative effect on the mesozooplankton biomass, we evaluated the seasonal concentration of microcystins and the zooplankton biomass in three eutrophic reservoirs in the Brazilian semi-arid northeast region. We hypothesized that new conceptual frameworks of zooplankton-cyanobacteria interactions may be able to be established on the basis of this study, especially considering that our knowledge of this trophic link is based mainly on the results of laboratory experiments or in situ observations, with the cladoceran
Daphnia as a model, and these cladocerans are in general less abundant in tropical reservoirs. Understanding of the role of natural chemical warfare in structuring mesozooplankton in tropical eutrophic ecosystems could potentially allow generation of new models of zooplankton-cyanobacteria interactions.
2. Material and Methods
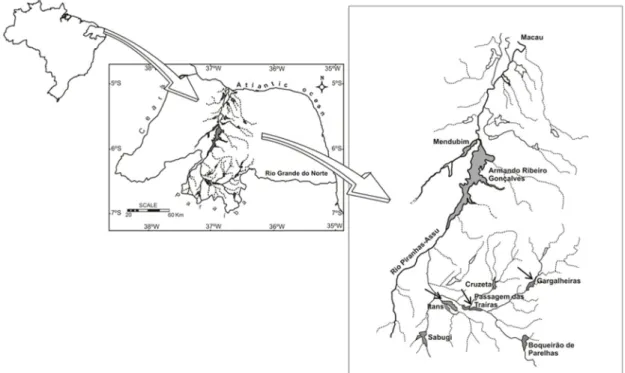
2.1. Study areaThe study was carried out in the Itans (IT), Passagem das Traíras (PST) and Gargalheiras (GAR) reservoirs, all of which are located in the Seridó region of the state of
Rio Grande do Norte (Figure 1).
Figure 1. Location of the study area, and of the Gargalheiras, Itans and Passagem das Traíras Reservoirs (Rio Grande do
IT (06°41’31”S; 36°37’55”W) and PST (06°30’41”S and 36°54’51”W) are shallow, medium-sized reservoirs (IT has
a surface area of 1.340 ha, average depth of 6.10 m and a
maximum depth of 23 m; PST has an area of 1.005 ha and average depth of 4.68 m). IT and PST are reservoirs that support recreational and fishing activities and are impacted
by domestic and agricultural uses in their watersheds. As a consequence, they are undergoing intense eutrophication, mainly due to diffuse nutrient loading from soil erosion and agricultural and urban runoff. Hypereutrophic conditions have been reported in the reservoirs, and algal biomass (Chl a) can exceed 400 μg L–1 (Costa et al., 2006). Among the dominant species of cyanobacteria are Microcystis
protocystis Crow 1923, M. aeruginosa (Kützing) Kützing 1846, M. panniformis Komárek et al. 2002, Geitlerinema
unigranulatum (R.N.Singh) Komárek et Azevedo 2000,
Anabaena circinalis Rabenhorst 1863 and Sphaerocavum
brasiliensis Azevedo et Sant’Anna 2003 (Panosso et al., 2003).
GAR (06°26’11”S; 36°36’17”W) is the smallest (780 ha) reservoir, and is also shallow (5.13 m average depth) and eutrophic. The phytoplankton biomass can surpass 300 μg L–1 and biovolume is usually high (> 100 mm3 L–1), with the occurrence of sporadic toxic blooms of Microcystis protocystis,
M. aeruginosa, Cylindrospermopsis raciborskii, Anabaena
delicatissima and Planktothrix agardhii (Costa et al., 2009). Detailed description of the zooplankton community in
GAR, IT and PST reservoirs can be found in Sousa et al., (2008) and Eskinazi-Sant’Anna et al., (2013).
2.2. Plankton sampling, analysis and microcystin extraction
The sampling was carried out in the months of February, August and November 2008, March and May
2009 (during dry, inter-seasonal and rainy periods), during
three consecutive days in each reservoir. Water transparency
was measured with a Secchi disk. Water samples were obtained through a Van Dorn bottle at a central station of the reservoir (near the dam). During the sampling period, the average depth in the reservoirs was of 4.98 m (GAR), 5.7 m (IT) and 4.55 m (PST). From each water column depth (surface, middle and bottom layers), 10 L of water
was collected and integrated in a bucket, totalizing 30 L of water sample, which was used to measure phytoplankton and chlorophyll a. The choice of the sampling station was
based on the findings of Costa et al., (2009), who described the permanent occurrence of cyanobacterial blooms in the central area of the studied reservoirs.
Concentrations of chlorophyll a were determined with
a Turner TD 700 fluorometer after filtration of the water through fiberglass filters (Whatman 934-AH) and extraction
of the pigments with ethanol at room temperature for approximately 24h (Jespersen and Christoffersen, 1988).
For the phytoplankton analysis, water samples (250 mL)
were preserved in acetic lugol, and counted with the aid of an inverted microscope (Lund et al., 1958). The phytoplankton biovolume was calculated based on geometric models, using the mean dimensions of 25 individuals of the most abundant species (Hillebrand et al., 1999). Taxonomic identification
of the phytoplankton was done using specific literature, such
as Prescott and Vinyard (1982), Komárek and Anagnostidis
(2000), Komárek and Kronberg (2001) and Komárek and
Anagnostidis (2005).
For the detection of the cyanotoxin (microcystins) in
the water, seston samples were obtained by horizontal tows
with a net of 20 µm mesh size equipped with a flowmeter
for water volume estimates. Total intracellular microcystins
were analyzed through ELISA kit (Enzyme-Linked Immune Assay, Envirologix®) method. The extraction was done by
freezing and thawing cycles repeated at least 3 times. Next,
the samples were sonicated in a processor (5 min), and filtered on a glass membrane filter (type GF/C). The samples were
centrifuged for 20 min at 6000 rpm and the supernatant was analyzed. The absorbance of the samples was then determined spectrophotometrically at 450 and 630 nm. Concentration of microcystin in the water (µg.L–1) was obtained by multiplying the values for the volume of water
filtered by the plankton net.
Samples for zooplankton analysis were obtained in
horizontal tows, using a plankton net with 68 µm mesh
equipped with a fluxometer. Before fixation in 4% formol,
carbonated water was added to prevent the organisms from contracting. For the determination of mesozooplankton density
(Cladocera and Copepoda), three 5-mL replicates from the
sample were analyzed under a stereoscopic microscope in
a Bogorov chamber. For rotifers, five 3-mL replicates were analyzed microscopically in a Sedgwick-Rafter chamber with zooplankton identified to the lowest possible taxonomic resolution, using specific literature such as Shiel (1995),
Elmoor-Loureiro (1997), Silva and Matsumura-Tundisi (2005). To estimate the biomass of zooplankton organisms, at least 20 individuals for the most abundant species
(those that comprised at least 5% of the total zooplankton community) and at least 10 individuals for the rare species (those that comprised less than 5% of the total zooplankton community) were measured under an optical microscope (with a graduated ocular). The biomass of rotifers was
calculated based on their geometric shapes, and converted from volume to weight considering 106 µm3 equivalent to 1 µg (Ruttner-Kolisko, 1977). For the calculation of cladoceran and copepod biomass, the regression equation according to Edmondson and Winberg (1971) was used, obtained from the relationship between dry weight and
length of the individuals (Equation 1):
W = a Lb (1)
Where:
- W is the dry weight (µg);
- a and b are constants obtained from the model for the length-weight regression; The constants were obtained from the literature, and derived from tropical freshwater zooplankton species, using the data provided by Bottrel et al. (1976), Saint-Jean and
Bonou (1994), Bouvy et al. (2001) and Brito et al.
(2013).
The dry weight and the data for density were used to estimate the biomass (µg dry weight per m3 - µg DW/m3).
2.3. Statistical analysis
To test the differences in the microcystin concentration between reservoirs and months, we performed a bifactorial
ANOVA followed by Tukey HSD (Honestly Significant Difference) test. The data were transformed to natural
logarithms to satisfy the premises of homogeneity of variances and normality of the analyses. Linear regressions
were used to evaluate the influence of the cyanobacteria and the cyanotoxin (microcystin) on the biomass of the
zooplankton groups. All values for correlation were log (x + 1) transformed prior to analyses to meet normality and
homogeneity of variance assumptions. The significance of the correlations was tested using Student’s t-test.
3. Results
Water transparency was reduced in all the reservoirs,
with the lowest value recorded in IT reservoir (0.77 m), and the maximum of 1.13 m in PST reservoir. High levels of
algal biomass (Chl a) were observed in all three reservoirs,
with minimum of 23.6 µg.L–1 in PST and surpassing 60 µg.L–1 in GAR reservoir. Cyanobacterial biovolume exceeded 19 mm3.L–1 in IT, decreasing in values in GAR
and PST reservoirs (8.30 and 2.37 mm3.L–1, respectively)
(ANOVA, Tukey test, ∝ = 0.05) (Table 1).
Five phytoplankton taxonomic classes (Cyanobacteria, Diatomaceae, Chlorophyceae, Euglenophyceae and
Cryptophyceae) totaling 28 taxa were found in the
reservoirs. The majority of them were cyanobacteria, which
comprised more than 70% of the total phytoplankton,
especially Microcystis aeruginosa (Kützing) Kützing 1846,
Cylindrospermopsis raciborskii Woloszynska) Seenayya et Subba Raju 1972, Anabaena planktonica (Brunnthaler)
Komárek 1958, Aphanizomenon manguinii Bourrelly 1952 and Planktothrix agardii Anagnostidis et Komárek 1988 (Figure 2a, b).
The concentration of microcystin showed wide temporal variation, in bimodal pattern. Peaks of microcystin occurred
in all the reservoirs: one in August (end of rainy season), one in November (dry season) and another in May (end of dry season). It was not very clear the occurrence of a
seasonal variation of microcystin, but in general, highest values were observed during dry season. Microcystin values
ranged from 0.13 μg.L–1 (IT February 2008) to 5.26 μg.L–1
(IT, August 2008) (Figure 3). Microcystin concentration
was slightly higher in Gargalheiras Reservoir (ANOVA,
P< 0.05), averaging 2.33 μg.L–1, while in IT and PST
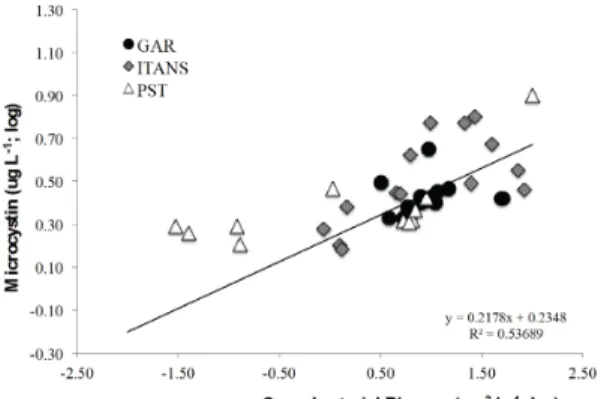
microcystin averaged 1.99 μg.L–1 and 1.95 μg.L–1 respectively. There was a clear positive relationship (r = 0.59; n = 41;
P < 0.05) between the concentration of microcystin and
the biovolume of cyanobacteria, indicating the influence
of the cyanobacterium Microcystis spp. in the production
of algal toxins; this species accounted for up to 70% of
total phytoplankton biomass (Figure 2a, b and Figure 4). The biomass of rotifers and calanoid copepods (Notodiaptomus spp.) was high and relatively constant
in all reservoirs, but especially at IT and PST reservoirs
(Table 2). The calanoid copepod biomass was particularly
high in PST Reservoir, especially in August, slightly exceeding 350.000 μg.DW.m–3. Cladocerans (especially
Diaphanosoma spinulosum Herbst 1975 and Moina minuta
Hansen 1899), contributed very little to zooplankton biomass,
principally in GAR and IT Reservoirs (Table 2). The highest
zooplankton biomass was observed in PST Reservoir in 22/August 2008 (> 600.00 μg.DW.m–3) (Figure 3).
Relating the microcystin concentration to the total biomass of zooplankton for all reservoirs combined did not reveal any clear trend (r = 0.01; P > 0.05; t-test) (Figure 5a). However, when analyzed at the populations level, rotifers and cladocerans showed a weak positive response to microcystin (r2 = 0.29; P < 0.001 and r2 = 0.23;
P < 0.05) (Figure 5b, c). The responses of the cladoceran
species confirmed positive tendencies for a relationship
to microcystin, especially for Diaphanosoma spinulosum (Gargalheiras Reservoir: r = 0.53; P < 0.001; Itans Reservoir: r = 0.52; P > 0.05) and the small cladoceran
(< 200 mm), Moina minuta (Gargalheiras Reservoir:
r = 0.65; P <0.001; Itans Reservoir: r = 0.66; P < 0.05;
PST Reservoir: r = 0.13; P < 0.05). For rotifers, negative
relationships were observed for Brachionus calyciflorus Pallas 1766 in Gargalheiras (r = –0.43; P < 0.05) and Itans
reservoir (r = –0.31; P < 0.05), Conochilus sp. (r = –0.36;
P < 0.001 in Gargalheiras; r = –0.79; P < 0.01 in Itans and
r = –0.35; P = 0.00 in PST reservoir) and Hexarthra sp. (r = –0.56; P = 0.00 in Itans and r = –0.56; P = 0.02 in
PST reservoir) (Table 3).
With respect to the different orders, calanoid copepods showed a positive response to microcystin (r2
= 0.43;
P > 0.001; Figure 5d), whereas small copepods (cyclopoids) showed no response, or a weakly negative response to microcystin (r2
= – 0.01; P > 0.001; Figure 5e).
Table 1. Water transparency (m), Chlorophyll a (µg.L–1) and Cyanobacterial biomass (mm3.L–1) (mean and standard
desviation) in Gargalheiras (GAR), Itans (IT) and Passagem das Trairas (PST) Reservoirs, during the studied period.
Variables Itans PST Gargalheiras ANOVA Tukey test
Mean SD Mean SD Mean SD P ∝ = 0.05
Water transparency (m) 0.77 0.21 1.13 0.15 1.00 0.21 0.001 I<P=G Chlorophyll a (μg.L–1) 55.41 18.61 23.62 16.00 68.55 24.95 0.001 P<I=G Cyanobacterial biomass
(mm3.L–1)
4. Discussion
In general, the studies that describe the trophic interactions between cyanobacteria and zooplankton suggest that herbivores such as Daphnia and calanoid copepods are nutritionally disadvantaged when cyanobacterial blooms occurs, as a result of high density of algae cells, size,
nutritional quality and toxin production (Porter and Orcutt, 1980; Lürling, 2003; Sarnelle et al., 2010; O’Farrell et al., 2012; Chislock et al., 2013). The understanding of the processes that regulate this trophic link is fundamental to allow the prediction of the events in a trophic cascade and for the establishment of mechanisms to control algal blooms, particularly for the selection of natural agents
Figure 2. Phytoplankton relative abundance (%) and Cyanobacteria composition (%) in IT, PST and GAR Reservoirs from
that make it possible to efficiently remove these cells
from the water.
Commonly, zooplankton shows a strong negative response to the presence of cyanotoxins, which may be
more or less significant, depending on the taxonomic group. In our study, calanoid copepods showed a significant
positive response to the concentration of microcystin, in contrast to reports that indicate that the density and
Figure 3. Microcystin concentration (µg.L–1) and biomass (µg.DW.m–3) of the major zooplankton groups in Gargalheiras,
biomass of these herbivores is reduced as algal blooms become established (Sarnelle, 1993; DeMott et al., 1991; Hansson et al., 2007). One of the mechanisms that would explain this reduction in the biomass of these herbivores could be the strong feeding limitation associated with the high abundance of the cyanobacteria and the production of cyanotoxins.
In the reservoirs studied here, under the effect of a moderate concentration of cyanotoxins (<10 ug.L–1), continuously high biomass of calanoid copepods was observed. The occurrence of calanoid copepods in eutrophic environments has been associated with an increase in food availability (Ferrão-Filho et al., 2002), and their dominance in environments dominated by cyanobacteria blooms has attracted the interest of researchers, who have attempted to determine whether or not they are capable of using cyanobacteria as a food source (de Bernardi and
Figure 4. Relationship between total cyanobacterial biovolume (log; µm3.L–1) and microcystin concentration
(log; µg.L–1) (r2 = 0.53; n = 35; P < 0.05).
Figure 5. The relationships between microcystin concentration (log; µg.L–1) and total zooplankton biomass (log; µg.DW.m-3)
(A: r2 = 0.00; P > 0.05;) and major zooplanktonic groups biomass (log; µg.DW.m–3) at class level rotifers (B: r2 = 0.29; P < 0.001), cladocerans (C: r2
= 0.23; P < 0.05), Calanoid copepods (D: r2
Giussani, 1990). Panosso et al. (2003) demonstrated, by means of experimental studies, that Notodiaptomus
iheringi (Wright S. 1935) is capable of utilizing small colonies and filaments of cyanobacteria as a food source.
The ability to utilize this food resource also may be favored in environments where the abundance of other food resources such as chlorophyceans and diatoms is reduced (Work and Havens, 2003).
The effects of cyanobacteria on zooplankton communities
may also be influenced by evolutionary mechanisms in
natural systems that have a long history of cyanobacterial blooms (Gilbert, 1990; Gustafsson and Hansson, 2004). Populations of zooplankton that co-occur with dense
cyanobacterial populations may be better able to digest cyanobacteria than are unexposed zooplankton (Sarnelle and Wilson, 2005). The studied reservoirs (GAR, IT
and PST) are characterized as eutrophic, with records of
continuous cyanobacterial blooms, which could explain the maintenance of high biomass of calanoid copepods despite high concentrations of cyanotoxins.
In addition to the calanoid copepods, the microzooplankton, represented by rotifers, also showed a high biomass and a weak positive correlation with cyanotoxins. Although negative effects on rotifers have been recorded in systems
dominated by cyanobacteria, contributing to a significant
suppression of the rotifer biomass (Nandini and Rao, 1998),
Table 2. Correlations values (Pearson’s r) to species level of zooplankton biomass (µg.DW.m–3) and microcystin (µg.L–1).
Zooplankton Taxa Reservoirs
Gargalheiras Itans Passagem das Traíras
ROTIFERA r2 = 0.00; n = 9; P > 0.05 r2 = 0.00; n = 14; P = 0.00 r2 = 0.21; n = 15; P <0.05
Brachionus calyciflorus r2 = 0.18; n = 4; P < 0.05 r2 = 0.10; n = 11; P > 0.05 r2 = 0.56; n = 7; P <0.05
Conochylus sp. r2 = 0.22; n = 4; P = 0.00 r2 = 0.75; n = 7; P < 0.05 r2 = 0.17; n = 6; P <0.05
Filinia sp. (F. opoliensis + F. longiseta)
r2
= 0.50; n = 4; P < 0.001 r2
= 0.57; n = 6; P < 0.01 r2
= 0.11; n = 5; P <0.01
Hexarthra sp. r2 = 0.30; n = 15; P < 0.01 r2 = 0.49; n = 4; P < 0.05 r2 = 0.30; n = 11; P = 0.02
CLADOCERA r2
= 0.32; n = 5; P < 0.05 r2
= 0.57; n = 16; P < 0.05 r2
= 0.11; n = 15; P <0.01
Ceriodaphnia cornuta r2
= 0.44; n = 5; P < 0.001 r2
= 0.43; n = 12; P <0.01 r2
= 0.02; n = 14; P = 0.00
Diaphanosoma spinulosum
r2
= 0.05; n = 6; P = 0.00 r2
= 0.50; n = 11; P <0.01 r2
= 0.02; n = 14; P = 0.00
Moina minuta r2
= 0.15; n = 5; P > 0.05 r2
= 0.55; n = 12; P <0.01 r2
= 0.20; n = 12; P <0.05
COPEPODA (Calanoid) r2
= 0.05; n = 11; P >0.05 r2
= 0.00; n = 14; P > 0.05 r2
= 0.05; n = 13; P = 0.00 COPEPODA
(Cyclopoid)
r2
= 0.00; n = 11; P = 0.00 r2
= 0.02; n = 14; P = 0.00 r2
= 0.25; n = 15; P > 0.05
ZOOPLANKTON TOTAL
r2
= 0.02; n =11; P = 0.00 r2
= 0.66; n = 14; P <0.05 r2
= 0.00; n = 15; P = 0.00
Table 3. Correlations values (Pearson’s r) to most abundant taxa of zooplankton biomass (µg.DW.m–3) and microcystin
(µg.L–1) in Gargalheiras (GAR), Itans (IT) and Passagem das Traíras (PST) Reservoirs.
Zooplankton Taxa Reservoirs
GAR IT PST
ROTIFERA r2 = 0.00; n = 9; P > 0.05 r2 = 0.00; n = 14; P = 0.00 r2 = 0.21; n = 15; P <0.05
Brachionus calyciflorus r2
= 0.18; n = 4; P < 0.05 r2
= 0.10; n = 11; P > 0.05 r2
= 0.56; n = 7; P <0.05
Conochylus sp. r2
= 0.22; n = 4; P = 0.00 r2
= 0.75; n = 7; P < 0.05 r2
= 0.17; n = 6; P <0.05
Filinia sp. (F. opoliensis + F. terminalis)
r2
= 0.50; n = 4; P < 0.001 r2
= 0.57; n = 6; P < 0.01 r2
= 0.11; n = 5; P <0.01
Hexarthra sp. r2
= 0.30; n = 15; P < 0.01 r2
= 0.49; n = 4; P < 0.05 r2
= 0.30; n = 11; P = 0.02
CLADOCERA r2
= 0.32; n = 5; P < 0.05 r2
= 0.57; n = 16; P < 0.05 r2
= 0.11; n = 15; P <0.01
Ceriodaphnia cornuta r2
= 0.44; n = 5; P < 0.001 r2
= 0.43; n = 12; P <0.01 r2
= 0.02; n = 14; P = 0.00
Diaphanosoma
spinulosum r
2
= 0.05; n = 6; P = 0.00 r2
= 0.50; n = 11; P <0.01 r2
= 0.02; n = 14; P = 0.00
Moina minuta r2
= 0.15; n = 5; P > 0.05 r2
= 0.55; n = 12; P <0.01 r2
= 0.20; n = 12; P <0.05
COPEPODA (Calanoid) r2 = 0.05; n = 11; P >0.05 r2= 0.00; n = 14; P > 0.05 r2 = 0.05; n = 13; P = 0.00 COPEPODA
(Cyclopoid)
r2 = 0.00; n = 11; P = 0.00 r2 = 0.02; n = 14; P = 0.00 r2 = 0.25; n = 15; P > 0.05
ZOOPLANKTON TOTAL
experimental studies in tropical systems have recorded that rotifers (mainly Brachionus) can show high abundances in conditions of dominance of Cylindrospermopsis, but can be profoundly affected in situations of dominance of
Microcystis, making difficult the search for generalized
patterns for microzooplankton trophic interactions with cyanobacteria (Soares et al., 2010).
Cladocerans appear to be harmed the most by cyanobacterial blooms (Hansson et al., 2007), because they can be affected as much by the toxic effect of the cyanotoxins as by the clogging of the buccal apparatus by large algal colonies (Fernandez et al., 2012). Cyanobacteria are commonly believed to strongly inhibit large cladocerans and thus improve the competitive ability of small-bodied cladocerans (Sun et al., 2012). Guo and Xie (2006) found that small-bodied cladocerans develop some tolerance to toxic strains of cyanobacteria, while Davis and Gobler
(2011) observed in a lake with cyanobacteria blooms, extremely small numbers of large-bodied cladocerans such as Daphnia and larger numbers of small cladocerans (Bosmina and Moina) that were capable of consuming toxic as well as non-toxic strains of cyanobacteria. Our results suggest that in conditions of eutrophy and frequent cyanobacterial blooms, smaller and medium-sized species of cladocerans such as Moina minuta (usually < 1.3 mm) and Diaphanosoma spinulosum (< 1.5 mm), succeed in
being less negatively influenced by the cyanobacteria, and
maintain a high and constant biomass. This result could indicate an ability of these small cladocerans to exploit additional food resources available in organically enriched systems. Bacteria can represent an important food source for cladocerans in eutrophic lakes (Agasild and Nõges, 2005), and decomposed Microcystis can also be effectively used by cladocerans as a source of food (Chen and Xie, 2003).
An important factor that can increase the abundance of smaller forms of zooplankton in eutrophic systems may
be the effect of selective predation by planktophagous fish.
Although this information was not included in the present study, previous reports (Attayde et al., 2007) showed that the Nile tilapia (Oreochromis niloticus Linnaeus, 1758), which is present in all the reservoirs studied, can have a strong negative effect not only directly on the zooplankton abundance but also indirectly, in affecting the recruitment
of other planktophagous fishes that orient visually to locate
and capture their prey. These effects can favor, and explain the maintenance, of the high biomass of large herbivores such as the calanoid copepods in these reservoirs.
The results obtained in the present study suggest that
the presence of microcystins does not have a large influence
on the reduction of zooplankton biomass in tropical,
eutrophic reservoirs. Studies considering the possibility of
the formation of genotypes that are resistant to microcystin and on the feeding behavior of these metazoans should be undertaken to elucidate this question. These responses can provide important information about the future use of biomanipulation for the control of algal blooms in eutrophic reservoirs of the semi-arid zone of the Brazilian northeast, and add new trophic routes to the complex interaction between zooplankton and cyanobacteria.
Acknowledgements
The authors are grateful to Edson Santana for field and
laboratory assistance and to LAMAQ (Laboratory of
Microorganisms) from UFRN for use of its facilities.
The authors are grateful to the National Counsel of
Technological and Scientific Development for financial support (CNPq – 474228/03-7) and Brazilian Coordination
for the Improvement of Higher Education Personnel
(CAPES) for a Master fellowship to PAES, TSV. We thank
Dr. Janet Reid for English corrections and suggestions.
This manuscript benefited from comments by anonymous
referees. This research was supported by a grant from
CNPq to Eskinazi-Sant’Anna, EM.
References
AGASILD, H. and NÕGES, T., 2005. Cladoceran and rotifer grazing on bacteria and phytoplankton in two shallow eutrophic lakes: in situ measurement with florescent microspheres. Journal of Plankton Research, vol. 27, pp. 1155-1174. http://dx.doi. org/10.1093/plankt/fbi080.
ALVA-MARTINEZ, A.E., SARMA, S.S.S. and NANDINI, S., 2007. Effect of mixed diets (cyanobacteria and green algae) on the population growth of the cladocerans Ceriodaphnia dubia and Moina macrocopa. Aquatic Ecology, vol. 41, pp. 579-585. http://dx.doi/10.1007/s10452-007-9115-1.
ATTAYDE, J.L., OKUN, N., BRASIL, J., MENEZES, R. and MESQUITA, P., 2007. Impacts of the nile tilapia (Oreochromis niloticus) introduction on the trophic structure of the aquatic ecosystems of the caatinga biome. Oecologia Brasiliensis, vol. 11, no. 3, pp. 450-461. http://dx.doi.org/10.4257/oeco.2007.1103.13. BOTTREL, H.H., DUNCAN, A., GLIWICZ, Z.M., GRYGIEREK, E., HERZIG, A., HILLBRICHT-ILKOWSKA, A., KURASAWA, H., LARSSON, P. and WEGLENSKA, T., 1976. A review of some problems in zooplankton production studies. Norwegian Journal of Zoology, vol. 24, pp. 419-456.
BOUVY, M., PAGANO, M. and TROUSSELLIER, M., 2001. Effects of a cyanobacterial bloom (Cylindrospermopsis raciborskii) on bacteria and zooplankton communities in Ingazeira reservoir (northeast Brazil).Aquatic Microbial Ecology, vol. 25, pp. 215-227. http://dx.doi.org/10.3354/ame025215.
BRITO, S.L., MAIA-BARBOSA, P.M. and PINTO-COELHO, R.M., 2013. Length-weight relationships and biomass of the main microcrustacean species of two large tropical reservoirs in Brazil. Brazilian Journal of Biology, vol. 73, no. 3, pp. 593-604. http:// dx.doi.org/10.1590/S1519-69842013000300017.
CAMACHO, F.A. and THACKER, R.W., 2006. Amphipod herbivory on the freshwater cyanobacterium Lyngbia wollei: chemical stimulants and morphological defenses. Limnology and Oceanography, vol. 51, no. 4, pp. 1870-1875. http://dx.doi. org/10.4319/lo.2006.51.4.1870.
CARMICHAEL, W.W., 1992. Cyanobacteria secondary metabolites: the cyanotoxins. The Journal of Applied Bacteriology, vol. 72, no. 6, pp. 445-459. http://dx.doi.org/10.1111/j.1365-2672.1992. tb01858.x. PMid:1644701.
grazing. Limnology and Oceanography, vol. 49, no. 6, pp. 2171-2178. http://dx.doi.org/10.4319/lo.2004.49.6.2171.
CHEN, F.Z. and XIE, P., 2003. The effects of fresh and decomposed Microcystis aeruginosa on cladocerans from a subtropic Chinese lake.Journal of Freshwater Ecology, vol. 18, no. 1, pp. 91-104. http://dx.doi.org/10.1080/02705060.2003.9663955.
CHISLOCK, M.F., SARNELLE, O., JERNIGAN, L.M. and WILSON, A.E., 2013. Do high concentrations of microcystin prevent Daphnia control of phytoplankton? Water Research, vol. 47, no. 6, pp. 1961-1970. http://dx.doi.org/10.1016/j. watres.2012.12.038. PMid:23395484.
COSTA, I.A., AZEVEDO, S.M.F.O., SENNA, P.A., BERNARDO, R.R., COSTA, S.M. and CHELLAPPA, N.T., 2006. Occurrence of toxin-producing cyanobacteria blooms in a Brazilian semiarid reservoir. Brazilian Journal of Biology = Revista Brasileira de Biologia, vol. 66, no. 1b, pp. 211-219. http://dx.doi.org/10.1590/ S1519-69842006000200005. PMid:16710515.
COSTA, I.A., CUNHA, S.R.S., PANOSSO, R. and ARAÚJO, M.F., MELO, J.L.S. and ESKINAZI-SANT’ANNA, E.M., 2009. Dinâmica de cianobactérias em reservatórios eutróficos do semi-árido do Rio Grande do Norte. Oecologia Brasiliensis, vol. 13, no. 2, p. 382-401. http://dx.doi.org/10.4257/oeco.2009.1302.11. DAVIS, T.W. and GOBLER, C.J., 2011. Grazing by mesozooplankton and microzooplankton on toxic and non-toxic strains of Microcystis in the Transquaking River, a tributary of Chesapeake Bay.Journal of Plankton Research, vol. 33, no. 1, pp. 415-430. http://dx.doi. org/10.1093/plankt/fbq109.
DE BERNARDI, R. and GIUSSANI, G., 1990. Are blue-green algae a suitable food for zooplankton? An overview. Hydrobiologia, vol. 200-201, no. 1, pp. 29-41. http://dx.doi.org/10.1007/BF02530326. DEMOTT, W.R., ZHANG, Q.X. and CHARMICHAEL, W.W., 1991. Effects of toxic cyanobacteria and purified toxins on the survival and feeding of copepod and three species of Daphnia. Limnology and Oceanography, vol. 36, no. 7, pp. 1346-1357. http://dx.doi.org/10.4319/lo.1991.36.7.1346.
EDMONDSON, W.T. and WINBERG, G.G., 1971.A manual on methods for the assessment of secondary productivity in fresh waters. Oxford: Blackwell. 500 p.
ELMOOR-LOUREIRO, L.M.A., 1997. Manual de identificação dos cladóceros límnicos do Brasil. Brasília: Universa. 156 p. ESKINAZI-SANT’ANNA, E.M., MENEZES, R., COSTA, I.A.S., ARAÚJO, M., PANOSSO, R. and ATTAYDE, J.L., 2013. Zooplankton assemblages in eutrophic reservoirs of the Brazilian semi-arid. Brazilian Journal of Biology, vol. 73, no. 1, p. 1-12. http://dx.doi.org/10.1590/S1519-69842013000100006. FERNANDEZ, R., NANDINI, S. and SARMA, S., 2012. A comparative study on the ability of tropical micro-crustaceans to feed and grow on cyanobacterial diets.Journal of Plankton Research, vol. 34, no. 8, pp. 719-731. http://dx.doi.org/10.1093/ plankt/fbs040.
FERRÃO-FILHO, A.S. and AZEVEDO, S.M.F.O., 2003. Effects of unicellular and colonial forms of Microcystis aeruginosa from laboratory cultures and natural populations on two tropical cladocerans.Aquatic Ecology, vol. 37, no. 1, pp. 23-35. http:// dx.doi.org/10.1023/A:1022133329940.
FERRÃO-FILHO, A.S., AZEVEDO, S.M.F.O. and DEMOTT, W., 2000. Effects of toxic and non-toxic cyanobacteria on the life history of tropical and temperate cladocerans. Freshwater
Biology, vol. 45, no. 1, pp. 1-19. http://dx.doi.org/10.1046/j.1365-2427.2000.00613.x.
FERRÃO-FILHO, A.S., DOMINGOS, P. and AZEVEDO, S.M.F.O., 2002. Influences of a Microcystis aeruginosa KOTZING bloom on zooplankton populations in Jacarepaguá Lagoon (Rio de Janeiro, Brazil). Limnologica, vol. 32, no. 4, pp. 295-308. http://dx.doi. org/10.1016/S0075-9511(02)80021-4.
GILBERT, J.J., 1990. Differential effects of Anabaena affınis on cladocerans and rotifers: mechanisms and implications. Ecology, vol. 71, no. 5, pp. 1727-1740. http://dx.doi.org/10.2307/1937581. GLIWICZ, Z.M., 1990. Why do cladocerans fail to control algal blooms? Hydrobiologia, vol. 200/201, no. 1, pp. 83-97. http:// dx.doi.org/10.1007/BF02530331.
GUO, N. and XIE, P., 2006. Development of tolerance against toxic Microcystis aeruginosa in three cladocerans and the ecological implications.Environmental Pollution, vol. 143, no. 3, pp. 513-518. http://dx.doi.org/10.1016/j.envpol.2005.11.044. PMid:16448731. GUSTAFSSON, S. and HANSSON, L.A., 2004. Development of tolerance against toxic cyanobacteria in Daphnia. Aquatic Ecology, vol. 38, no. 1, p. 37-44. http://dx.doi.org/10.1023/ B:AECO.0000020985.47348.5e.
HANSSON, L.A., GUSTAFSSON, S., RENGEFORS, K. and BOMARK, L., 2007. Cyanobacterial chemical warfare affects zooplankton community composition. Freshwater Biology, vol. 52, no. 7, pp. 1290-1301. http://dx.doi.org/10.1111/j.1365-2427.2007.01765.x.
HILLEBRAND, H., DÜRSELEN, C.D., KIRSCHTEL, D., POLLINGHER, U. and ZOHARY, T., 1999. Biovolume calculation for pelagic and benthic microalgae. Journal of Phycology, vol. 35, no. 2, pp. 403-424. http://dx.doi.org/10.1046/j.1529-8817.1999.3520403.x.
JESPERSEN, A.M. and CHRISTOFFERSEN, K., 1988. Measurements of chlorophyll a from phytoplankton using ethanol as extraction solvent. Archive für Hydrobiologie, vol. 109, no. 3, pp. 445-454. KOMÁREK, J. and ANAGNOSTIDIS, K., 2000. Cyanoprokaryota: Chroococcales. In: H. ETTL, G. RTNET, H. HEYNIG, and D. MOLLENHAUER, eds. Sü wasserflora von Mitteleuropa. Stuttgart: Gustav Fischer. pp. 1-658.
KOMÁREK, J. and ANAGNOSTIDIS, K., 2005. Cyanoprokariota: Oscillatoriales. In: H. ETTL, G. RTNET, H. HEYNIG, and D. MOLLENHAUER, eds. Sü wasserflora von Mitteleuropa. Stuttgart: Gustav Fischer. pp. 1-759.
vol. 18, no. 3, pp. 202-210. http://dx.doi.org/10.1002/tox.10115. PMid:12740806.
NANDINI, S. and RAO, T.R., 1998. Somatic and population growth in selected cladoceran and rotifer species offered the cyanobacterium Microcystis aeruginosa food.Aquatic Ecology, vol. 31, no. 3, pp. 283-298. http://dx.doi.org/10.1023/A:1009940127959. O’ FARRELL, I., BORDET, F. and CHAPARRO, G., 2012. Bloom forming cyanobacterial complexes co-occurring in a subtropical large reservoir: validation of dominant eco-strategies. Hydrobiologia, vol. 698, no. 1, pp. 175-190. http://dx.doi. org/10.1007/s10750-012-1102-4.
PAERL, H.W. and HUISMAN, J., 2008. Blooms like it hot. Science, vol. 320, no. 5872, pp. 57-58. http://dx.doi.org/10.1126/ science.1155398. PMid:18388279.
PANOSSO, R., CARLSON, P. and KOZLOWSKY-SUZUKI, B., AZEVEDO, S.M.F.O. and GRANÉLI, E., 2003. Effect of grazing by a neotropical copepod, Notodiaptomus, on a natural cyanobacterial assemblage and on toxic and non-toxic cyanobacteria strains. Journal of Plankton Research, vol. 25, no. 9, pp. 1169-1175. http://dx.doi.org/10.1093/plankt/25.9.1169.
PORTER, K.G. and ORCUTT, J.D., 1980. Nutritional adequacy, manageability and toxicity as factors that determine the food quality of green and blue-green algae for Daphnia. In: W.G. KERFOOT, ed. Evolution and Ecology of Zooplankton Communities. London: University of New England Press. p. 345-398.
PRESCOTT, G.W. and VINYARD, W.C., 1982. A synopsis of North American Desmids. Nebraska: University of Nebraska. RUTTNER-KOLISKO, A., 1977. Suggestions for biomass calculation of plankton rotifers.Archiv für Hydrobiologie, no. 8, pp. 71-76.
SAINT-JEAN, L. and BONOU, C.A., 1994. Growth, production, and demography of Moina micrura in brackish tropical fish ponds (Layo, Ivory Coast). Hydrobiologia, vol. 272, pp. 125-146. http:// dx.doi.org/10.1007/978-94-011-0884-3-10.
SARNELLE, O. and WILSON, A.E., 2005. Local adaptation of Daphnia pulicaria to toxic cyanobacteria.Limnology and Oceanography, vol. 34, no. 5, pp. 673-687.
SARNELLE, O., 1993. Hervibore effects on phytoplankton succession in a eutrophic lake. Ecological Monographs, vol. 63, no. 2, pp. 129-149. http://dx.doi.org/10.2307/2937177. SARNELLE, O., GUSTAFSSON, S. and HANSSON, A., 2010. Effects of cyanobacteria on fitness components of the herbivore Daphnia.Journal of Plankton Research, vol. 32, no. 4, pp. 471-477. http://dx.doi.org/10.1093/plankt/fbp151.
SHIEL, R.J., 1995. A guide to identification of rotifers, cladocerans and copepods from Australian inland waters. Albury: Cooperative Research Center for Freshwater Ecology. 150 p. Identification guide, no. 3.
SILVA, W.M. and MATSUMURA-TUNDISI, T., 2005. Taxonomy, ecology, and geographical distribution of the species of the genus Thermocyclops Kiefer, 1927 (Copepoda, Cyclopoida) in São Paulo State, Brazil, with description of a new species. Brazilian Journal of Biology = Revista Brasileira de Biologia, vol. 65, no. 3, pp. 521-531. http://dx.doi.org/10.1590/S1519-69842005000300018. PMid:16341431.
SOARES, M.C.S., LURLING, M. and HUSZAR, V.L.M., 2010. Responses of the rotifer Brachionus calyciflorus to two tropical toxic cyanobacteria (Cylindrospermopsis raciborskii and Microcystis aeruginosa) in pure and mixed diets with green algae.Journal of Plankton Research, vol. 32, no. 7, pp. 999-1008. http://dx.doi. org/10.1093/plankt/fbq042.
SOUSA, W., ATTAYDE, J.L., ROCHA, E. and ESKINAZI-SANT’ANNA, E.M., 2008. The response of zooplankton assemblages to variations in the water quality of four man-made lakes in semi-arid northeastern Brazil. Journal of Plankton Research, vol. 30, no 6, pp. 699-708. http://dx.doi.org/10.1093/plankt/fbn032. SUN, X., TAO, M., QIN, B., QI, M., NIU, Y., ZHANG, J., MA, Z. and XIE, P., 2012. Large-scale field evidence on the enhancement of small-sized cladocerans by Microcystis blooms on Lake Taihu, China. Journal of Plankton Research, vol. 34, no. 3, pp. 853-863. http://dx.doi.org/10.1093/plankt/fbs047.