Received December 5, 2007 and accepted August 18, 2008. Corresponding author: [email protected]
* Current address: Departamento de Zootecnia e Extensão Rural da UFMT.
ISSN 1516-3598 (impresso) ISSN 1806-9290 (on-line) www.sbz.org.br
Influence of intraruminal infusion of propionic acid and forage to concentrate
levels on intake, digestibility and rumen characteristics in young bulls
1Marinaldo Divino Ribeiro2*, José Carlos Pereira3, Augusto César de Queiroz3, Vitor Pereira Bettero4, Hilário Cuquetto Mantovani5, Cássio José da Silva2
1Trabalho financiado pelo CNPq.
2Programa de Pós-Graduação em Zootecnia - UFV. 3Departamento de Zootecnia - UFV. Pesquisador do CNPq. 4Curso de graduação em Zootecnia - UFV.
5Departamento de Microbiologia - UFV.
ABSTRACT - This study aimed to evaluate the effect of intraruminal infusion of propionic acid (RPA) associated
to two (80:20 and 60:40) forage:concentrate ratios (FCR), for young bulls. Four Holstein × Zebu crossbred young bulls with average age of 7 months and 160 kg of body weight (BW) were distributed to a 4 × 4 Latin square design. A total mixed ration, isonitrogenous diets, was ad libitum fed to animals. The propionic acid was obtained by fermentation of
reconstituted milk whey by the consortium of bacteria Enterococcus sp. and Veillonella sp.. Daily and along with the supply of solid feeds, 2 L of the compound containing propionic acid were intrainfused in the rumen. There was no RPA × FCR interaction for the intake of nutrients, except for total digestible nutrients (TDN). The organic matter (OM), crude protein (CP), ether extract (EE), neutral detergent fiber (NDF) and TDN intakes were influenced by the FCR. There was no RPA × FCR interaction on the total digestibility of DM, OM, CP, EE, NDF and TC. However, the digestibility of DM, OM, EE and CT were influenced by the FCR. There was no RPA × FCR interaction for the mean N-NH3 concentration and pH of the rumen fluid; however, RPA provided effect on the pH measured 4 hours after meal. There was no interaction or effect of the main factors on volatile fatty acids concentrations in the rumen fluid, or on glucose levels and serum urea nitrogen.
Key Words: bacteria ruminal, digestibility, feeding, milk whey, organic acids
Influência da infusão ruminal de ácido propiônico e da relação volumoso:
concentrado sobre o consumo e digestibilidade e características ruminais
em novilhos
RESUMO - Objetivou-se avaliar o efeito da infusão ruminal de ácido propiônico (APR) associado a dietas em mistura completa com duas relações volumoso:concentrado (RVC), 80:20 e 60:40 (% da MS), para novilhos. Foram utilizados quatro novilhos mestiços, Holandês × Zebu, com idade média de 7 meses e 160 kg de peso vivo, distribuídos em delineamento experimental quadrado latino. As dietas foram isoprotéicas e os animais alimentados à vontade, na forma de ração em mistura completa. O ácido propiônico foi produzido por fermentação do soro de leite reconstituído, pelo consórcio das bactérias Enterococcus sp. e Veillonella sp. Diariamente e junto ao fornecimento dos alimentos sólidos, infundiram-se no rúmen 2 L do composto contendo ácido propiônico. Não houve interação APR × RVC para os consumos de nutrientes, exceto nutrientes digestíveis totais (NDT). Os consumos de matéria orgânica (MO), proteína bruta (PB), extrato etéreo (EE), fibra em detergente neutro (FDN) e NDT foram influenciados pela relação volumoso:concentrado utilizada. Não houve interação APR × RVC para as digestibilidades totais de MS, MO, PB, EE, FDN e CT. Todavia, as digestibilidades de MS, MO, EE e CT foram influenciadas pela relação volumoso:concentrado. Não houve interação APR × RVC para as concentrações médias de N-NH3 e pH do líquido ruminal, no entanto, a APR propiciou efeito sobre o pH medido 4 horas após a alimentação. Não se observou interação ou efeito dos fatores principais sobre as concentrações de ácidos graxos voláteis no líquido ruminal, ou níveis de glicose e o nitrogênio uréico sérico.
Palavras-chave: ácidos orgânicos, alimentação, bactéria ruminal, digestibilidade, soro de leite
Introduction
Voluntary feed intake refers to the maximum amount of dry matter that the animal ingests spontaneously (Minson & Wilson, 1994). Thus, the amount consumed by the animal is a critical measurement to make inferences about the nutritional status and subsequent animal response (Burns et al., 1994). According to Forbes (1995), if the voluntary feed intake is low, the growth rate and production will probably reduce, which makes the maintenance requirements to represent a considerable proportion of metabolizable energy consumed, leading to low feed conversion efficiency.
Mertens (1994) and Grovum (1993) reported that the voluntary feed intake is regulated by three mechanisms of different nature, but that interact in the final determination of the intake levels: physical - related to the rumen distension ability; physiological - in which the regulation is given by the nutritional balance, and psychogenic - involving the animal’s behavioral response to stimulating or inhibiting factors related to feed and environment.
Sheperd & Combs (1998) also emphasize the contribution of volatile fatty acids in the satiety regulation through the issuance of signals for the feed intake cessation. According to the authors, acetate and propionate are the most important acids in controlling consumption for a long period of time. Although controversial, it is assumed that the acetate sends signals via neural receptors located on the rumen wall, which are received by the hunger control center, inducing satiety. On the other hand, the consumption regulatory mechanism by propionate is due to the stimulation of the afferent nerves that coordinate the liver activities (Villalba & Provenza, 1997), in other words, when large amounts of propionic acid are produced in the rumen, it seems that there is an issue of signals to the liver, which turns the glucose through gluconeogenesis into glycogen, to be used only when required. Therefore, if the level of circulating glucose is meeting the needs of the animal, the consumption control center captures this information and sends signals for the consumption to be reduced. The opposite is true, that is, when the level of circulating glucose is low, the consumption control center stimulates eating. The objective of this study was to evaluate the effect of intra ruminal infusion of propionic acid associated to diets with two (80:20 and 60:40) forage:concentrate ratios for young bulls on the intake and digestibility of nutrients and the rumen fermentation characteristics.
Material and Methods
The work was conducted at Universidade Federal de Viçosa – MG-Brasil, in the period from May to September 2006.
Four rumen fistulated young bulls, with 7 months of age and average 160 kg of BW, were used. The animals were distributed to a Latin square design (4 diets × 4 periods of 16 days each).
Total mixed rations with two 80:20 and 60:40(% of DM) forage:concentrate ratios (FCR), combined with the intraruminal infusion or not of propionic acid (Table 1) were used. The diets were isonitrogenous and were calculated for a daily weight gain of 0.8 kg (NRC, 2001).
The propionic acid was obtained from reconstituted milk whey by fermentation of the consortium of bacteria Enterococcus sp. and Veillonella sp. Daily and along with the supply of solid feeds, 2 L of the compound containing propionic acid were intraruminal infused in the rumen. The fermented whey presented as the main products of fermentation: propionate, lactate, acetate and succinate, with average concentration of 226.97, 158.30, 153.37 and 14.75 mM, respectively. Moreover, it was observed that the lactose present in the medium was consumed in all fermentations performed.
The animals were fed once daily, always in the morning, and the forage used was Coast-cross grass hay, with particle size from 1 to 3 cm. The diet offered and orts were daily weighted to adjust the intake to ensure orts from 5 to 10% of as fed matter. The average individual intake of animals was observed between the 11th and 16th day of
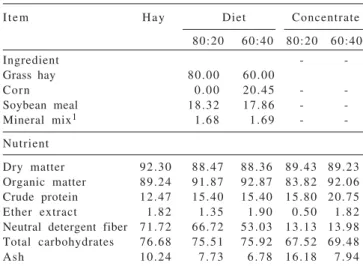
Table 1 - Composition of Coast-cross grass hay, diets and
concentrates (% DM)
Item Hay Diet Concentrate
80:20 60:40 80:20 60:40
Ingredient -
-Grass hay 80.00 60.00
Corn 0.00 20.45 -
-Soybean meal 18.32 17.86 - -Mineral mix1 1.68 1.69 -
-Nutrient
Dry matter 92.30 88.47 88.36 89.43 89.23 Organic matter 89.24 91.87 92.87 83.82 92.06 Crude protein 12.47 15.40 15.40 15.80 20.75 Ether extract 1.82 1.35 1.90 0.50 1.82 Neutral detergent fiber 71.72 66.72 53.03 13.13 13.98 Total carbohydrates 76.68 75.51 75.92 67.52 69.48 Ash 10.24 7.73 6.78 16.18 7.94
1Composition (%): dicalcium phosphate – 41.66; salt – 56.79; copper sulfate –
each trial period. During the period aimed to determine the intake, daily concentrate, hay and orts samples were also collected, which were composed on the basis of the dry weight of each subsample, per animal and period.
The total apparent digestibility was determined by the indirect method using the indigestible acid detergent fiber (iADF) as indicator. Fecal samples were collected in approximate amounts of 200.0 g, at intervals of 26 hours between them, from 8 am of the 12th day to 4 pm of the 16th
day, a total of 5 samples.
Approximately 1.0 g of feed, orts and fecal samples were used for the determination of the indicator, which were ground to 1 mm and incubated in tissue non-tissue bags (TNT - 100 g/m2), at the proportion of 20 mg DM/cm2
of surface (Nocek, 1988), in the rumen, at the end of the whole experiment, for a period of 144 hours, according to technique described by Cochran et al. (1986). After incubation, the remaining residue was submitted to acid detergent fiber analysis for use of this indicator in estimating the digestibility of nutrients.
In feed, orts and fecal samples, the dry matter (DM), organic matter (OM), mineral matter (MM), ether extract (EE) and crude protein (CP) contents were determined according to Silva & Queiroz, 2002,and neutral detergent fiber (NDF) and indigestible acid detergent fiber (iADF) according to (Van Soest et al., 1991). The total carbohydrates (TC) and the estimated intake of total digestible nutrients were obtained from the difference between the ingested and recovered in the feces of each nutrient based on dry matter, according to Sniffen et al. (1992).
The total apparent digestibility of DM, OM, EE, NDF and TC were determined through methodology described by Coelho da Silva & Leão (1979).
At the 14th day of each trial period, rumen fluid samples
(100 ml) were manually collected before and after 2, 4, 6 and 8 hours from the feed supply. The pH were determined immediately after collections, using digital pH meter. Samples of rumen fluid were collected to determine the ammonia nitrogen concentration (N-NH3). Approximately 50 mL of rumen fluid were filtered in four layers of cheese cloth and added to glass bottle containing 1 mL of sulfuric acid 1:1, which were stored at -10°C for further analysis of the N-NH3 content. After thawing, aliquots of 10 ml were removed and added of 1 mL to 10% trichloroacetic acid and centrifuged for 15 minutes at 5000 rpm. Later on, from the centrifuged samples, 2 mL of supernatant were collected and distilled with 2N KOH solution (132 g of KOH/L of distilled H2O) and titrated with hydrochloric acid (Chaney & Marbach, 1962; Silva & Queiroz, 2002)
Samples of rumen fluid were also collected to determine the volatile fatty acids (VFA) acetic acid, propionic acid, butyric acid and lactic acid concentrations. Approximately 50 mL of rumen fluid were collected on the same days and times as those to determine pH and N-NH3, double filtered in four layers of cheese cloth and stored at -10°C. After thawing of samples, aliquots of 2 mL were collected and added of 1 mL of metaphosphoric acid at 20% and 0.2 mL of phenic acid at 1% (according to internal standard). The samples were centrifuged at 17,000 rpm for 15 minutes, the supernatant was used for the determination of VFA concentrations (Erwin et al., 1961).
The volatile fatty acids were determined in the High Performance Liquid Chromatograph (HPLC), label SHIMADZU SPD-10A VP, UV detector and wave length of 210 nm. The column used was C18 (reverse phase). Formic acid 0.1% was used as mobile phase in water, flow of 1.5 mL/minute, column pressure of 168 Kgf and volume injected 20 µL.
At the 16th day of each trial period, blood samples of
approximately 10 mL were collected from the jugular vein at times zero and 4 hours after meal, in vacutainer tubes. The samples were centrifuged at 2,500 rpm for 15 min., and the serum stored at -10°C in eppendorfs for further glucose and urea nitrogen analyses. The determination of the metabolite concentrations was made through the use of commercial kits (Ureia 500, Glicose Enzimática Líquida - ®Doles Reagentes e Equipamentos para
Labora-tórios Ltda.).
All data were analyzed as a 4 × 4 Latin square design by ANOVA procedures of the Statistical Analysis System software (SAS, 2000), adopting 0.05 as critical level of probability for error type I.
Results and Discussion
There was no interaction (P>0.05) for intraruminal infusion of propionic acid (RPA) × forage: concentrate ratios (FCR) for the DM, OM, EE, NDF and TC intake; however, there was interaction of the main factors for the TDN intake, when expressed in kg/day (Table 2).
The TDN intake (Table 3) was not affected (P>0.05) by the 80:20 FCR and RPA. However, with the 60:40 FCR, the RPA reduced (P<0.05) the TDN intake. On average, the TDN intakes were higher for the 60:40 FCR, either with or without the RPA. The lowest intake for the 80:20 FCR may reflect the low availability of essential nutrients for microbial growth, as source of degradable protein in the rumen, which limits the depolymerization of fibrous components. As there was no effect on the DM intake, the possibility of the RPA acid to have influenced the feed intake seems null.
Except for the TDN intake observed in the 80:20FCR, the mean of DM, CP and TDN intakes were higher than those reported by the NRC (1989) for large-size steer breeds with weight of 150 kg of body mass and daily gain of 0,8 kg, which is equal to 3.60, 0.58 and 2.50 kg/day, respectively. Quigley & Hitmann (1991), in research with sheep, with infused propionic acid or propionic acid salts, did not observe influence on the DM intake.
RPA and FCR interaction (P<0.05) was only observed for the EE and TDN intake (Table 2), as % of BW. The RPA alone did not affect the intake of any of the nutrients, while the FCR provided different intakes for DM, OM, CP, EE and NDF. The 60:40 FCR provided the lowest NDF intakes and highest DM intake and in relation to the other components of it, which reflects the selection of the feed ingested by animals and their smaller involvement in the composition of the diet. Analyzing the effect of RPA for each FCR, there was no difference (P>0.05) in the NDT intake: the highest intakes were observed for animals that did not receive the RPA, in the 60:40 FCR (Table 3). When considering the effect of the RPA between FCR, the EE and TDN intakes were higher for 60:40FCR, particularly for animals that did not receive infusion of RPA (Table 3). The propionic acid may have added the contributions of these components of the diet and supplied the immediate energy demand of animals (Villalba & Provenza, 1997; Oba & Allen, 2003).
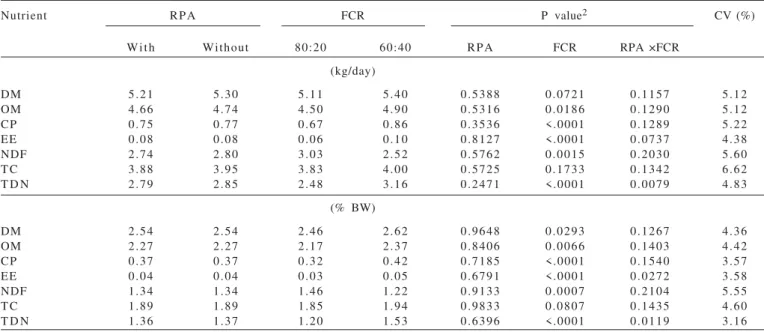
There was no interaction (P>0.05) for RPA × FCR on the total apparent digestibility for DM, OM, CP, EE, NDF Table 2 - Main effects and interaction of intraruminal infusion of propionic acid and (RPA) × forage to concentrate ratios (FCR) on
intake of nutrients
Nutrient RPA FCR P value2 CV (%)
W i t h Without 80:20 60:40 RPA FCR RPA ×FCR
(kg/day)
DM 5.21 5.30 5.11 5.40 0.5388 0.0721 0.1157 5.12
OM 4.66 4.74 4.50 4.90 0.5316 0.0186 0.1290 5.12
CP 0.75 0.77 0.67 0.86 0.3536 <.0001 0.1289 5.22
EE 0.08 0.08 0.06 0.10 0.8127 <.0001 0.0737 4.38
NDF 2.74 2.80 3.03 2.52 0.5762 0.0015 0.2030 5.60
T C 3.88 3.95 3.83 4.00 0.5725 0.1733 0.1342 6.62
T D N 2.79 2.85 2.48 3.16 0.2471 <.0001 0.0079 4.83
(% BW)
DM 2.54 2.54 2.46 2.62 0.9648 0.0293 0.1267 4.36
OM 2.27 2.27 2.17 2.37 0.8406 0.0066 0.1403 4.42
CP 0.37 0.37 0.32 0.42 0.7185 <.0001 0.1540 3.57
EE 0.04 0.04 0.03 0.05 0.6791 <.0001 0.0272 3.58
NDF 1.34 1.34 1.46 1.22 0.9133 0.0007 0.2104 5.55
T C 1.89 1.89 1.85 1.94 0.9833 0.0807 0.1435 4.60
T D N 1.36 1.37 1.20 1.53 0.6396 <.0001 0.0119 3.16
1DM = dry matter, OM = organic matter, CP = crude protein, EE = ether extract, NDF = neutral detergent fiber, TC = total carbohydrates, TDN = total digestible nutrient 2(P <0.05) for RPA and FCR and RPA x FCR interactions was siginificant.
Table 3 - Interactions of intraruminal infusion of propionic acid (RPA) × forage to concentrate ratios (FCR) on total digestible nutrients (TDN) and ether extract (EE) intake
RPA FCR
80:20 60:40
TDN (kg/day)
W i t h 2.54bA2 3.04aB
Without 2.42bA 3.28aA
TDN(% of BW)
W i t h 1.2334bA 1.4903aA Without 1.1670bA 1.5780aA
EE (% of BW)
W i t h 0.0327bA 0.0579aA Without 0.0303bA 0.0597aA
1Means followed by capital letter within a column and small letters within a row
four hours after feeding. As described by Odle & Schaefer (1987), the N-NH3 requirements are considered the minimum concentration required to maintain the maximum bacterial growth rate. However, Eardman et al. (1986) reported that the N-NH3 concentration required for maximum digestion is not constant but varies in function of the diet fermentability. Schaefer et al. (1980) and Slyter et al. (1979) suggest that the N-NH3 concentration required for maximum growth and synthesis of microbial protein per unit of fermented substrate is approximately from 5 to 6 mg N-NH3/dL. However, Owens & Bergamn et al. (1983) consider that the N-NH3 concentration for the synthesis of maximum microbial protein ranges from 0.35 to 39 mg of N-NH3/dL of rumen fluid.
The values observed in this study were higher than those reported as reference. Considering the N-NH3 mean concentrations, its possible to assume that there was a loss of protein as ammonia, so that the microorganisms that use ammonia as nitrogen source for their growth, especially cellulolytic bacteria, did not use all the ammonia for growth and unfolding of the vegetal cell wall. Russell (2002) reports that the fermentation of protein in the rumen can often produce more ammonia than the microorganisms can use, causing losses of more than 25% of the protein intake in the form of ammonia.
Similarly to ammonia, no interaction RPA × FCR was observed (P>0.05) for pH of the rumen fluid (Table 5). Considering the effects of the main factors, its possible to observe that the RPA provided effect on the pH four hours after meal, with the highest values observed in the animals that received the RPA, which was not expected. According to Martin (1998), organic acids may increase the rumen pH by increasing the use of lactate and CO2 by certain microorganisms, such as S e l e n o m o n a ruminantium.
According to Owens & Goetsch (1988), the pH of the rumen fluid ranges from 5.5 to 6.5 for diets rich in concentrate and from 6.2 to 7.0 for diets consisting exclusively of forage. According to them, the time after meal, when the pH was lower, was close to four hours and reflects the balance between the volatile fatty acids production rates, the influx of buffers through saliva and the presence or release of buffers or base of the feed.
Villalba & Provenza (1997) observed no differences of the main factors and interaction of the treatments used either. For these authors, according to the results, the ruminal infusion of acetic or propionic acid or both did not influence the preference nor did the intake of feed by lambs. This result may also be verified for the dry matter and total carbohydrates intake.
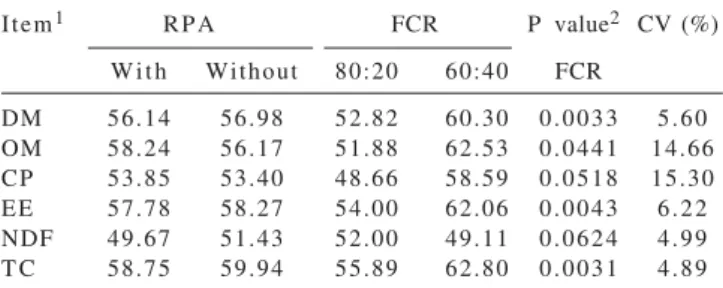
Table 4 - Main effects of intraruminal infusion of propionic acid (RPA) and forage to concentrate ratios (FCR) on the apparent nutrient digestibility
Item1 RPA FCR P value2 CV (%)
W i t h Without 80:20 60:40 FCR
DM 56.14 56.98 52.82 60.30 0.0033 5.60 OM 58.24 56.17 51.88 62.53 0.0441 14.66 CP 53.85 53.40 48.66 58.59 0.0518 15.30 EE 57.78 58.27 54.00 62.06 0.0043 6.22 NDF 49.67 51.43 52.00 49.11 0.0624 4.99 T C 58.75 59.94 55.89 62.80 0.0031 4.89
1DM = dry matter, OM = organic matter, CP = crude protein, EE = ether extract,
NDF = neutral detergent fiber, TC = total carbohydrates.
2P<0.05.
and TC (Table 4). However, the digestibility of DM, OM, EE and TC were influenced (P<0.05) by the FCR. For these variables, the digestibility was greater when the animals received the 60:40FCR, which was due to the greater availability of essential nutrients, more synchronized release of necessary nutrients for microbial growth, and/or intake of nutrients to be digested by the animal itself in the lower digestive compartments.
There was no interaction RPA × FCR (P>0.05) for N-NH3 concentration of the rumen fluid (Table 5). Analyzing the effects of the main factors, it could be observed that the RPA provided effect on the ammonia concentration two and four hours after meal, with the highest values observed in animals that received no RPA, which features intense proteolytic activity or urea recycling through rumen wall and saliva.
The highest ammonia concentration observed, independent of FCR and the RPA was 26.69, which occurred Table 5 - Main effects of intraruminal infusion propionic acid (RPA) and forage to concentrate ratios (FCR) on ammonia nitrogen concentrations (N-NH3) and pH of the rumen fluid
Time (h) RPA FCR P value1 CV (%)
W i t h Without 80:20 60:40 RPA
N-NH3. mg/dL
0 12.49 13.14 13.14 12.49 0,8806 55,38 2 22.86 32.36 26.28 28.93 0,0498 28,10 4 27.98 41.60 36.69 32.88 0,0213 25,31 6 26.54 37.91 32.36 32.10 0,1525 43,05 8 25.63 26.85 23.25 29.23 0,7711 30,40
pH
0 8.23 6.85 6.83 6.84 0,8149 2,39 2 6.52 6.51 6.53 6.50 0,9910 3,26 4 6.35 6.19 6.40 6.14 0,0021 1,02 6 6.28 6.14 6.39 6.03 0,1170 2,44 8 6.32 6.17 6.45 6.04 0,1001 2,37
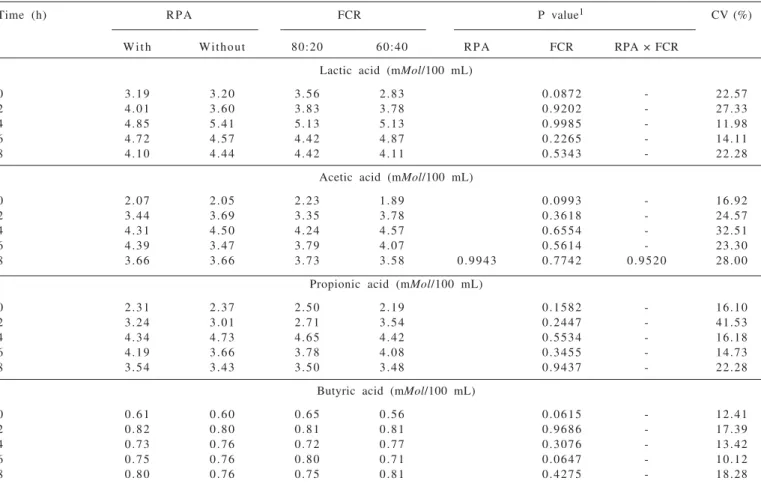
There was no effect of the main factors and interaction RPA × FCR (P> 0.05) for volatile fatty acids concentrations in the rumen fluid for the concentration and proportions of acetic acid, propionic acid and butyric acid for the acetate/propionate ratio in the times studied (Tables 6 and 7). It could also be observed, however, that even with no differences, the highest yields were observed close to four hours after feeding. Villalba & Provenza (1997) reported effect of intrarumianal infusion of propionic acid in lambs among the studied hours after the meal, and also found the largest concentrations at 0.5 and 1 hour after the meal, whose average values were 7.6 and 6.5 mMol/100 mL, respectively. These values are higher than those described in this work. Divergent results were also observed by Quigley & Bernard (1992) and Sheperd & Combs (1998).
According to Villalba and Provenza (1997) the inhibition of fatty on acid intake requires high levels of acid in the rumen. This condition supports the lack of significant effect on intake, especially of DM and OM observed in this study. Martin (1998) also reports that further studies are needed to better understand the effects
and mechanisms through which organic acids can act on rumen microorganisms and favor the rumen manipulation with a view to optimizing the use of substrates that are components of diets offered by animals.
No effects were observed for the main factors or interaction of RPA FCR (P>0.05) on glucose and serum urea nitrogen (SUN) mean concentrations (Table 8).
The mean glucose concentrations, regardless of RPA and FCR were 91.25 and 84.50 mg/dL for 0 and 4 hours after meal, respectively. These values was different from those observed by Oba & Allen (2003), who worked with ruminal infusion of propionic acid for cows in early and mid lactation and reported differences between groups of animals studied, with mean equal to 52.8 and 59 mg/dL, respectively. As reference, Quigley et al (1991) reported the value of 76 mg/L and Wittwer (2000), the minimum range from 21 to 41 mg/dL.
Thus, the values observed in this study are higher than those reported as reference and may be arising from the use of propionate, via gluconeogenesis, or the result of the homeostatic regulation of the animal, which mechanism is
Table 6 - Main effects and interactions of intraruminal infusion of propionic acid (RPA) and forage to concentrate ratios (FCR) on volatile fatty acids concentrations in the rumen fluid
Time (h) RPA FCR P value1 CV (%)
W i t h Without 80:20 60:40 RPA FCR RPA × FCR
Lactic acid (mMol/100 mL)
0 3.19 3.20 3.56 2.83 0.0872 - 22.57
2 4.01 3.60 3.83 3.78 0.9202 - 27.33
4 4.85 5.41 5.13 5.13 0.9985 - 11.98
6 4.72 4.57 4.42 4.87 0.2265 - 14.11
8 4.10 4.44 4.42 4.11 0.5343 - 22.28
Acetic acid (mMol/100 mL)
0 2.07 2.05 2.23 1.89 0.0993 - 16.92
2 3.44 3.69 3.35 3.78 0.3618 - 24.57
4 4.31 4.50 4.24 4.57 0.6554 - 32.51
6 4.39 3.47 3.79 4.07 0.5614 - 23.30
8 3.66 3.66 3.73 3.58 0.9943 0.7742 0.9520 28.00
Propionic acid (mMol/100 mL)
0 2.31 2.37 2.50 2.19 0.1582 - 16.10
2 3.24 3.01 2.71 3.54 0.2447 - 41.53
4 4.34 4.73 4.65 4.42 0.5534 - 16.18
6 4.19 3.66 3.78 4.08 0.3455 - 14.73
8 3.54 3.43 3.50 3.48 0.9437 - 22.28
Butyric acid (mMol/100 mL)
0 0.61 0.60 0.65 0.56 0.0615 - 12.41
2 0.82 0.80 0.81 0.81 0.9686 - 17.39
4 0.73 0.76 0.72 0.77 0.3076 - 13.42
6 0.75 0.76 0.80 0.71 0.0647 - 10.12
8 0.80 0.76 0.75 0.81 0.4275 - 18.28
values for the serum SUN concentration, for the Brazilian conditions, the value of 28.35 ± 10, 94 mg/dL. The values found in this study are close to the reference range.
The data analysis indicates that the RPA in combination with the FCR did not affect (P>0.05) the intake of nutrients for the animals. This result, although further researches should be conducted on the acid × microbial population × diet interactions and their effects on intake, digestive characteristics, intake of nutrients, and especially on the animal performance and production cost, suggests that its use may be feasible, since it was produced from an alternative source and can replace up to 60% the concentrate used for growing animals. The addition of acid, obtained from cheese whey fermentation, can result in the elimination of an environmental problem while being used as an alternative source of feed to improve animal performance and increase the productive capacity of meat aimed at human consumption, in an environmentally correct way.
However, the recommendation for the concentrate substitution should be viewed with caution to avoid the lack of nutrients essential to the rumen microbial growth and thus to undermine the use of fibrous feed present in the diet. The formulation of diets that include propionic acid should consider the need for rumen degradable protein sources and readily digestible carbohydrates in order to increase the microbial growth.
Conclusions
The intraruminal infusion of propionic acid in diets rich in forage does not improve the intake, the digestion dynamics and intake of nutrients for steers. The results obtained suggest that it is possible to replace up to 60% of the concentrate by an alternative source of propionic acid studied, but its use depends on the economic viability and appropriate formulation of diet in order to prevent deficiency of nutrients essential for the growth of the rumen microbiota, as degradable protein in the rumen.
Literature Cited
BURNS, J.C.; POND, K.R.; FISHER, D.S. et al. Measurement of forage intake. In: FAHEY JR., G.C. (Ed.) Forage quality, evaluation and utilization. Wisconsin: American Society of Agronomy, 1994. p.494-532.
CHANEY, A.L.; MARBACH, E.P. Modified reagents for determination of urea and ammonia. Clinical Chemistry, v.8, p.130-132, 1962.
COCHRAN, R.C.; ADAMS, D.C.; WALLACE, J.D. et al. Predicting digestibility diets with internal markers: evaluation four potential markers. Journal of Animal Science, v.63, n.11, p.1476-1483, 1986.
Table 8 - Main effects and interactions of intraruminal infusion of propionic acid (RPA) and forage to concentrated ratios (FCR) on glucose and serum urea nitrogen (SUN) concentrations
Time (h) RPA FCR CV (%)
W i t h Without 80:20 60:40
Glucose (mg/dL)
0 87.87 94.62 89.12 93.37 27.78 4 79.50 89.50 80.00 89.00 33.96
SUN (mg/dL)
0 15.55 16.25 17.42 14.39 29.56 4 17.18 21.20 20.15 18.23 34.88
Table 7 - Main effects of intraruminal infusion of propionic (RPA) acid and forage to concentrate ratios (FCR) on volatile fatty acids proportions in the in rumen fluid
Time (h) RPA FCR CV (%)
W i t h Without 80:20 60:40
Acetic acid (%)
0 40.65 40.72 40.88 40.50 12.05 2 45.66 49.13 48.49 46.30 8.86 4 42.98 45.37 41.48 46.87 27.53 6 46.84 43.99 45.07 45.77 7.86 8 45.69 46.07 46.21 45.54 13.13
Propionic acid (%)
0 46.93 47.18 46.67 47.44 10.76 2 42.76 39.59 39.43 42.92 17.24 4 48.14 46.81 50.16 44.79 19.48 6 44.76 46.24 44.92 46.07 5.95 8 44.30 44.16 44.33 44.12 12.53
Butyric acid (%)
0 12.41 12.09 12.45 12.06 9.37 2 11.58 11.28 12.08 10.78 33.63 4 8.88 7.82 8.36 8.34 39.93 6 8.40 9.76 10.01 8.16 17.99 8 10.01 7.76 9.45 10.33 16.59
Acetate/propionate ratio
0 0.89 0.86 0.89 0.86 22.57 2 1.10 1.35 1.36 1.09 39.10 4 0.96 0.99 0.89 1.07 33.44 6 1.05 0.97 1.01 1.00 12.19 8 1.03 1.08 1.08 1.04 23.91
highly sensitive to serum glucose levels. Seel & Parker (1994) also found different values in relation to those reported in this paper.
COELHO DA SILVA, J.F.; LEÃO, M.I. Fundamentos da nutrição dos ruminantes. Piracicaba: Livroceres, 1979. 384p. EARDMAN, R.A.; PROCTOR, G.H.; VANDERSALL, J.H. Effect
of rumen ammonia concentration on “in sito” rate and extent of digestion of feedstuffs. Journal of Dairy Science, v.69, n.9, p.2312-2320, 1986.
ERWIN, E.S.; MARCO, G.J.; EMERY, E.M. Volatile fatty acid analyses of blood and rumen fluid by gas chromatography.
Journal of Dairy Science, v.44, n.9, p.1768-1771, 1961. FORBES, J. M. Voluntary food intake and diet selection in
farm animals. Guilford: Biddles Ltda, 1995. 532p.
GREGORY, L.; BIRGEL JR., E.H.; D’ANGELINO, J.L. et al. Valores de referência dos teores séricos da uréia e creatinina em bovinos da raça jersey criados no estado de São Paulo. Influência dos fatores etários, sexuais e da infecção pelo vírus da leucose dos bovinos. Arquivo do Instituto de Biologia, v.71, n.3, p.339-345, 2004.
GROVUM, W.L. Apetito, sapidez y control del consumo de alimentos. In: CHURCH, D.C. (Ed.) El rumiante: fisiología digestiva y nutrición. Zaragoza: Acríbia, 1993. p.225-241. MARTIM, S.A. Manipulation of ruminal fermentation with
organic acids: a review. Journal of Animal Science, v.76, p.3123-3132, 1998.
MERTENS, D.R. Regulation of forage intake. In: FAHEY JR., G.C. (Ed.) F o r a g e q u a l i t y, e v a l u a t i o n a n d u t i l i z a t i o n. Wi s c o n s i n : A m e r i c a n S o c i e t y o f A g r o n o m y, 1 9 9 4 . p . 4 5 0 - 4 9 3 .
MINSON, D.J.; WILSON, J.R. Prediction of intake as an element of forage quality. In: FORBES, J.M.; FRANCE, J.M. (Eds.)
Q u a n t i t a t i v e a s p e c t s o f r u m i n a n t d i g e s t i o n a n d metabolism. Cambridge: University Press, 1994. p.13-52. NATIONAL RESEARCH COUNCIL - NRC. N u t r i e n t
re q u i re m e n t s o f d a i r y c a t t l e. 7.ed. Washington, D.C.: National Academic Press, 2001. 362p.
NATIONAL RESEARCH COUNCIL - NRC. N u t r i e n t re q u i re m e n t s o f d a i r y c a t t l e. 6.ed. Washington, D.C.: National Academic Press, 1989. 90p.
NOCEK, J.E. In situ and other methods to estimate ruminal protein and energy digestibility: a review. Journal of Dairy Science, v.71, p.2051-2069, 1988.
ODLE, J.E.; SCHAEFER, D.M. Influence of rumen ammonia concentration on the rumen degradation rates of barley and maize. Bristh Journal of Nutrition, v.57, n.1, p.127-138, 1 9 8 7 .
OBA, A.; ALLEN, M.S. Dose-response effects of intruminal infusion of propionate on feeding behavior of lactating cows in early or midlactation. Journal of Dairy Science, v.86, n.9, p.2922-2931, 2003.
OWENS, F.N.; BERGEN, W.G. Nitrogen metabolism of ruminant animals: historical perspective, current understanding and future implications. Journal of Animal Science, v.57, p.498-518, 1983 (suppl.2).
OWENS, F.N.; GOETSCH, A.L. Fermentación ruminal. In: CHURCH, D.C. (Ed.) El rumiante: fisiología digestiva y nutrición. Zaragoza: Acríbia, 1993. p.159-189.
QUIGLEY, J.D.; BERNARD, J.K. Effects of nutrient source and time of feeding on changes in blood metabolites in young calves. J o u r n a l o f A n i m a l S c i e n c e, v.70, p.1543-1549, 1 9 9 2 .
QUIGLEY, J.D.; CALDWELL, L.A.; SINKS, D.D. et al. Changes in blood glucose, nonesterified fatty acids, and ketones in response to weaning and feed intake in young calves. Journal of Dairy Science, v.74, n.1, p.250-257, 1991.
QUIGLEY, J.D.; HEITMANN, R.N. Effects of infusion propionate and dietary energy on dry matter intake in sheep. Journal of Animal Science, v.69, n.10, p.1178-1187, 1991.
RUSSEL, J.B. Rumen microbiology and its role in ruminant nutrition. Ithaca, 2002. 119p.
SCHAEFER, D.M.; DAVIS, C.L.; BRYANT, M.P. Ammonia saturation constants for predominant species of rumen bacteria.
Journal of Dairy Science, v.63, n.8, p.1263, 1980. SEAL, C.J.; PARKER, D.S. Effect of intraruminal propionic acid
infusion on metabolism of mesenteric and portal – drained viscera in growing steers fed a forage diet: I. volatile fatty acids, glucose, and lactate. Journal of Animal Science, v.72, p.1325-1334, 1994.
SHEPERD, A.C.; COMBS, D.K. Long-term effects of acetate and propionate on voluntary feed by midlactation cows. Journal of Dairy Science, v.81, n.8, p.2240-2250, 1998.
SILVA, D.J.; QUEIROZ, A.C. Análise de Alimentos: métodos químicos e biológicos. 3.ed. Viçosa, MG: Editora UFV, 2002. 235p.
SLYTER, L.L.; SATTER, L.D.; DINIUS, D.A. Effect of ruminal ammonia concentration on nitrogen utilization by steers.
Journal of Animal Science, v.48, p.906-912, 1979. SNIFFEN, C.J.; O’CONNOR, J.D.; Van SOEST, P.J. et al. A net
carbohydrate and protein system for evaluation cattle diets: II. Carbohydrate and protein availability. Journal of Animal Science, v.70, n.11, p.3562-3577, 1992.
STATISTICAL ANALYSIS SISTEMS – SAS. User‘s guide: basics. 7.ed. Cary: SAS Institute, 2000. (CD-ROM).
VILLALBA, J.J.; PROVENZA, F.D. Preference for flavored wheat straw by lambs conditioned with intraruminal infusions of acetate and propionate. Journal of Animal Science. v.75, p.2905-2924, 1997.
Van SOEST, P.J.; ROBERTSON, J.B.; LEWIS, B.A. et al. Methods for dietary fiber, neutral detergent fiber, and nonstarch polyssacharides in relation to animal nutrition. Journal of Dairy Science, v.74, n.10, p.3583-3597, 1991.