http://dx.doi.org/10.1590/1516-635x1603313-318
Metabolizable Energy, Digestible Lysine, and
Methionine in Quail Chicks
Author(s)
Mehri MI
Ghazaghi MII
I Department of Animal Sciences, Collage
of Agriculture, University of Zabol, Zabol 98661-5538, Iran.
II Department of Special Domestic Animals,
Research Institute at the University of Zabol (RIUOZ), Zabol 98661-5538 Iran.
Mail Address
Corresponding author e-mail address: Mehran Mehri
Department of Animal Sciences, Collage of Agriculture, University of Zabol, Zabol 98661-5538, Iran
Phone: +989155416605 Fax: +98-542-224-2501 E-mail: [email protected]
Keywords
Quail chick, nutritional requirement, uniform design, neural network.
Submitted: September/2013 Approved: June/2014
ABSTRACT
A uniform design (UD) was used to construct models to explain the growth response of Japanese quails to dietary metabolizable energy (ME), and digestible methionine (dMet) and lysine (dLys) under tropical condition. In total, 100 floor pens with seven birds each were fed 25 UD different diets containing 25 ME (2808-3092 kcal/kg), dMet (0.31-0.49% of diet), and dLys (0.91-1.39% of diet) levels from 7 to 14 d of age. A platform of artificial neural network based on UD (ANN-UD) was generated to describe the growth response of the birds to dietary inputs using random search. Artificial neural networks of body weight gain (BWG) and feed conversion ratio (FCR) were optimized using random search algorithm. The optimization the ANN-UD results showed that maximum BWG may be achieved with 2995 kcal ME/kg, 0.45% dMet, and 1.18% dLys of diet; and minimum FCR may be obtained with 3000 kcal ME/kg, 0.45% dMet, and 1.17% dLys of diet. The result of this study showed that a ANN and UD hybrid model can be used successfully to optimize the nutritional requirements of quail chicks.
INTRODUCTION
There is no increasingly trend for research activity on Japanese quails (Coturnix coturnix japonica) as a biological model (Minvielle, 2004) and little information is available on the nutritional requirements of modern quails, especially on digestible amino acid requirements. Some reports were recently published on the metabolizable energy:crude protein (ME:CP) ratio in growing (Ghazaghi et al., 2012; Siyadati et al., 2011) and adult quails (Tarasewicz et al., 2006). The ME content of diet may control feed intake and, therefore, the digestible intake of each amino acid (NRC, 1994; Richards and Proszkowiec-Weglarz, 2007). However, it has been shown that the protein intake in monogastric animals is regulated separately from energy intake and that both controlling mechanisms interact to determine overall feed intake (Henry, 1985).
be used for more possible numbers of levels of each factor among all experimental designs (Zhang et al., 1998). The most important features of these designs are the amount and the accuracy of collected data and providing desired information while keeping the number of experiments (Lin et al., 2009).
Artificial neural networks (ANN) have been employed to analyze data in poultry experiments (Ahmadi & Golian, 2008; Ahmadi & Golian, 2010a; Ahmadi and Golian, 2010b; Ahmadi & Golian, 2011; Ahmadi et al., 2008; Mehri, 2012; Roush et al., 2006). Central composite design (CCD) has been successfully used to optimize dietary nutrients using response surface methodology (Mehri et al. 2012) and ANN approach (Ahmadi & Golian, 2011; Mehri, 2012). Zhang et al. (1998) used UD for calibration ANN and concluded that ANN model based on UD always results in better performance than other experimental designs.
The objective of this study were: 1) to develop ANN models based on UD to analyze the growth response of Japanese quails to dietary ME, dLys, and dMet from 7 to 14 d of age; 2) to rank independent variables in terms of their relative importance in the developed models; and 3) to optimize the ANN model to obtain optimal values of input factors to maximize BWG and minimize FCR in Japanese quail under tropical conditions.
MATERIALS AND METHODS
Bird management
One-day-old Japanese quails were obtained from the hatchery of the Research Center of Special Domestic Animals of the University of Zabol (RCSDA, Zabol, Iran). Quail chicks were fed a starter diet (2900 kcal ME/kg and 26% CP) from d 0 to d 7 of age. At d 7 of age, 700 quail chicks were distributed into 100 floor pens and fed the dietary treatments until 14 d of age. Each pen was equipped with a drinker and a feeder, and wood-shavings litter. House temperature was maintained at 35ºC during the first week of age. On the second week of age the temperature was changed from 32 to 38ºC to mimic tropical condition. Relative humidity was 55% throughout the experiment.
Experimental Diets
Experimental diets containing corn, wheat, soybean meal, and corn gluten meal were formulated based on UD in which dietary ME, dMet, and dLys ranged from 2806 to 3090 kcal/kg, 0.31 to 0.49% of diet, and 0.91 to 1.39% of diet, respectively. To design
the experimental diets, 25 levels of each independent variable (i.e., ME, dMet, and dLys) were calculated based on table of U25(255) provided in JMP software
(JMP, 2007). Experimental levels of input variables and corresponding responses are shown in Table 1.
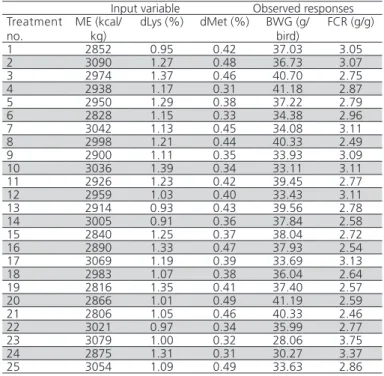
Table 1 – Dietary concentrations of metabolizable energy (ME), digestible lysine (dLys), and digestible methionine (dMet) in the experimental diets provided according uniform design and corresponding BWG and FCR response values of Japanese quails from 7 to 14d of age
Input variable Observed responses Treatment
no.
ME (kcal/ kg)
dLys (%) dMet (%) BWG (g/ bird)
FCR (g/g)
1 2852 0.95 0.42 37.03 3.05
2 3090 1.27 0.48 36.73 3.07
3 2974 1.37 0.46 40.70 2.75
4 2938 1.17 0.31 41.18 2.87
5 2950 1.29 0.38 37.22 2.79
6 2828 1.15 0.33 34.38 2.96
7 3042 1.13 0.45 34.08 3.11
8 2998 1.21 0.44 40.33 2.49
9 2900 1.11 0.35 33.93 3.09
10 3036 1.39 0.34 33.11 3.11
11 2926 1.23 0.42 39.45 2.77
12 2959 1.03 0.40 33.43 3.11
13 2914 0.93 0.43 39.56 2.78
14 3005 0.91 0.36 37.84 2.58
15 2840 1.25 0.37 38.04 2.72
16 2890 1.33 0.47 37.93 2.54
17 3069 1.19 0.39 33.69 3.13
18 2983 1.07 0.38 36.04 2.64
19 2816 1.35 0.41 37.40 2.57
20 2866 1.01 0.49 41.19 2.59
21 2806 1.05 0.46 40.33 2.46
22 3021 0.97 0.34 35.99 2.77
23 3079 1.00 0.32 28.06 3.75
24 2875 1.31 0.31 30.27 3.37
25 3054 1.09 0.49 33.63 2.86
Model Development and Evaluation
An algorithm of a feed forward multilayer perceptron (MLP) with 3 inputs, 1 output (with linear activation function), and 8 hidden neurons (with hyperbolic tangent activation function) was considered to construct the ANN models. The number of hidden neurons of the MLP was determined using the selection algorithms integrated in the “intelligent problem solver” module of Statistica software (StatSoft, 2008). In order to train the networks for BWG and FCR separately, a quasi-Newtonian algorithm was used in which the 3 input variables were dietary ME (kcal/kg), dLys, and dMet (% of diet). The 100 data lines were randomly divided into 2 sets of training (70 data lines) and testing (30 data lines). All data were imported into the Statistica Neural Network software version 8.0 (StatSoft, 2008) to develop the models and the goodness-of-fit of the ANN models was evaluated using R2, mean absolute deviation (MAD), mean square
Sensitivity Analysis
In most cases the weight of inputs in the model may vary and some factors have stronger effects on the response. The sensitivity analysis indicates the relative importance of each variable in the model that could be defined as the ratio between the error with omission and the baseline error (Hunter et al., 2000). More important variables in the have higher variable sensitivity ratio (VSR) and VSR may be used to rank the input variables according to their importance (Ahmadi & Golian, 2010b).
Model Optimization
The final goal of modeling process is to find a condition in which the predictive model yields the optimal response. Several methods may be used to optimize ANN models including genetic algorithm, simulated annealing, particle swam optimization, and gradient-free search. Random search is a family of numerical optimization methods that is relatively easy to implement on complex problems with “black-box” function evaluations (Mehri, 2012). Because the
methods typically rely only on function evaluations, rather than gradient and Hessian information, they can be quickly coded and applied to a broad class of global optimization problems (Huang et al., 2006). In this study the random search algorithm was used to optimize the ANN models for BWG and FCR. This method is an iterative optimization algorithm which is provided in Response Optimization for Data Mining Models module of Statistica software (StatSoft, 2008). For each selected set of independent values over the search space, the prediction model was evaluated and compared with the desired response. This process was then repeated until a set of independent values, for which the model yield was equal or as close as possible to the desired response value, were determined (StatSoft, 2008).
RESULTS AND DISCUSSION
Model Evaluation
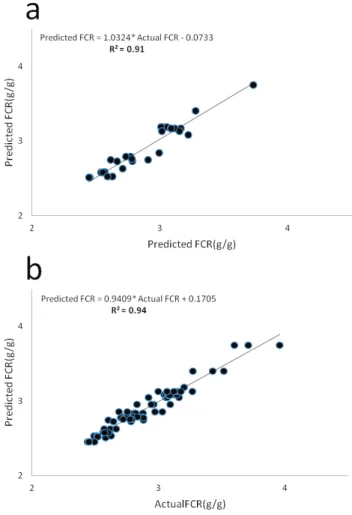
The plots of actual and predicted values of BWG and FCR are shown in Figures 1 and 2. The relatively high
Figure 1. Scatter plot of actual vs. predicted values for BWG (g/bird) of Japanese quails (block dots) and regression line on scatter points (solid line). a) Testing set (n=30); b) training set (n=70).
R2 (84%) is an indicator of the accuracy of the ANN
models. A good agreement between actual and ANN model-predicted values of BWG and FCR are shown in 2-dimensional graphs and fitted simple regression lines for both subset data lines (i.e., training and testing). The goodness-of-fit was evaluated using statistics values such as R2, MAD, MSE, MAPE, and bias (Table 2).
The relatively high R2 values obtained when testing the
BWG (R2 > 0.80) and FCR (R2 > 0.90) models showed
that the ANN models were capable of describing the growth response of Japanese quails to dietary inputs based on UD. The balanced statistical values for the training and testing models indicated that overlearning had not occurred during the training process and the developed models had good generalizability (StatSoft, 2008). The statistical values showed that the ANN models based on UD efficiently fit the growth response of Japanese quail to dietary inputs (Table 2).
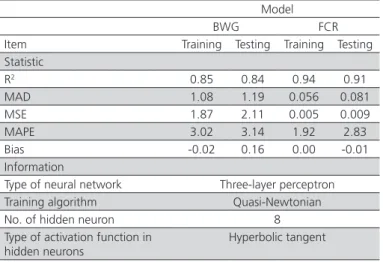
Table 2 – Statistics and information on artificial neural network models for body weight gain (BWG) and feed conversion ratio (FCR) of Japanese quails from 7 to 14 d of age.
Model
BWG FCR
Item Training Testing Training Testing Statistic
R2 0.85 0.84 0.94 0.91
MAD 1.08 1.19 0.056 0.081
MSE 1.87 2.11 0.005 0.009
MAPE 3.02 3.14 1.92 2.83
Bias -0.02 0.16 0.00 -0.01
Information
Type of neural network Three-layer perceptron Training algorithm Quasi-Newtonian
No. of hidden neuron 8
Type of activation function in hidden neurons
Hyperbolic tangent
MAD: mean absolute deviation; MSE: mean square error; MAPE: mean absolute percentage error
The growth response of poultry species to dietary nutrients is not linear (MacLeod, 2000). It is argued that some experimental designs such as UD provide a good experimental framework for nonlinear models (Liang
et al., 2001). It has been shown that data obtained from UD presented better performance than Box-Behnken Design (BBD) and CCD to build ANN models in terms of lower prediction error and consequently higher confidence of the estimates (Lin et al., 2009).
Sensitivity Analysis of the ANN Models
The relative importance of input variables was determined using all 100 lines of data (training and testing). The VSR of each input variable for the BWG
and FCR models is shown in Table 3. Sensitivity analysis of the BWG model indicated that the growth rate of quail chicks was more sensitive to dietary ME (VSR = 14.53) than to dMet (VSR = 8.77) or dLys (VSR = 7.62). In terms of FCR, the model was more sensitive to dietary ME (VSR = 21.66), followed by dLys (VSR= 19.55) and dMet (VSR = 16.00). It was shown that dietary ME was the most important variable in the performance models of stressed quail chicks.
Table 3 – Sensitivity analysis of input variables in the artificial neural network models for body weight gain (BWG) and feed conversion ratio (FCR) of Japanese quails from 7 to 14 d of age.
Input variable
Model ME (kcal/kg) dLys (%) dMet (%) BWG
VSR 14.53 7.62 8.77
Rank 1 3 2
FCR
VSR 21.66 19.55 16.00
Rank 1 2 3
VSR: variable sensitivity ratio
In this study, quail chicks suffered from the heat stress, which may have affected their feed consumption and energy intake (Ferket & Gernat, 2006; Quinteiro-Filho et al., 2010). The integration between feed intake and dietary energy is possibly coordinated by the brain. Heat stress may increase corticosterone serum levels, consequently decreasing food intake (Quinteiro-Filho et al., 2010). On the other hand, feed intake may be suppressed under high environmental temperatures to balance body energy expenditure (Richards and Proszkowiec-Weglarz, 2007), resulting in higher ME requirements.
Model Optimization
from economic point of view, the values estimated as “requirements” may be different from those to obtain profit maximization (Pesti et al., 2009). The estimated values in this study may not be economical in practice as the most economical feeding level may replace the concept of “requirement” in the poultry industry.
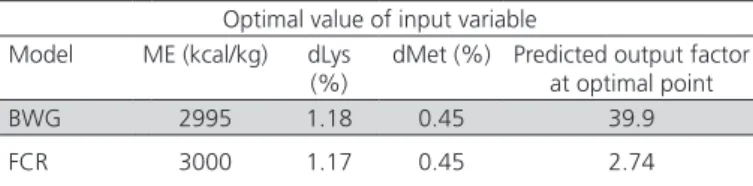
Table 4 – Optimal dietary metabolizable energy (ME), digestible lysine (dLys), and digestible methionine (dMet) levels obtained by the developed artificial neural network models to reach maximal body weight gain (BWG) and minimal feed conversion ratio (FCR) in Japanese quails from 7 to 14 d of age.
Optimal value of input variable Model ME (kcal/kg) dLys
(%)
dMet (%) Predicted output factor at optimal point
BWG 2995 1.18 0.45 39.9
FCR 3000 1.17 0.45 2.74
In conclusion, an integration of ANN with UD platform may be a useful and accurate procedure to study several essential nutrients. The average estimated requirement for dietary ME was 2997 kcal/ kg and dietary requirements of dLys (1.17% of diet) and dMet (0.45% of diet) were similar for both BWG and FCR in Japanese quails from 7 to 14 d of age. Further studies are needed to explore the ability of the ANN-UD procedure to determine the requirements of essential amino acids in poultry species.
REFERENCES
Ahmadi H, Golian A. Neural network model for egg production curve. Journal of Animal and Veterinary Advances 2008; 7:1168-1170.
Ahmadi H, Golian A. Growth analysis of chickens fed diets varying in the percentage of metabolizable energy provided by protein, fat, and carbohydrate through artificial neural network. Poultry Science 2010a; 89:173-179.
Ahmadi H, Golian A. The integration of broiler chicken threonine responses data into neural network models. Poultry Science 2010b; 89:2535-2541.
Ahmadi H, Golian A. Response surface and neural network models for performance of broiler chicks fed diets varying in digestible protein and critical amino acids from 11 to 17 days of age. Poultry Science 2011; 90:2085-2096.
Ahmadi H, Mottaghitalab M, NarimanZadeh N, Golian A. Predicting performance of broiler chickens from dietary nutrients using group method of data handling-type neural networks. British Poultry Science 2008; 49:315-320.
Cheng J, Li QS. A hybrid artificial neural network method with uniform design for structural optimization. Computational Mechanics 2009; 44:61-71.
De Leon AC, Kidd MT, Corzo A. Box-Behnken Design: alternative multivariate design in broiler nutrition research. World’s Poultry Science Journal 2010; 66:699-706.
Fang KT. The uniform design: application of number-theoretic methods in experimental design. Acta Mathematicae Applicatae Sinica 1980; 3:363-372.
Fang KT, Lin DKJ. Uniform experimental designs and their applications in industry. Handbook of Statistics 2003; 22:131-170.
Ferket PR, Gernat AG. Factors that affect feed intake of meat birds: A review. International Journal of Poultry Science 2006; 5:905-911.
Ferreira SLC, Brun RE, Ferreira HS, Matos GD, David JM, Brandão GC, Da Silva EGP, Portugal LA, Dos Reis PS, Souza AS. Box-Behnken design: An alternative for the optimization of analytical methods. Analytica Chimica Acta 2007; 597:179-186.
Ghazaghi M, Mehri M, Yousef-Elahi M, Rokouei M. Response surface of dietary energy and protein in Japanese quail from 7 to 14 days of age. Poultry Science 2012; 91:2958–2962.
Henry Y. Dietary factors involved in feed intake regulation in growing pigs: a review. Livestock Production Science 1985; 12:339-354.
Huang D, Allen TT, Notz WI, Zeng N. Global optimization of stochastic black-box systems via sequential kriging meta-models. Journal of Global Optimization 2006; 34:441-466.
Hunter A, Kennedy L, Henry J, Ferguson I. Application of neural networks and sensitivity analysis to improved prediction of trauma survival. Computer Methods and Programs in Biomedicine 2000; 62:11-29.
SAS Institute JMP. Located at SAS Campus Drive. Cary; 2007.
Liang Y, Fang K, Xu Q. Uniform design and its applications in chemistry and chemical engineering. Chemometrics and Intelligent Laboratory Systems 2001; 58:43-57.
Lin Y, Zhang Z, Thibault J. Comparison of experimental designs using neural networks. The Canadian Journal of Chemical Engineering 2009; 87:965-971.
MacLeod MG. Modelling the utilization of dietary energy and amino acids by poultry. In: Theodorou MK, France J, editors. Feeding systems and feed evaluation models. Wallingford: CAB Int.; 2000. p.393–412.
Mehri M. Development of artificial neural network models based on experimental data of response surface methodology to establish the nutritional requirements of digestible lysine, methionine, and threonine in broiler chicks. Poultry Science 2012; 91:3280–3285.
Mehri M, Davarpanah AA, Mirzaei HR. Estimation of ideal ratios of methionine and threonine to lysine in starting broiler chicks using response surface methodology. Poultry Science 2012; 93:771-777.
Minvielle F. The future of Japanese quail for research and production. World’s Poultry Science Journal 2004; 60:500-507.
Montgomery DC. Design and analysis of experiments. New York: John Wiley & Sons; 2008.
National Research Council. Nutrient requirements of poultry. 9th rev. ed.
Washington: National Academy Press; 1994.
Pesti GM, Vedenov D, Cason JA, Billard L. A comparison of methods to estimate nutritional requirements from experimental data. British Poultry Science 2009; 50:16-32.
Quinteiro-Filho WM, Ribeiro A, Ferraz-de-Paula V, Pinheiro ML, Sakai M, Sá LRM, Ferreira AJP, Palermo-Neto J. Heat stress impairs performance parameters, induces intestinal injury, and decreases macrophage activity in broiler chickens. Poultry Science 2010; 89:1905-1914.
Roush WB, Dozier III WA, Branton SL. Comparison of Gompertz and neural network models of broiler growth. Poultry Science 2006; 85:794-797.
Siyadati SA, Irani M, Ghazvinian K, Mirzaei-Aghsaghali A, Rezaipoor V, Fathi H, Alipoor K, Zamanzad-Ghavidel S. Effect of varying dietary energy to protein ratio on productive performance and carcass characteristics of Japanese quail. Scholar Research Library 2011; 2:149-155.
StatSoft. Statistica data analysis software system. Version 8.0. Tulsa; 2008.
Tarasewicz Z, Szczerbiska ML, Wierciska M, Majewska KR. The effect of differentiated dietary protein level on the performance of breeder quails. Animal Science Papers and Reports 2006; 24:207-216.