Engineering
ISSN: 1809-4430 (on-line)
_________________________
2 Universidade Federal de Santa Maria/ Santa Maria/RS, Brasil. 3 SEAPA/Palmeira das Missões/RS, Brasil.
4 ESALQ-USP / Piracicaba/SP, Brasil.
5 Universidade Federal de Santa Maria/ Santa Maria/RS, Brasil.
SUNFLOWER EMERGENCE AND INITIAL GROWTH IN SOIL WITH WATER EXCESS
Doi:http://dx.doi.org/10.1590/1809-4430-Eng.Agric.v37n4p644-655/2017
LUIS H. LOOSE1*, ARNO B. HELDWEIN2, DIONEIA D. P. LUCAS3,
FERNANDO D. HINNAH4, MATEUS P. BORTOLUZZI5
1*Corresponding author. Instituto Federal Farroupilha/ Santo Ângelo - RS, Brasil. E-mail: [email protected]
ABSTRACT: Sunflower crops are grown in different regions worldwide. However, the stress
caused by water excess in the soil impairs this crop growth and yield. The aim of the present study was to determine the response of sunflower plants to long periods of water excess during initial development stages. Water excess treatments were applied at the initial development of these plants at the sowing day, three days after sowing, at plant emergence, and at V2 and V4 stages. The treatments had different duration periods (0, 48, 96, 144, 192, and 240 hours) and were applied at three sowing dates. The current experiment is factorial and was carried out according to a completely random design. Two plant pots, treated under greenhouse conditions, made up the experimental units. Plant emergence, leaf area, plant height, shoot dry mass, maximum root length, main root length and root dry mass were herein assessed. Water excess is more harmful to sunflower plants during the sowing-emergence period. It substantially reduces emergence, plant density, shoot and root growth, even after 48-hour stress. Moreover, water excess leads to the formation of adventitious and secondary roots.
KEYWORDS:Helianthus annuus L., water stress, plant emergence, growth reduction.
INTRODUTION
Sunflower (Helianthus annuus L.) is an oilseed crop grown and consumed worldwide. Its
seeds have unsaturated fatty acids essential to the human organism (Alberio et al., 2014). However, its yield is vulnerable to abiotic stress in extreme conditions. Soil water excess and deficit are the most important factors causing plant stress (Gholinezhad & Sajedi, 2012; Grassini et al., 2007).
Water excess changes the gas phase in the soil and promotes O2 deficiency in the roots
Plant emergence of sensitive species such as wheat, soybeans, and maize is strongly affected by water excess (Lucas et al., 2015; Zaidi et al., 2012; Sung, 1995; Nakajima et al., 2015). High air temperatures have a major effect on seed germination of these species (Zaidi et al., 2012; Nakamura et al., 2012; Nakajima et al., 2015), however, few species have evolved to germinate and grow in
anoxic environments (Orchard & Jessop, 1984). Rice (Oryza sativa L.) is a good example of it for
being able to germinate under anoxic conditions, as amylase enzymes break down the starch under
O2 absence (Yamauchi et al., 2013). Seedlings, in general, have the capacity to produce aerenchyma
for root cell respiration (Vartapetian & Jackson, 1997).
The aim of the current article is to assess the effect of water-surplus on the initial growth, development, and root and shoot growth of sunflower plants under different water surplus levels and duration.
MATERIAL AND METHODS
The experiment was carried out in a polycarbonate greenhouse located in Santa Maria (latitude: 29°43'23'' S, longitude: 53°43'15'' W, and altitude 95 m), in the central region of Rio Grande do Sul State, Brazil. The maximum air temperature was set at 32°C. The experimental units (EUs) were composed by pots filled with Ultisol A horizon. The soil was homogenized, sieved, and had its fertility levels corrected. Each pot was placed inside a bucket that was suspended 3 cm from the ground surface for an effective water drainage whenever needed. The pots were distributed in a 30 m2 area.
The present study was a factorial experiment in a complete randomized design, with three replications. Factor A consisted of a qualitative analysis of the early development of sunflower plants. The applications of water surplus for Factor A were made at the following levels: Control = no water excess, T1 = water excess right after sowing, T2 = water excess three days after sowing, T3 water excess at emergence (50% plants already emerged), T4 = water excess at V2 (two completely developed leaves), and T5 = water excess at V4 (four completely developed leaves). In turn, Factor D was a quantitative analysis of continuous periods of water surplus application, namely: 0, 48, 96, 144, 192, and 240 hours. Finally, factor E comprised three sowing dates: 08/29th/2011, 10/04th/2011, and 11/03rd/2011.
Seeds of the single-cross hybrid 'Helio 250', with 82.2% germination rate, were used in the experiment from the sowing date up to the final application of the tested treatments. At the end of the aforementioned period, plants were harvested, and the variables were assessed. The first sowing date lasted from 08/29th/2011 up to 09/29th/2011; the second, from 10/04th/2011 up to 10/31st/2011; and the third, from 11/03rd/2011 up to 11/28th/2011. Therefore, sowing dates 1, 2, and 3, lasted 31, 27, and 25 days after sowing (DAS), respectively.
Water excess treatments started after sowing and the water level was kept at 6 cm below the soil surface. Water capillary, adhesion, cohesion and the gradients of water potential in the soil allowed the rise of water level, keeping the soil surface highly moist. The water excess in the EUs was accomplished through two ways when the treatments started being applied. Water was directly supplied to the soil inside pots and buckets in order to keep the water level inside them. The water level was monitored on a daily basis, and the maximum level in the buckets was set by a hole placed 15 cm high. After applying the water excess, water was removed from the buckets, allowing drainage of the surplus through holes in the pot bottoms. Soil moisture in the EUs which received no treatment (control, and EU without water excess) remained the same due to daily irrigation.
After plant emergence, thinning was performed leaving two plants on both sides of each pot.
The remaining plants were treated to the end of the experiment. The following variables were
analyzed: emergence percentage (EP), leaf area (LA), plant height (PH), shoot dry matter (SDM), maximum root length (MaxRL), main root length (MRL), and root dry matter (RDM).
measured. Then, root material was transferred to paper bags and taken to an oven at 65°C under
forced ventilation until reaching a constant weight for dry mass measurement. Dry mass variables
were converted to grams per square meter (g m-2). Data were analyzed by analysis of variance, and
the treatments were assessed by regression analysis (p<0.05).
RESULTS AND DISCUSSION
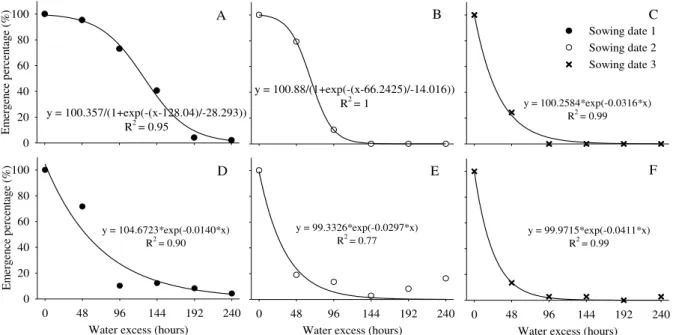
Figure 1 shows the results for plant emergence according to the duration of water excess application for three different sowing dates. A water excess application for 48 hours caused a sharp reduction in plant emergence in the third sowing date for T1 and T2 (Figures 1C and 1F), showing rates of 22.0% and 13.9% viable seeds, respectively. However, in the first and second sowing dates, these treatments showed higher rates of 95.3% and 79.3% (T1) and 71.6% and 18.9% (T2).
Sem.
Em
er
gen
ce
p
er
ce
nt
ag
e
(%
)
0 20 40 60 80 100
Water excess (hours)
0 48 96 144 192 240
Em
er
gen
ce
p
er
ce
nt
ag
e
(%
)
0 20 40 60 80 100
Water excess (hours)
0 48 96 144 192 240
Water excess (hours)
0 48 96 144 192 240
A
D
B
E
C
F
y = 100.357/(1+exp(-(x-128.04)/-28.293)) R2 = 0.95
y = 100.88/(1+exp(-(x-66.2425)/-14.016))
R2 = 1 y = 100.2584*exp(-0.0316*x) R2 = 0.99
y = 104.6723*exp(-0.0140*x) R2 = 0.90
y = 99.3326*exp(-0.0297*x)
R2 = 0.77 y = 99.9715*exp(-0.0411*x) R2 = 0.99
Sowing date 1 Sowing date 2 Sowing date 3
FIGURE 1. Emergence percentage (EP) of sunflower plants in three different sowing dates (1, 2, and 3) under water excess duration from 0 to 240 hours, applied immediately after sowing (A, B, and C) and 3 days after sowing (D, E, and F). The experiment was carried out in a greenhouse from August to November 2011, in Santa Maria - RS, Brazil.
Major reductions in plant emergence were found for treatments providing water excess for the same number of hours in the third sowing date. Furthermore, we may highlight that water excess led to severe losses in plant emergence in all sowing dates (when the germination process had already begun) right at the sowing day.
Similar results were found by Sung (1995) in a study with soybeans wherein water excess for longer than 24 and 48 hours reduced emergence by 50% and 100%, respectively. Therefore, water excess in sunflower crops during germination might be harmful right after sowing, as already seen for soybean seedlings (Nakajima et al., 2015). This might be explained by an increase in respiration
rate and enzyme activity after the first seed imbibition peak, causing a high demand for O2 what
potentiates seed damages (Orchard & Jessop, 1984).
Mean air temperature (°C)
16 18 20 22
M
ea
n e
m
er
gen
ce
p
er
ce
nt
ag
e
(%
)
0 20 40 60 80 100
T1 y = -5.3099*Tar + 136.56 R2 = 0.95
T2 y = -2.3484*Tar + 71.99 R2 = 0.99
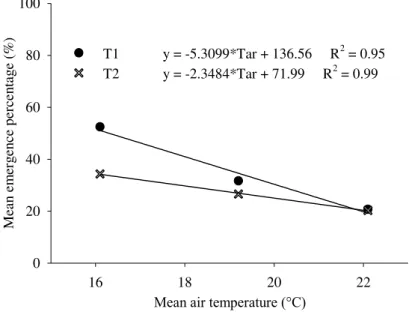
FIGURE 2. Mean emergence percentage of sunflower plants subjected to water excess right after sowing (T1) and three days after sowing (T2) according to the mean air temperature for the three sowing dates. The experiment was carried out in a greenhouse, from August to November 2011, in Santa Maria - RS, Brazil.
Air temperature influenced the sunflower seedling emergence under water excess. Recent findings have evidenced the effects of water excess on seed germination of both soybeans (Nakamura et al., 2012) and maize (Zaidi et al., 2012). Here, we noted that emergence reduction was more harmful at 25 °C than at 15 °C and 10 ºC. According to Orchard & Jessop (1984), high air temperatures lead to increased enzymatic activity and metabolism in sunflower seeds. This must occur because the seeds under stress of excess water lack oxygen for metabolic activities (Pezeshki & Delaune, 2012).
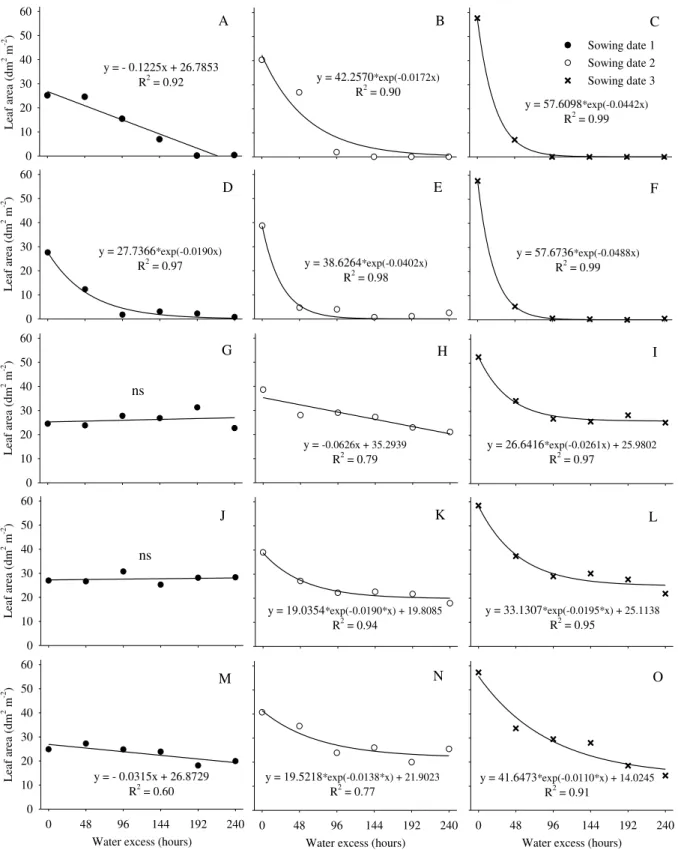
Adverse effects of water excess on leaf area (LA) were more evident when such stress occurred right after sowing and after germination onset (Figures 3A, 3B, 3C, 3D, 3E, and 3F), showing mainly emergence failures and plant density reduction. The LA values dropped down to almost zero after 48 hours of water excess - except for the first sowing date - due to lower air temperatures.
N
y = 19,5218*exp(-0,0138*x) + 21,9023 R2 = 0,77
L
ea
f a
rea
(
dm
2 m -2 )
0 10 20 30 40 50 60
Water excess (hours)
0 48 96 144 192 240
L
ea
f a
rea
(
dm
2 m -2 )
0 10 20 30 40 50 60
Water excess (hours)
0 48 96 144 192 240
A B C
L
ea
f a
rea
(
dm
2 m -2 )
0 10 20 30 40 50 60
D E F
L
ea
f a
rea
(
dm
2 m -2 )
0 10 20 30 40 50 60
L
ea
f a
rea
(
dm
2 m -2 )
0 10 20 30 40 50 60
G H I
J K L
M ns
O ns
y = 57.6098*exp(-0.0442x) R2 = 0.99
y = 57.6736*exp(-0.0488x) R2 = 0.99
y = 26.6416*exp(-0.0261x) + 25.9802 R2 = 0.97
y = 33.1307*exp(-0.0195*x) + 25.1138 R2 = 0.95
y = 41.6473*exp(-0.0110*x) + 14.0245 R2 = 0.91
y = 19.0354*exp(-0.0190*x) + 19.8085 R2 = 0.94
y = -0.0626x + 35.2939 R2 = 0.79 y = 38.6264*exp(-0.0402x)
R2 = 0.98
y = 42.2570*exp(-0.0172x) R2 = 0.90
y = 27.7366*exp(-0.0190x) R2 = 0.97 y = - 0.1225x + 26.7853
R2 = 0.92
y = - 0.0315x + 26.8729 R2 = 0.60
Water excess (hours)
0 48 96 144 192 240
N
y = 19.5218*exp(-0.0138*x) + 21.9023 R2 = 0.77
Sowing date 3 Sowing date 2 Sowing date 1
FIGURE 3. Leaf area of sunflower plants subjected to water excess (0 to 240 hours) in three sowing dates (1, 2, and 3) right after sowing (A, B and C), 3 days after sowing (D, E and F), at plant emergence (G, H and I), at V2 stage (J, K and L) and at V4 stage (M, N and O). The experiment was carried out in a greenhouse, from August to November 2011, Santa Maria, RS, Brazil.
phase (V2 stage) and found sunflower growth suppression. Their results corroborated our observations, which showed a large reduction of LA due to water excess occurrence.
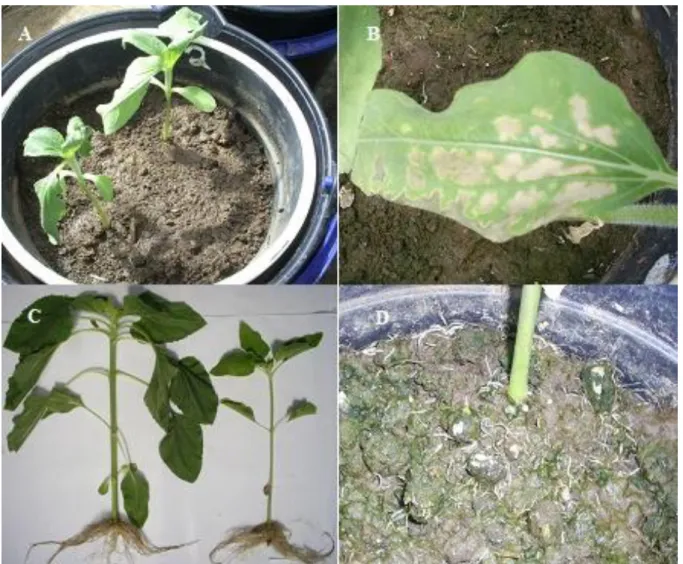
Leaf wilting was observed few hours after water excess treatment for all three sowing dates (Figure 4A). Furthermore, plant leaves showed photooxidative damage, mainly for V4-stage treatment in the sowing dates 2 and 3 (Figure 4B). Figure 4C highlights the differences in leaf area between plants receiving water excess or not.
According to Vartapetian & Jackson (1997), stomatal closure is an early plant response to water stress. Roots are unable to meet the water demand of plant leaves due to cell anoxia. Furthermore, photooxidative damages were visually observed in the leaves, mainly for water excess applied at V4 stage in sowing dates 2 and 3. Photooxidative damages under water excess were also observed in eggplants, tomatoes (Bansal & Srivastava, 2012), and in pigeon pea (Bansal & Srivastava, 2015).
FIGURE 4. Leaf wilting (A), photooxidative damage in the leaf tissues (B), shoot and root (C) without (C, left) and with water stress (C, right). Lateral and adventitious roots on the soil surface (D) rising as a response to water excess. The experiment was carried out in a greenhouse, from August to November 2011, Santa Maria, RS, Brazil.
Sem.
Em. Rad.
Emerg.
V2
V4
Pl
an
t h
eig
th
(
cm
)
0 5 10 15 20 25 30 35 40
Water excess (hours)
0 48 96 144 192 240
Pl
an
t h
eig
th
(
cm
)
0 5 10 15 20 25 30 35 40
Water excess (hours)
0 48 96 144 192 240
Water excess (hours)
0 48 96 144 192 240
A
Pl
an
t h
eig
th
(
cm
)
0 5 10 15 20 25 30 35 40
B
Pl
an
t h
eig
th
(
cm
)
0 5 10 15 20 25 30 35 40
Pl
an
t h
eig
th
(
cm
)
0 5 10 15 20 25 30 35 40
ns
ns
ns
ns ns
y = 22.1705/(1+exp(-(x-164.4775)/-12.9307)) R2 = 0.94
y = 30.0399/(1+exp(-(x-92.5273)/-17.6058)) R2 = 0.99
y = 39.8537*exp(-0.0158*x) R2 = 0.80
y = -0.063*x + 20.4301 R2 = 0.65
y = 27.5863*exp(-0.0107*x) R2 = 0.68
y = 35.9199*exp(-0.0189*x) R2 = 0.95
y = -0.0328*x + 35.3016 R2 = 0.96
y = -0.0274*x + 29.5913 R2 = 0.59
y = -0.0425*x + 36.5873 R2 = 0.84
y = -0.0369*x + 34.4365 R2 = 0.80
C
D E F
G H I
J K L
M N O
Sowing date 1 Sowing date 2 Sowing date 3
Sh oo t d ry m att er ( g m -2 ) 0 5 10 15 20 25 30 35 40
Water excess (hours)
0 48 96 144 192 240
Sh oo t d ry m att er ( g m -2 ) 0 5 10 15 20 25 30 35 40
Water excess (hours)
0 48 96 144 192 240
Water excess (hours)
0 48 96 144 192 240
A Sh oo t d ry m att er ( g m -2 ) 0 5 10 15 20 25 30 35 40 B D F Sh oo t d ry m att er ( g m -2 ) 0 5 10 15 20 25 30 35 40 Sh oo t d ry m att er ( g m -2 ) 0 5 10 15 20 25 30 35 40 C E I L O H G J K M N
y = 35.1526*exp(-0.0484*x)
R2 = 0.99 y = 26.1301/(1+exp(-(x-51.8743)/-14.8257))
R2 = 1
y = 23.9156*exp(-0.0426*x)
R2 = 0.98
y = 17.4536*exp(-0.0231*x)
R2 = 0.98
y = 33.4249*exp(-0.0487*x)
R2 = 0.99
y = 22.4218*exp(-0.0340*x) + 11.9025
R2 = 0.99
y = 22.7630*exp(-0.0254*x) + 11.2405
R2 = 0.96
y = 25.2912*exp(-0.0271*x) + 9.4995
R2 = 0.96 y = 14.1112*exp(-0.0168*x) + 11.8357
R2 = 0.86
y = 13.6350*exp(-0.0272*x) + 10.4978 R2 = 0.98
y = -0.0433*x + 21.472
R2 = 0.78 ns
y = -0.0183x + 14.7920
R2 = 0.91
y = 16.4264/(1+exp(-(x-98.9476)/-26.7457)) R2 = 0.98
ns
Sowing date 3 Sowing date 2 Sowing date 1
FIGURE 6. Shoot dry matter (SDM) of sunflower plants under water excess (0 to 240 hours) at three sowing dates (1, 2 and 3) right after sowing (A, B and C), 3 days after sowing (D, E and F), at plant emergence (G, H and I), at V2 stage (J, K and L) and at V4 stage (M, N and O). The experiment was carried out in a greenhouse, from August to November 2011, Santa Maria, RS, Brazil.
The largest reductions of SDM were observed in treatments applied before emergence (Figure 6). This variable reduced exponentially in most of the treatments applied after emergence, mainly at sowing date 3. Several treatments caused 50% SDM reduction, in comparison to the control, in the treatment with 48 hours of water excess (Figures 6K, 6N, 6I, 6L, and 6O).
presented stagnant growth. The third sowing date showed the highest growth for control treatment (over 100%) whether compared to the treatments with water excess.
Root growth in sunflower plants under water excess showed different results for primary and secondary roots (Figure 7). The maximum root length (MaxRL) was significantly smaller when water excess occurred at the sowing date or three days after sowing (Figure 7A and 7B). When water excess was applied at emergence or at V2 and V4 stages, the results of regression analysis were non-significant (Figures 7C, 7D, and 7E).
On the other hand, the main root length (MRL) was significantly smaller in all stages. Again, the severest results were found in treatments applied before emergence as plant population was smaller (Figure 7F and 7G). The treatments applied after plant emergence, with 48-hour water excess, were enough to reduce MRL when they were compared to the control. MRL stabilized at 7.15, 7.84 and 9.23 cm for treatments applied at emergence, V2, and V4 stages, respectively (Figures 7H, 7I, and 7J).
The root dry matter (RDM) reduced under water excess at different development stages (Figure 7). It exponentially decreased in most of the treatments, except for V4-stage application (T5). A larger reduction, in comparison to the control, could be noticed mainly at sowing day or three days after water excess application (Figures 7K and 7L). RDM reductions reached more than 50 and 80% after 48 hours of application at sowing day or three days after sowing, respectively.
This variable reduced exponentially, showing a stable trend of nearly 2 g m-2 in treatments applied
M ax im um r oo t len gt h ( cm ) 0 4 8 12 16 20 24 28 M ax im um r oo t len gt h ( cm ) 0 4 8 12 16 20 24 28
Water excess (hours)
0 48 96 144 192 240
M ax im um r oo t len gt h ( cm ) 0 4 8 12 16 20 24 28 ns ns
y = 21.0562*exp(-0.0173x) R2 = 0.96
A C E M ax im um r oo t len gt h ( cm ) 0 4 8 12 16 20 24 28 M ax im um r oo t len gt h ( cm ) 0 4 8 12 16 20 24 28 ns
y = 21.3187*exp(-0.0374*x) R2 = 0.99
B D M ain r oo t len gt h ( cm ) 0 3 6 9 12 15 M ain r oo t len gt h ( cm ) 0 3 6 9 12 15
y = 14.4114/(1+exp(-(x-0.5435)/-14.3569)) R2 = 1
y = 7.0112*exp(-0.0454*x) + 7.1543 R2 = 0.98
F
H
Water excess (hours)
0 48 96 144 192 240
M ain r oo t len gt h ( cm ) 0 3 6 9 12 15
y = 5.1749*exp(-0.0271*x) + 9.2379 R2 = 0.87
J M ain r oo t len gt h ( cm ) 0 3 6 9 12 15
y = 6.2344*exp(-0.016*x) + 7.8384 R2 = 0.88
I M ain r oo t len gt h ( cm ) 0 3 6 9 12 15
y = 14.5829*exp(-0.0566*x) R2 = 0.99
G R oo t d ry m att er ( g m -2 ) 0 1 2 3 4 5 R oo t d ry m att er ( g m -2 ) 0 1 2 3 4 5
Water excess (hours)
0 48 96 144 192 240
R oo t d ry m att er ( g m -2) 0 1 2 3 4 5
y = 4.0317*exp(-0.0185*x) R2 = 0.98
y = 2.3017*exp(-0.0318*x) + 1.7652 R2 = 0.96
y = 0.0001*x2 - 0.0281*x + 3.8113 R2 = 0.86
K M O R oo t d ry m att er ( g m -2) 0 1 2 3 4 5
y = 2.3017*exp(-0.0488*x) + 1.8684 R2 = 0.96
N R oo t d ry m att er ( g m -2 ) 0 1 2 3 4 5
y = 4.3079*exp(-0.0396*x) R2 = 0.99
L
FIGURE 7. Maximum root length (A, B, C, D and E), main root length (F, G, H, I and J), and root dry matter (K, L, M, N and O) of sunflower plants under water excess (0 to 240 hours) right after sowing (A, F and K), 3 days after sowing (B, G and L), at plant emergence (C, H and M), at V2 stage (D, I and N) and at V4 stage (E, J and O). The experiment was carried out in a greenhouse, from August to November 2011, Santa Maria, RS, Brazil.
Root growth ceased as excess water application lasted longer. Yet root dry matter was drastically reduced after 48 and 96 hours of water excess but tended to increase after longer application periods (Figure 7O). Plants already had some leaf area at early development stages, as well as were suitable for accelerated growth.
due to water excess, e.g. wheat (Araki et al., 2012; Marti et al., 2015), maize (Zaidi et al., 2012), and soybean (Shimono et al., 2012).
The observed root growth confirms the physiological adaptation of sunflower plants to water stress. While the primary roots slowed down growth rates (Figure 4C), the secondary ones
continued to grow mainly near the soil surface. It occurs because these roots seek for layers with O2
availability to meet the minimum requirements for root respiration. Similarly, Araki et al. (2012) reported the formation of secondary and adventitious roots (Figure 4D) rather than primary roots and shoot growth for wheat plants. According to Vartapetian & Jackson (1997), the formation of
adventitious roots is common in plants under water excess as an attempt to overcome the O2
shortage. Yasumoto et al. (2011) reported the ability of sunflower plants to produce adventitious roots in moist soils. Orchard & Jessop (1984) stated that such ability increases the tolerance of these plants to water excess during later development stages.
Water excess occurrence and persistence in the soil increased the dry mass of roots near the surface. Grassini et al. (2007) and Yasumoto et al. (2011) also observed significant sunflower root dry matter reduction along with a development of secondary and adventitious roots. However, Grassini et al. (2007) observed that the root biomass was significantly lower for non-shaded plants than for shaded ones, both under water excess stress.
CONCLUSIONS
Water excess right after sowing and after germination is mostly harmful to sunflower plants than it is in later stages since it affects emergence, plant density, leaf area, as well as shoot and root dry matter contents.
Sunflower seedling emergence is negatively affected even under periods shorter than 48 hours of water excess application.
Sunflower plants produce secondary and adventitious roots near the soil surface in response to water excess stress.
Water surplus associated with high air temperatures lead to reductions in sunflower seedling emergence compared to mild temperatures.
REFERENCES
Alberio C, Izquierdo NG, Aguirrezábal LAN (2014) Sunflower Crop Physiology and Agronomy. Sunflower: chemistry, production, processing, and utilization p53.
Araki H, Hossain MA, Takahashi T (2012) Waterlogging and hypoxia have permanent effects on wheat root growth and respiration. Journal of Agronomy and Crop Science 198(4):264-275. Balakhnina TI, Matichenkov VV, Wlodarczyk T, Borkowska A, Nosalewicz M, Fomina IR (2012) Effects of silicon on growth processes and adaptive potential of barley plants under optimal soil watering and flooding. Plant Growth Regulation 67(1):35-43.
Bansal R, Srivastava JP (2012) Antioxidative defense system in pigeonpea roots under waterlogging stress. Acta Physiologiae Plantarum 34(2):515-522.
Bansal R, Srivastava JP (2015) Antioxidative responses to short term waterlogging stress in pigeon pea. Indian Journal of Plant Physiology 20(2):182-185.
Grassini P, Indaco GV, Pereira ML, Hall AJ, Trápani N (2007) Responses to short-term waterlogging during grain filling in sunflower. Field Crops Research 101(3):352-363.
Gorai M, Ennajeh M, Song J, Khemira H, Neffati M (2011) Changes in leaf gas exchange, water
relations, biomass production and solute accumulation in Phragmites australis under hypoxic
Gholinezhad E, Sajedi N (2012) Evaluation of Water Deficit Stress Effects, Different Rates of Nitrogen and Plant Density on Remobilization, Current Photosynthesis and Grain Yield in Sunflower Var. Iroflor. World Applied Sciences Journal 19(5):650-658.
Licausi F (2011) Regulation of the molecular response to oxygen limitations in plants. New Phytologist 190(3):550-555.
Lucas DDP, Heldwein AB, Maldaner IC, Trentin R, Hinnah FD, Silva JR (2015) Water excess in different soils and sowing times for sunflower in the state of Rio Grande do Sul, Brazil. Pesquisa Agropecuária Brasileira 50(6):431-440.
Marti J, Savin R, Slafer GA (2015) Wheat Yield as Affected by Length of Exposure to Waterlogging During Stem Elongation. Journal of Agronomy and Crop Science. DOI: http://dx.doi.org/10.1111/jac.12118
Nakajima T, Seino A, Nakamura T, Goto Y, Kokubun M (2015) Does pre-germination flooding-tolerant soybean cultivar germinate better under hypoxia conditions? Plant Production Science 18(2):146-153.
Nakamura T, Yamamoto R, Hiraga S, Nakayama N, Okazaki K, Takahashi H, Komatsu S (2012) Evaluation of metabolite alteration under flooding stress in soybeans. JARQ: Japan Agricultural Research Quarterly 46(3):237-248.
Orchard PW, Jessop RS (1984) The response of sorghum and sunflower to short-term waterlogging. Plant and Soil 81(1):119-132.
Pezeshki SR, Delaune RD (2012) Soil oxidation-reduction in wetlands and its impact on plant functioning. Biology 1(2):196-221.
Shimono H, Konno T, Sakai H, Sameshima R (2012) Interactive Effects of Elevated Atmospheric
CO2 and Waterlogging on Vegetative Growth of Soybean (Glycine max (L.) Merr.). Plant
Production Science 15(3):238-245.
Sung JM (1995) The effect of sub-optimal O2 on seedling emergence of soybean seeds of different
size. Seed Science and Technology 23(3):807-814.
Vartapetian BB, Jackson MB (1997) Plant adaptations to anaerobic stress. Annals of Botany 79(1):3-20.
Yamauchi T, Shimamura S, Nakazono M, Mochizuki T (2013) Aerenchyma formation in crop species: a review. Field Crops Research 152:8-16.