Revista Brasileira de
Engenharia Agrícola e Ambiental
Campina Grande, PB, UAEA/UFCG – http://www.agriambi.com.br
v.21, n.4, p.221-226, 2017
Number of leaves and phenology of rice hybrids simulated
by the SimulArroz model
Giovana G. Ribas
1, Nereu A. Streck
1, Ary J. Duarte Junior
1,
Moises F. do Nascimento
1, Alencar J. Zanon
1& Michel R. da Silva
1DOI: http://dx.doi.org/10.1590/1807-1929/agriambi.v21n4p221-226
A B S T R A C T
Process-based-models can predict leaf and reproductive development of agricultural crops. The objective of this study was to calibrate and evaluate the SimulArroz model in simulating the number of leaves on the main culm and the phenology of three hybrid rice cultivars in Rio Grande do Sul, Brazil. Field experiments were conducted in Santa Maria, Cachoeirinha, Uruguaiana and Santa Vitória do Palmar, in Rio Grande do Sul state, in two growing seasons. Observations were made to determine the number of leaves in the main culm through the Haun scale and the phenology of three hybrid cultivars (PRIME CL, INOV CL and QM 1010 CL) and a conventional rice cultivar used as a control (IRGA 424). The calibration of the SimulArroz model was efficient for simulating the number of leaves and phenology as a function of the sowing date and maturity group of three hybrid rice cultivars in Rio Grande do Sul.
Número de folhas e fenologia de híbridos
de arroz simulado pelo modelo SimulArroz
R E S U M O
Modelos matemáticos baseado em processos podem prever o desenvolvimento folhar e reprodutivo de cultivos agrícolas. Objetivou-se, com este trabalho, calibrar e avaliar o modelo SimulArroz em simular o número de folhas e a fenologia de três cultivares de arroz híbrido no Rio Grande do Sul. Foram conduzidos experimentos de campo em Santa Maria, Cachoeirinha, Uruguaiana e Santa Vitória do Palmar, no Rio Grande do Sul, em dois anos agrícolas. Foram realizadas observações para determinar o número de folhas do colmo principal através da escala da Haun e a fenologia de três cultivares híbridas (PRIME CL, INOV CL e QM 1010 CL) e uma convencional de arroz usada como testemunha (IRGA 424). A calibração do modelo SimulArroz utilizada foi eficiente em simular o número de folhas e a fenologia em função da época de semeadura e do grupo de maturação de três cultivares híbridas de arroz irrigado no Rio Grande do Sul.
Key words: Oryza sativa Haun stage thermal time
Palavras-chave: Oryza sativa escala de Haun soma térmica
1 Universidade Federal de Santa Maria/Centro de Ciências Ruruais/Departamento de Fitotecnia. Santa Maria, RS. E-mail: [email protected]
(Corresponding author); [email protected]; [email protected]; [email protected]; [email protected]; [email protected]
Introduction
Brazil is the ninth largest rice producer in the world (USDA, 2016). The Brazilian production is approximately 12 Mt and the South region is responsible for 76%, while the state of Rio Grande do Sul (RS) is the largest producer, with 70% of the national production (CONAB, 2016). Annually, the RS state cultivates 1.1 million ha with irrigated rice; thus, it is one of the crops that represent a significant part of the gross national product, generated by the agricultural sector (CONAB, 2016). Hybrid cultivars are the most productive, for producing
more per unit of area, due to the heterosis (Cantrell, 2003), which allows to reach yields 20 to 30% higher than those of
conventional cultivars (Li & Yuan 2000; Coimbra et al., 2006). In the agricultural sector, for reliability and applicability, there is the necessity to develop models adapted and tested in different environments (Streck et al., 2008; 2011). After tested, the agricultural models have multiple applications, because they can predict growth, development and yield of the crop as a function of the meteorological conditions during the growth season (Shin et al., 2006; 2010). The SimulArroz model is a dynamic ecophysiological process-based model that simulates growth, development and yield of irrigated rice. This model differs from the others for having been adapted for cultivars in the flood irrigation system in RS (Streck et al., 2011; Walter et al., 2012). The SimulArroz model contains a “biological clock” that controls growth and development by calculating the production of leaves and the phenology of the crop (Streck et al., 2008; 2011). In the current version of the SimulArroz (version 1.0), there is no option for hybrids, which is a limitation, as hybrid rice has been cultivated in RS since 2002 and currently has an area of approximately 68 thousand ha (IRGA, 2015). This study aimed to calibrate and evaluate the SimulArroz model in simulating the number of leaves and phenology of three hybrid rice cultivars in Rio Grande do Sul.
Material and Methods
Experiments were conducted in Santa Maria (29° 43' S, 53° 43' W), from October 2013 to February 2014 and from
October 2014 to March 2015, at the research stations of the Rice Institute of Rio Grande do Sul (IRGA) of Cachoeirinha (29°
57’ S, 51° 5’ W), Uruguaiana (29° 32’ S, 53° 20’ W) and Santa Vitória do Palmar (33° 50’ S, 57° 4’ W) in RS, from October
2014 to March 2015.
The sowing dates of the experiments encompassed the period recommended for the crop in RS (early September until mid December) (Table 1). The density was 40 kg ha-1 for the
hybrids PRIME CL and QM 1010 CL, and 50 kg ha-1 for INOV
CL, due to the genetic characteristic of lower tillering (Peske et al., 2004). Besides the hybrids, a conventional cultivar was also used at the density of 100 kg ha-1 as a control (Table 1).
The conventional cultivar IRGA 424 (medium maturity group) was selected because it is recommended for all rice-growing regions of RS and also for showing higher yield among the conventional cultivars, because its productive potential is close to that of hybrid cultivars (SOSBAI, 2014).
The spacing between rows was 0.17 m in all locations. The size of the plot for each cultivar was 17 x 17 m in Santa Maria,
1.57 x 47 m in Cachoeirinha, 1.53 x 5 m in Santa Vitória do
Palmar and in Uruguaiana. The experimental design in Santa Vitória do Palmar and in Uruguaiana was randomized blocks with 4 replicates. In Santa Maria and Cachoerinha, there was no experimental design and samplings were performed according to the methodology described by Gabriel et al. (2014).
Leaf production and phenology were weekly evaluated (in Santa Maria and Cachoeirinha) and biweekly evaluated in
the other locations in plants that were identified in the V2/V3
stage of the scale of Counce et al. (2000). These plants were evaluated for number of leaves in the main culm through the
Haun scale, HS (Haun, 1973), which is calculated as follows:
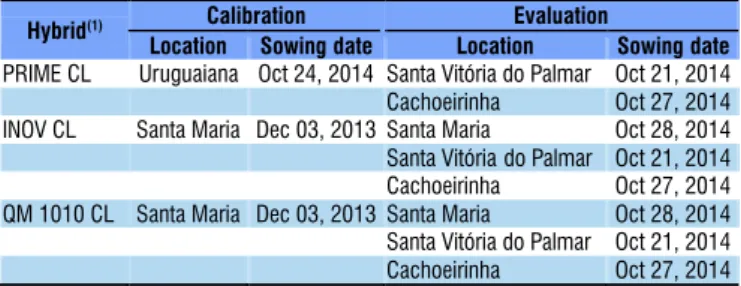
Table 1.Rice hybrids, locations and sowing dates of the
experiments of flood-irrigated rice used for the calibration and evaluation (independent data) of the submodels of leaf appearance and phenology in SimulArroz model
Hybrid(1) Calibration Evaluation
Location Sowing date Location Sowing date
PRIME CL Uruguaiana Oct 24, 2014 Santa Vitória do Palmar Oct 21, 2014 Cachoeirinha Oct 27, 2014 INOV CL Santa Maria Dec 03, 2013 Santa Maria Oct 28, 2014 Santa Vitória do Palmar Oct 21, 2014 Cachoeirinha Oct 27, 2014 QM 1010 CL Santa Maria Dec 03, 2013 Santa Maria Oct 28, 2014 Santa Vitória do Palmar Oct 21, 2014 Cachoeirinha Oct 27, 2014
(1)INOV CL and PRIME CL - Early cycle (106 to 120 d); QM 1010 CL - Medium cycle (121 to 135 d)
last
pnult L
HS NL
L
= +
where:
HS - number of leaves in the main culm;
NL - number of expanded leaves in the main culm; Llast - length of the last leaf (without the formed collar); and,
Lpnult - length of the penultimate leaf (last one with formed collar), both in centimeters (cm).
Panicle differentiation (R1) was determined through the destructive sampling of 10 plants and the R1 date occurred when 50% of the plants were in this development stage. Marked plants were observed to identify the dates in which 50% of the plants were in anthesis (R4) and physiological maturity (R9) (Counce et al., 2000).
The daily rate of leaf production in the main culm in the
SimlArroz model was calculated according to Streck et al. (2003):
( ) ( )
max1,2
LAR=LAR f T f C
where:
LAR - leaf appearance rate (leaves d-1);
LARmax1,2 - maximum rate of appearance of the first and second leaves (leaves d-1);
f(T) - LAR response function with respect to air tempera-ture, with cardinal temperatures for leaf production equal to
11 °C (Ellis et al., 1993; Infeld et al., 1998), 26 °C (Ellis et al., 1993) and 40 °C (Gao et al., 1992), respectively; and,
(1)
f(C) - chronology function that causes LAR to decrease, from the third leaf on.
The cumulative number of leaves, represented by the Haun scale, is calculated as:
HS=
∑
LARwhere:
HS - Haun stage (leaves in the main culm).
For the calculation of the progress of the phenology in SimulArroz, the development stage of the crop (DVS) was daily calculated as:
DTT DVS
TT
=
where:
DTT - daily thermal time (oC day); and,
TT - total thermal time (oC day) to complete the stage.
The DTT is calculated according to Streck et al. (2011):
(3) (4) (8) (7)
(
)
(
)
(
(
)
)
mean b b mean opt
opt b
B mean opt mean B
B opt
mean b mean B
DTT T T 1 day if T T T
T T
DTT T T 1 day if T T T T T
DTT 0 if T T or T T
= − ⋅ ≤ ≤
−
= − ⋅ ⋅ ≤ ≤
−
= < >
(6) (5)
where:
Tb - lower base temperature; Topt - optimum temperature; TB - upper base temperature; and, Tmean - mean daily air temperature.
The Tb, Topt, and TB vary according to the developmental phase, being Tb = 11 °C, Topt = 30 °C and TB = 40 °C for the Sowing-Emergence and Emergence-Panicle Differentiation Phases, Tb = 15 °C, Topt = 25 °C and TB = 35 °C for the Panicle Differentiation-Anthesis phase, and Tb = 15 °C, Topt = 23 °C e TB = 35 °C for the Anthesis-Physiological Maturity phase (Streck et al., 2011).
TT=
∑
DTTThe DVS is -1 at sowing, zero at emergence, 0.65 at panicle differentiation (R1), 1 at anthesis (R4) and 2 at physiological maturity (R9).
The calibration of both submodels consisted in estimating the values of LARmax1,2 (Eq. 2) and TTS (Eq. 10) for each hybrid, with data of experiments in Table 1. Both submodels were evaluated with independent data (Table 1).
Simulations were performed with the SimulArroz model for the cultivar IRGA 424, already available in the version 1.0, in order to compare the performance of the model in the
simulation of the hybrids with the conventional cultivar. The parameters of both submodels for the cultivar IRGA 424 in the SimulArroz model are: LARmax1,2 = 0.347 leaves d-1, TTEM
= 50.0 oC day, TTVG = 644.3 oC day, TTRP = 153.0 oC day,
TTEG = 112.78 oC day.
The performance of both submodels in the SimulArroz model was evaluated using the following statistics: Root-mean-square error (RMSE), BIAS index, agreement index (dw) and Pearson’s correlation coefficient (r).
RMSE was calculated according to Janssen & Heuberger (1995):
(
)
2 0.5i i S O RMSE n − =
∑
(9)BIAS was calculated according to Samboranha et al. (2013):
i i i S O BIAS O − =
∑ ∑
∑
The “dw” index was calculated according to Borges &
Mendiondo (2007) and Samboranha et al. (2013):
(
)
(
) (
)
2 i i w 2 i i S O d 1S O O O
− = −
− + −
∑
The “r” coefficient was calculated according to Borges &
Mendiondo (2007) and Samboranha et al. (2013):
(
)
(
)
(
)
(
)
{
i i}
0.52 2
i i
O O S S
r
O O S S
− − = − −
∑
∑
∑
where:Si - simulated values; S - mean of simulated values; Oi - observed values;
Ō - mean of observed values; and n - number of observations.
Results and Discussion
The maximum appearance rate of the first and second leaves (LARmax1,2) is higher in the hybrid with medium cycle (QM 1010 CL) and lower in that of early cycle (PRIME CL), indicating lower speed of leaf production in PRIME CL in comparison to the other two hybrids. The total thermal sum necessary to complete the Sowing-Emergence stage is similar in the three hybrids. The duration of the Emergence-Panicle Differentiation stage is shorter in the early hybrids, especially PRIME CL. For the hybrid cultivars, the vegetative stage is the one with highest influence on the duration of the total cycle (Table 2), regardless of the maturity group.
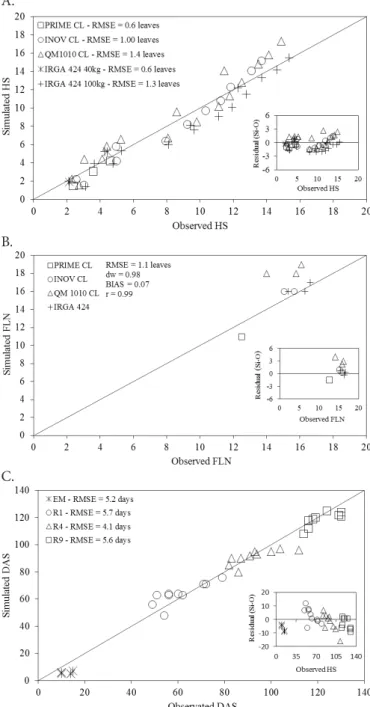
The simulation of the HS of the hybrids in the different locations showed RMSE from 0.5 to 1.9 leaves in the main (10)
(11)
Figure 1. Number of leaves per plant on the main culm - HS (A), final leaf number in the main culm - FLN (B) and days after sowing (DAS) of the stages of emergence-EM (C), panicle differentiation (R1), anthesis (R4) and physiological maturity (R9) obseved and simulated with the SimulArroz model for three hybrids (PRIME CL, INOV CL and QM 1010 CL) and one conventional cultivar (IRGA 424) of irrigated rice in Rio Grande do Sul in the 2014/2015 growing season
C. B. A.
LARmax1,2 - Maximum rate of appearance of the first and second leaves (leaves d-1); TTEM - Total thermal time necessary to complete the Sowing-Emergence phase (oC day); TTVG - Total thermal time necessary to complete the Emergence-Panicle Differentiation phase (oC day); TTRP - Total thermal time necessary to complete the Panicle Differentiation-Anthesis phase (oC day); TTEG - Total thermal time necessary to complete the Anthesis-Physiological Maturity phase (oC day)
Parameter Unit Hybrids
PRIME CL INOV CL QM 1010 CL
LARmax 1,2 Leaves day-1 0.268 0.376 0.397
TTEM ˚C day 50.0 51.4 51.4
TTVG ˚C day 394.8 557.6 643
TTRP ˚C day 175.3 145.9 142.2
TTEG ˚C day 128.6 116.8 117.2
Table 2.Parameters of the submodels of leaf production and phenology in the SimulArroz model calibrated for
three rice hybrids
stem, close to the values found for maize (0.8 leaves) (Streck
et al., 2010) and lower than that found for cassava (3.2 leaves) (Samboranha et al., 2013) using the model of Wang and Engel. The BIAS index varied from -0.03 to 0.45, indicating
a slight underestimation of the model. The dw index and the correlation coefficient were high for all hybrids (above 0.89). Considering all locations, the RMSE of the hybrids varied from 0.6 to 1.4 leaves (Figure 1A). Comparing the statistics of
the hybrids with those of the IRGA 424 (Table 3 and Figure
1A), it is noticed that the SimulArroz model simulates well the number of leaves, represented by the HS, in the three hybrids. The final leaf number (FLN) in the main culm, which
is intrinsically solved (Streck et al., 2003), showed a RMSE of
1.1 leaves, being slightly higher than that reported for wheat (0.55 leaves) (He et al., 2012), using a nonlinear model, thus emphasizing to continue the efforts to improve the simulation of FNL. The other statistics (Figure 1B) indicate a very good performance in the model for this variable.
The RMSE of the cultivar IRGA 424 was close to those of the hybrids for the phenology, and the simulation of R1, R4
and R9 varied from 3.6 to 8.1 days between both locations.
Considering all locations, the RMSE was equal to 4.2, 4.7 and 5.9 d (Table 4).
These values (Table 4) are lower than those described for wheat (12.6 days) and barley (11.5 days) using nine simulation models (APES-ACE, CROPSYST, DAISY, DSSAT-CERES, FASSETT, HERMES, MONICA, STICKS and WOFOST) (Rotter et al., 2012), confirming the better performance of the model used in the present study.
The hypothesis for the delay of the simulated emergence can be related to three factors, which are not considered in the model: (i) sowing depth, (ii) soil temperature (the model uses air temperature to estimate emergence) and (iii) rainfall from sowing to emergence, which can alter soil temperature and create an anoxic environment, which decreases the germination speed. Running the model from the observed emergence date, the RMSE is equal to 7.2, 4.8 and 4.6 days for R1, R4 and R9, respectively.
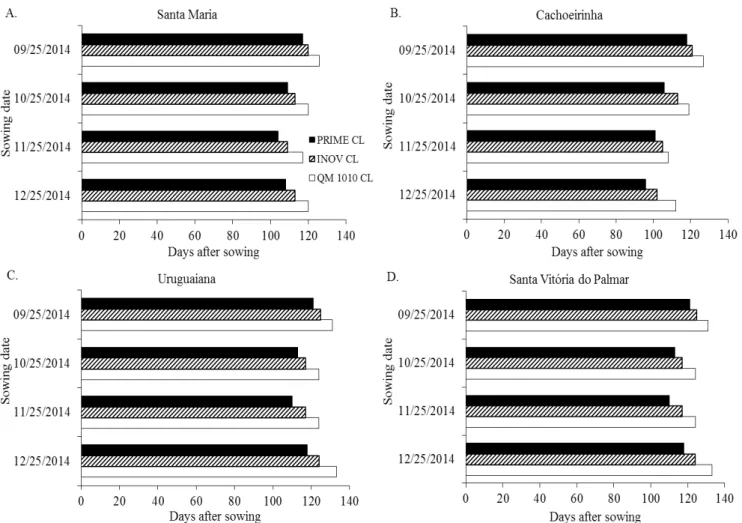
Figure 2 shows an application of the SimulArroz model to describe the Genotype x Environment interaction on the duration of the development cycle (Sowing to R9), of the three rice hybrid cultivars, on four sowing dates, in four locations of RS. The shortest duration of the development cycle occurred for the sowings in the months of November and December, due to the higher air temperature, which caused the thermal accumulation for each development stage to be faster, except
in Uruguaiana, where QM 1010 CL showed the longest duration of the cycle for the sowing on December 25 (Figure 2). Among the locations, the duration of the cycle was longer in Santa Vitória do Palmar (sowing on September 25) and in Uruguaiana (sowing on December 25). In these two locations, due to the geographic position, the lower temperature in the spring (Santa Vitória do Palmar) and in the autumn (Uruguaiana) determined the lower daily rate of development and, consequently, prolongation of the cycle. Considering all locations and sowing dates, the cycle varied from 121 to 96
RMSE - Root-mean-square error, BIAS - BIAS index; DW - Agreement index; R - Pearson’s correlation coefficient (r); The hybrid cultivars PRIME CL and INOV CL were not evaluated in these locations; In Santa Vitória do Palmar, dw and r were not determined because of the lower number of observed data
Location Statistics Hybrids IRGA 424
PRIME CL INOV CL QM1010 CL
Santa Maria
RMSE - 1.1 1.3 1.5
BIAS - -0.03 0.01 -0.12
Dw - 0.98 0.98 0.97
R - 0.99 0.98 0.99
Cachoeirinha
RMSE 0.7 0.7 1.0 1.2
BIAS -0.18 0.07 0.19 0.15
Dw 0.93 0.95 0.89 0.97
R 1.00 1.00 1.00 1.00
Uruguaiana
RMSE - - 1.9 0.8
BIAS - - 0.20 -0.05
Dw - - 0.90 0.98
R - - 0.99 0.98
Santa Vitória do Palmar
RMSE 0.5 - 1.4 0.3
BIAS -0.13 - 0.45 0.07
Dw - - -
-R - - -
-Table 3. Performance of the SimulArroz model in simulating the Haun stage on the main culm of three hybrids and one cultivar (IRGA 424) of irrigated rice in four locations of Rio Grande do Sul, during the 2014/2015 crop season
RMSE - Root-mean-square error; BIAS - BIAS index; dw - Agreement index; r - Pearson’s correlation coefficient; The hybrid cultivars PRIME CL and INOV CL were not evaluated in these locations
Location Statistics Hybrids IRGA 424
PRIME CL INOV CL QM1010 CL
Santa Maria
RMSE - 5.0 8.1 4.1
BIAS - 0.02 0.08 0.03
dw - 1.00 0.97 0.99
r - 1.00 1.00 1.00
Cachoeirinha
RMSE 3.6 3.6 4.9 4.1
BIAS -0.05 -0.05 -0.04 -0.05
dw 1.00 1.00 1.00 1.00
r 1.00 1.00 1.00 1.00
Uruguaiana
RMSE - - 5.8 6.1
BIAS - - -0.04 0.01
dw - - 1.00 0.99
r - - 0.99 0.99
Santa Vitória do Palmar
RMSE 5.6 - 4.7 5.4
BIAS -0.08 - -0.06 -0.06
dw 0.99 - 1.00 1.00
r 1.00 - 1.00 1.00
All locations
RMSE 4.7 4.2 5.9 4.9
BIAS -0.07 0.01 -0.02 -0.02
dw 1.00 1.00 0.99 1.00
r 1.00 0.99 0.99 0.99
Table 4. Performance of the SimulArroz model in simulating the date of emergence, panicle differentiation (R1), anthesis (R4) and physiological maturity (R9) of three hybrids and one cultivar (IRGA 424) of irrigated rice in four locations of Rio Grande do Sul, during the 2014/2015
crop season
Figure 2.Development cycle duration (Sowing to R9) for three hybrid cultivars of irrigated rice, INOV CL, PRIME CL and QM 1010 CL, on four sowing dates, in Santa Maria (A), Cachoeirinha (B), Uruguaiana (C) and Santa Vitória do Palmar (D), RS, simulated with the SimulArroz model
to 108 days for QM 1010 CL, which are consistent with the duration of the cycles of these three hybrids in the technical recommendations for the rice crop in RS, equal to 110, 120
Conclusions
1. The calibration approach of the SimulArroz model is efficient to simulate the number of leaves in the main culm and phenology of three hybrid cultivars of irrigated rice in Rio Grande do Sul.
2. The SimulArroz model captures the effect of sowing period on the hybrid cultivars and the stage from sowing to panicle differentiation has the highest influence on the duration of the total cycle.
3. The SimulArroz model is sensitive to the maximum leaf
appearance rate, which varies with the maturity group, being higher in all cultivars of medium cycle.
Literature Cited
Borges, A. C.; Mendiondo, E. M. Comparação entre equações empíricas para estimativa da evapotranspiração de referência na Bacia do Rio Jacupiranga. Revista Brasileira de Engenharia Agrícola Ambiental, v.11,
p.293-300, 2007. https://doi.org/10.1590/S1415-43662007000300008
Cantrell, R. P. Foreword. In: Virmani, S. S.; Mao, C. X. ; Hard, B. Hybrid rice for food security poverty alleviation, and environmental protection. Filipinas: International Rice Research
Institute. 2003. 4p.
Coimbra, J. L. M.; Oliveira, A. C.; Carvalho, F. I. F.; Magalhães, A. M. J.; Fagundes, P. R. R.; Kopp, M. M. Heterose em arroz híbrido. Revista Brasileira de Agrociência, v.12, p.257-264, 2006. CONAB - Companhia Nacional de Abastecimento. Acompanhamento
da safra brasileira de grãos. Brasília: CONAB, v.2, 2016. 176p. Counce, P.; Keisling, T. C.; Mitchell, A. J. A uniform, objective,
and adaptative system for expressing rice development.
Crop Science, v.40, p.436-443, 2000. https://doi.org/10.2135/ cropsci2000.402436x
Ellis, R. H.; Qi, A.; Summerfield R. J.; Roberts E. H. Rates of leaf appearance and panicle development in rice (Oryza sativa L.): A comparison at three temperatures. Agricultural and Forest
Meteorology, v.66, p.129-138, 1993. https://doi.org/10.1016/0168-1923(93)90066-Q
Gabriel, L. F.; Streck, N. A.; Roberti, D. R.; Chielle, Z. G.; Uhlmann, L. O.; Silva, M. R. da; Silva, S. D. da. Simulating cassava growth
and yield under potential. Agronomy Journal, v.106, p.1119-1137, 2014. https://doi.org/10.2134/agronj2013.0187
Gao, L.; Jin, Z.; Huang, Y.; Zhang, L. Rice clock model - A computer model to simulate rice development. Agricultural and Forest Meteorology, v.60, p.1-16, 1992.
https://doi.org/10.1016/0168-1923(92)90071-B
Haun, J. R. Visual quantification of wheat development. Agronomy
Journal, v.65, p.116-119, 1973. https://doi.org/10.2134/agronj19 73.00021962006500010035x
He, J.; Gouis, J. L.; Stratonovitch, P.; Allard, V.; Gaju, O.; Heumez, E.; Orford, S.; Griffiths,S.; Snape, J. W.; Foulkes, M. J.; Semenov, M. A.; Martre, P. Simulation of environmental and genotypic variations of final leaf number and anthesis date for wheat.
European Jounal of Agronomy, v.42, p.22-33, 2012. https://doi.
org/10.1016/j.eja.2011.11.002
Infeld, J. A.; Silva, J. B.; Assis, F. N. Temperatura base e graus-dia durante o período vegetativo de três grupos de cultivares de arroz irrigado. Revista Brasileira de Agrometeorologia, v.6, p.187-191, 1998.
IRGA – Instituto Riograndense do Arroz. Levantamento da área semeada com arroz irrigado híbrido no Rio Grande do Sul, 2015. Porto Alegre: IRGA. <http://www.irga.rs.gov.br>. 20 Set. 2015. Janssen, P. H. M.; Heuberger, P. S. C. Calibration of process-oriented
models. Ecological Modelling, v.83, p.55-56, 1995. https://doi. org/10.1016/0304-3800(95)00084-9
Li, J.; Yuan, L. Hybrid rice: Breeding, and seed production. Plant Breeding Reviews, v.17, p.15-158, 2000.
Peske, S. T.; Schuch, L. O. B.; Barros, A. C. S. A. Produção de arroz irrigado, Pelotas: Universidade Federal de Pelotas. 2004. 623p. Rotter, R. P.; Palosuo. T.; Kersebaum, K. C.; Angulo, C.; Bindi, M.;
Ewert, F.; Ferrise, R.; Hlavinka, P.; Moriondo, P.; Nendel, C.; Olesen, J. E.; Patil, R. H.; Ruget, F.; TakaˇJ.; Trnka, M. Simulation of spring barley yield in different climatic zones of Northern and Central Europe: A comparison of nine crop models. Field
Crops Research, v.133, p.23-36, 2012. https://doi.org/10.1016/j. fcr.2012.03.016
Samboranha, F. K.; Streck, N. A.; Uhlmann, L. O.; Gabriel, L. F. Modelagem matemática do desenvolvimento foliar em mandioca.
Revista Ciência Agronômica, v.44, p.815-824, 2013. https://doi. org/10.1590/S1806-66902013000400019
Shin, D. W.; Baigorria, G. A.; Lim, Y. K.; Cocke, S.; Larow, T. E.; O´Brien, J. J.; Jones, J. W. Assessing maize and peanut yield simulations with various seasonal climate data in the Southeastern United States. Journal of Applied Meteorology and Climatology,
v.49, p.592-603, 2010. https://doi.org/10.1175/2009JAMC2293.1
Shin, D. W.; Bellow, J. G.; Larow, T. E.; Cocke, S.; O’Brien, J. J. The role of an advanced land model in seasonal dynamical downscaling for crop model application. Journal of Applied Meteorology and Climatology, v.45, p.686-701, 2006. https://doi.org/10.1175/
JAM2366.1
SOSBAI - Sociedade Sul Brasileira de Arroz Irrigado. Arroz irrigado: Recomendações técnicas da pesquisa para o sul do Brasil. Bento Gonçalves: SOSBAI, 2014. 189p.
Streck, N. A.; Bosco, L. C.; Lago, I. Simulating leaf appearance in rice. Agronomy Journal, v.100, p.490-501, 2008. https://doi.
org/10.2134/agronj2007.0156
Streck, N. A.; Gabriel, L. F.; Bruske, T. C.; Lago, I.; Samboranha, F. K.; Schwantes, A. P. Simulating leaf appearance in a maize variety.
Bioscience Journal, v.26, p. 384-393, 2010.
Streck, N. A.; Lago, I.; Oliveira, F. B.; Heldwein, A. B.; Avila, L. A. de; Bosco, L. C. Modeling the development of cultivated rice and
weedy red rice. Transactions of the ASAE, v.54, p.371-384, 2011. https://doi.org/10.13031/2013.36234
Streck, N. A.; Weiss, A.; Baenziger, P. S.; Xue, Q. Incorporating a chronology response function into the prediction of leaf appearance rate in winter wheat. Annals of Botany, v.92,
p.181-190, 2003. https://doi.org/10.1093/aob/mcg121
USDA - United States Department of Agriculture. Production, supply and distribution online. <http://www.usda.gov/wps/portal/usda/ usdahome?navid=DATA_STATISTICS>. 20 Jan. 2016.
Walter, L. C.; Rosa, H. T.; Streck, N. A.; Ferraz, S. E. T. Adaptação e avaliação do modelo InfoCrop para simulação do rendimento de grãos da cultura do arroz irrigado. Engenharia Agrícola, v.32,