Genetic parameters and agronomic evaluation
of cassava genotypes
Rodrigo de Souza Silva(1), Elisa Ferreira Moura(2), João Tomé de Farias Neto(2) and José Edson Sampaio(2)
(1)Universidade Federal Rural da Amazônia, Avenida Presidente Tancredo Neves, no 2.501, Terra Firme, CEP 66077‑830 Belém, PA, Brazil. E‑mail: [email protected] (2)Embrapa Amazônia Oriental, Travessa Dr. Enéas Pinheiro, s/no, Marco, Caixa Postal 48, CEP 66095‑903 Belém, PA, Brazil. E‑mail: [email protected], [email protected], [email protected]
Abstract – The objective of this work was to estimate genetic parameters and predict genetic values for the selection of cassava (Manihot esculenta) genotypes in the state of Pará, Brazil. The trial was performed with 56 genotypes in two growing seasons (2012/2013 and 2013/2014), in the municipality of Igarapé-Açu, in the state of Pará, using the augmented blocks design with two control treatments. The evaluated traits were: plant shoot weight (PSW), number of roots per plant (NRP), number of rotten roots per plant (NRRP), fresh root yield (FRY), harvest index (HI), and starch content in the roots (SCR). The restricted maximum likelihood (REML) and best linear unbiased prediction (BLUP) methods were used. There was genetic variability among genotypes for PSW, NRP, HI, and SCR. Broad-sense heritability estimates were low for PSW and SCR, but were moderate for NRP and HI. However, the heritabilities of the average of genotypes were higher for PSW
and SCR. The genetic gains of the five best genotypes varied from 6.0 to 11.08% (PSW), 15.81 to 27.10% (NRP), 9.82 to 12.14% (HI), and 1.90 to 2.20% (SCR). There is genetic variability among cassava genotypes,
and the possibility of genetic gains based on selection is moderate for this region in the state of Pará.
Index terms: Manihot esculenta, genetic breeding, genetic variability.
Parâmetros genéticos e avaliação agronômica de genótipos de mandioca
Resumo – O objetivo deste trabalho foi estimar parâmetros genéticos e predizer valores genéticos para a seleção de genótipos de mandioca (Manihot esculenta) no Estado do Pará. O experimento foi realizado com 56 genótipos, em duas safras (2012/2013 e 2013/2014), no Município de Igarapé-Açu, no Estado do Pará, em delineamento de blocos aumentados, com duas testemunhas. Os caracteres avaliados foram: peso da parte aérea da planta (PPAP), número de raízes por planta (NRP), número de raízes podres por planta (NRPP), produtividade de raízes frescas (PRF), índice de colheita (IC) e teor de fécula nas raízes (TFR). Utilizaram-se as metodologias de máxima verossimilhança restrita (REML) e melhor predição linear não viciada (BLUP). Houve variabilidade genética entre os genótipos para PPAP, NRP, IC e TFR. Estimativas de herdabilidade no sentido amplo foram baixas para PPAP e TFR, mas médias para NRP e IC. No entanto, as herdabilidades das médias dos genótipos foram maiores para PPAP e TFR. Os ganhos genéticos dos cinco melhores genótipos
variaram de 6,0 a 11,08% (PPAP), 15,81 a 27,10% (NRP), 9,82 a 12,14% (IC) e 1,90 a 2,20% (TFR). Há
variabilidade genética entre os genótipos de mandioca, e a possibilidade de ganho genético baseado na seleção é moderada para essa região no Estado do Pará.
Termos para indexação: Manihot esculenta, melhoramento genético, variabilidade genética.
Introduction
Cassava (Manihot esculenta Crantz) is mainly
cultivated by small farmers in tropical and subtropical countries, because its roots are an important source of carbohydrates (Howeler et al., 2013). The origin of the species is South America, and Brazil is most likely its center of origin and domestication (Olsen, 2004; Léotard et al., 2009). The Amazonian region probably
represents a stock of its genetic resources. According
to Instituto Brasileiro de Geografia e Estatística
(Levantamento..., 2015), the Brazilian production of cassava in 2014 reached 23 million tons, and the state of Pará is the country’s greatest producer, contributing
with 21% total production.
by landraces selected by farmers. The conservation of cassava germplasm is essential to reduce genetic erosion and to supply part of the genetic diversity for genetic breeding programs (Fukuda et al., 2005). A fundamental action in the process of genetic breeding is the genotypic prediction of the most promising genotypes, which depends on the estimation of genetic parameters, as well as on the correlations among traits under selection (Resende et al., 2001; Oliveira et al., 2015).
However, researches on estimates of genetic parameters for cassava quantitative traits and of polygenic heritage (Resende, 2002; Ojulong et al., 2008) are still scarce in Brazilian conditions (Barreto & Resende, 2010; Farias Neto et al., 2013). The separation of total variation into inheritable and
non‑inheritable components is fundamental to define
the progress and best strategies for selection. Accurate estimates of variation components and determinants for selection, using optimal procedures of estimation and prediction, are important in cassava breeding, enabling maximization of gains via selection (Furlani et al., 2005; Oliveira et al., 2014).
The objective of this work was to estimate genetic parameters and predict genetic values for the selection
of cassava (Manihot esculenta) genotypes in the state
of Pará, Brazil.
Materials and Methods
Two experiments were carried out to evaluate 56 genotypes, belonging to the active germplasm bank of Embrapa Amazônia Oriental (Table 1), in the municipality of Igarapé-Açu, in the state of Pará, Brazil, in the 2012/2013 and 2013/2014 growing seasons. Trials were established in July and harvest was done 12 months later. Genotypes were randomly chosen based on the availability of the propagative
material. The climate of the region is classified as
Am according to Köppen. The average rainfall is of 2,495 mm and the average temperature per year is 26.4°C (Instituto..., 2009). The soil is a Latossolo
Amarelo distrófico (Santos et al., 2013), i.e., an Oxisol
of medium texture.
The experiment was established in the augmented blocks design, with the number of genotypes distributed homogenously over six blocks and ten genotypes plus the control treatments distributed
in lines of ten plants each. In the present study, the propagative material and the area to install other types of experimental designs was limited. The BRS Poti and BRS Kiriris cassava cultivars, both tolerant to root rot disease, were used as the control treatments. Plots were represented by ten plants for each genotype. The planting trial was performed in 1.0×1.0-m spacing with tillage and plowing for soil preparation. Only one fertilizer application was performed with nitrogen, phosphorous, and
potassium, using the formula N-P2O5-K2O 10-28-20,
at 35 days after planting of stakes, when 40 g of fertilizer were used per planting spot and no irrigation was performed.
Evaluations were carried out when plants were 12 months old, considering as useful plot the eight middle plants of the line. The evaluated traits were: fresh root yield (FRY), measured per plot and converted into kilograms per hectare; starch content in the roots (SCR), measured by the method of hydrostatic balance (Grossman & Freitas, 1950); number of roots per plant (NRP); number of rotten roots per plant (NRRP); plant shoot weight (PSW), measured in kilograms; and harvest index (HI), which represents the ratio between fresh root yield and total plant weight, measured according to Kawano (1990). Traits were measured as in Fukuda & Guevara (1998), and, when plots contained lost data, values of the PSW, NRP, NRRP, and FRY traits were corrected for seven plants according to Cruz (2006). In one of the evaluated years, data of four genotypes could not be collected and, therefore, were eliminated from the analysis.
Data was analyzed using the restricted maximum likelihood/best linear unbiased prediction (REML/
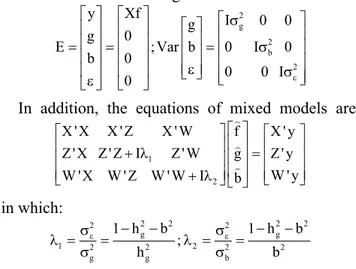
BLUP) procedure, proposed by Resende (2007), using the Selegen‑REML/BLUP software (Resende, 2007), according to the model: y = Xf + Zg + Wb + ε, in
which: y is the vector of data; f is the vector of effects assumed as random (control treatments); g is the vector of genotypic effects assumed as random; b is the vector of the effect of trials or blocks assumed as
random; ε is the vector of random errors; and X, Z,
and W are the matrices of the incidence of f, g, and b,
respectively. Model 70, described by Resende (2007),
The used distribution and structure of means and variances are the following:
E y g b Xf Var g b I g = = = ε ε σ 0 0 0 2 ;
0 0 0 0 0 0 2 2 I I b σ σε
In addition, the equations of mixed models are:
X X X Z X W
Z X Z Z I Z W W X W Z
' ' ' ' ' ' ' ' + λ 1
W W I f g b X y Z y W y ' ' ' ' + = λ2 in which: λ σ σ λ σ σ ε ε 1 2 2 2 2 2 2 2 2 2 2 2 1 1 = = − − = = − − g g g b g h b h h b b ;
The broad-sense heritability at individual plots
was measured by: hg g g b
2=σ2 σ2+σ2+σ2 ε
( ) whereas the
adjusted heritability of the average of genotypes was:
hm2 = g2 g2+
(
2 b)
σ σ σε .
The coefficient of determination of block effects
was determined by: b2 =σb2 σg2+σ2b+σ2
ε in which σg
2
is the genotypic variance among genotypes; σb
2 is the
variance among blocks or trials; and σ
ε
2 is the residual
variance among plots.
The estimators of components of variance via REML
were: σ
g y y f X y g Z y b W y N r x
2 = − − −
' ' ' ' ' ' '
[
− ( ) ;]
σ σ σ σ
ε ε
g q b b s
2 2 22 2 2 33
=[g'g+ trC ] ; =[b' + trC ]
for which C22 and C33 came from:
− − =
=
1 111 12 13
22 23
31 32 33
11 12 13
22 23
C
C C C
C C C
C C C
C C C
C C C
21 21
3
31 32 33
C C C
.Table 1. Identification of the 56 cassava (Manihot esculenta) genotypes from the germplasm bank of Embrapa Amazônia
Oriental (Cpatu), located in the state of Pará, Brazil, used in the trials for selection based on six quantitative traits.
Number Genotype Sampling location in Brazil Number Genotype Sampling location in Brazil
1 Cpatu 151 Unknown 29 Cpatu 003 Soure, PA
2 Cpatu 149 Unknown 30 Cpatu 489 Paragominas, PA
3 Cpatu 063 Unknown 31 Cpatu 375 Moju, PA
4 Cpatu 016 Altamira, PA 32 Cpatu 507 Paragominas, PA
5 Cpatu 296 Monte Alegre, PA 33 Cpatu 381 Moju, PA
6 Cpatu 138 Tabatinga, AM 34 Cpatu 483 Paragominas, PA
7 Cpatu 331 Santarém, PA 35 Cpatu 344 Santarém, PA
8 Cpatu 437(1) Cruz das Almas, BA 36 Cpatu 073 Tracuateua, PA
9 Cpatu 403(1) Cruz das Almas, BA 37 Cpatu 152 Nova Timboteua, PA
10 Cpatu 170 Pedra Branca do Amapari, AP 38 Cpatu 028 Igarapé-Açu, PA
11 Cpatu 089 Cruz das Almas, BA 39 Cpatu 324 Belterra, PA
12 Cpatu 332 Santarém, PA 40 Cpatu 382 Moju, PA
13 Cpatu 305 Santarém, PA 41 Cpatu 211 Unknown
14 Cpatu 317 Belterra, PA 42 Cpatu 159 Medicilândia, PA
15 Cpatu 511 Moju, PA 43 Cpatu 510 Moju, PA
16 Cpatu 004 Bragança, PA 44 Cpatu 397 Acará, PA
17 Cpatu 064 Unknown 45 Cpatu 299 Marará, AM
18 Cpatu 385 Castanhal, PA 46 Cpatu 347 Santarém, PA
19 Cpatu 363 Cpatu in Belém, PA 47 Cpatu 301 Igarapé-Açu, PA
20 Cpatu 362 Cpatu in Belém, PA 48 Cpatu 190 Ferreira Gomes, AP
21 Cpatu 364 Cpatu in Belém, PA 49 Cpatu 196 Unknown
22 Cpatu 051 Unknown 50 Cpatu 393 Acará, PA
23 Cpatu 053 Unknown 51 Cpatu 544 Abaetetuba, PA
24 Cpatu 119 Oiapoque, AP 52 Cpatu 066 Unknown
25 Cpatu 441 Igarapé-Açu, PA 53 Cpatu 067 Unknown
26 Cpatu 017 Unknown 54 Cpatu 006 Belém, PA
27 Cpatu 100 Urucará, AM 55 Cpatu 080 Castanhal, PA
28 Cpatu 010 Portel, PA 56 Cpatu 502 Moju, PA
For the abovementioned equations, C is the
coefficient matrix of the mixed model equations; tr is
the trace operator matrix; r(x) is the rank of matrix X; and N, q, and s are the total number of data, genotypes, and blocks or trials, respectively.
The significance of random effects was obtained by
the analysis of deviance (Anadev) using the REML method, which is advantageous over the use of analysis of variance in cases of unbalanced data. The likelihood radio test (LTR) was also used, as described
by Resende (2007). Deviances were obtained using
the model with and without effects, by subtracting the deviance obtained in the complete model from the model without effects and by comparing it with the
qui‑square test, at 5% probability (Borges et al., 2010).
Descriptive statistics and correlations among traits
were estimated, and significance tests were performed using the t test, at 5% probability. The adequate
number of replicates was calculated by the formula:
Ac = [rh2/1 + (r - 1)h2]1/2, in which r is the number
of replicates; h2 is the broad-sense heritability at
individual plots; and Ac is the accuracy of selection measured as percentage (Resende & Barbosa, 2005).
Results and Discussion
Significant differences were observed in the mixed
analysis using unbalanced data for PSW, NRP, HI, and SCR between genotypes (Table 2), indicating genetic variation and the possibility of genetic gains. However,
there was no significant difference for NRRP and FRY.
Genetic variation for cassava root traits, including root
yield, has been commonly identified in different studies
in Brazil (Barreto & Resende, 2010; Oliveira et al.,
2014, 2015) and in Africa (Aina et al., 2007; Ojulong
et al., 2008; Tumuhimbise et al., 2015). Possibly, in the present study, the augmented blocks design was
not suitable to detect differences for root yield. Farias Neto et al. (2013) evaluated ten cassava genotypes in three different locations in the state of Pará, using a
randomized complete block design, and identified CVe for root yield of 20.9%, which, in the present work, reached 44.5% for FRY, affecting the detection of
genetic variation.
Genetic correlations are important measures in genetic studies, since they can quantify the possibility of indirect gains by selection based on correlated traits, especially for those with low heritability. The genetic correlation among traits varied from low to average magnitude (Table 3). There were positive and
significant correlations between PSW and NRP, PSW
and FRY, and FRY and NRP (Table 3). These positive
and significant correlations were expected, since the
increase in root yield has been associated with plant shoot growth and with the increase in the number of roots (Elias et al., 2001; Tumuhimbise et al., 2015).
However, a negative and significant correlation was verified between FRY and NRRP, which was also
expected, since root rot leads to yield loss.
A positive and significant correlation was obtained
between FRY and HI. In addition, HI was also negatively correlated both with PSW, which was expected, since HI represents the ratio between root weight and total plant weight, and with NRRP. Barreto & Resende
(2010) identified similar results when they evaluated
250 cassava genotypes in the Western Amazon.
According to the estimates of broad-sense
heritabilities at individual plots (hg2) and of coefficients
of genotypic variation (CVg), traits showed variability
and were heritable (Table 4). Furthermore, besides the different magnitudes, there was the possibility of genetic gains after the selection of the best genotypes
(Table 5). Although the PSW trait showed high CVg, its
hg2 was low, with intermediate magnitude for selective
Table 2. Analysis of deviance of the following traits: plant shoot weight (PSW), number of roots per plant (NRP), number of rotten roots per plant (NRRP), fresh root yield (FRY), harvest index (HI), and starch content in the roots (SCR) of 56 cassava (Manihot esculenta) genotypes that belong to the germplasm bank of Embrapa Amazônia Oriental, located in the state of Pará, Brazil.
Effect PSW NRP NRRP FRY HI SCR
Deviance(1) LRT(2) Deviance LRT Deviance LRT Deviance LRT Deviance LRT Deviance LRT
Genotype 737.27 8.85* 873.80 4.94* 624.96 0.32ns 804.59 3.83ns 880.59 24.32* 478.70 5.41*
Complete model 728.42 - 868.86 - 624.64 - 800.76 - 856.27 - 473.29
-(1)Deviance of adjusted model with and without effects, with distribution for 1 degree of freedom. (2)LRT, likelihood ratio test, with chi‑square of 3.84, at 5%
accuracy. According to Resende & Duarte (2007),
values of selective accuracy above 0.90 are of high
magnitude, of 0.70 to 0.89 are intermediate, and of
around 0.60 are medium. Resende (2002) highlighted that selective accuracy can be used to rank genotypes
for selection and can inform about the efficacy of
the genotypic values regarding genotype inference. This means that selective accuracy with intermediate values can indicate classes of high precision and medium selectiveness (Borges et al., 2010). Among the methods of prediction, BLUP has the ability to maximize selective accuracy (Resende, 2002; Furlani et al., 2005).
The estimates obtained for genetic gains for PSW,
based on the selection of the five best genotypes, varied from 6.0 to 11.08%, when compared with the
general mean of the evaluated sample (Tables 4 and 5).
Oliveira et al. (2015) assessed 47 cassava genotypes and identified higher values of hg2 (0.67) and selective
accuracy (0.93) for shoot yield, with genetic gains
that varied from 8.4 to 20.4%, considering the ten
best genotypes. The low hg2 observed in the present
study may be an effect of the high CVe (Table 4), which reflected on low values of genetic gains with the selection of the five best genotypes. However,
the existence of genetic variability was detected for this trait, which can be further selected under better experimental control conditions. PSW is an important trait of cassava considering animal nutrition and propagative material for farmers. This trait may also be adopted for the selection of genotypes with the aim to provide leaves for human feed, since, in some parts of the North region of Brazil, there is a tradition to
prepare a food known as “maniçoba” from the leaves of cassava.
NRP presented low CVg and moderate hg2 values,
and a selective accuracy of intermediate magnitude
(Table 4); however, hg2 can be considered high due
to the quantitative and polygenic nature of this trait (Resende, 2002). These values can guarantee genetic
gains varying from 15.81 to 27.10%, considering the selection of the five best genotypes, when compared
with the general mean of the population (Tables 4 and
5). Barreto & Resende (2010) identified lower values
of hg2 (0.18) and CVg (19.3%), besides interval of
genetic gains that varied from 26.4 to 32.8%, with the selection of the five best genotypes for NRP. Oliveira et al. (2015) identified hg2 of 0.51 and CVg of 33.6%
for NRP, as well as genetic gains that varied from 16.1
to 33.8%, for the ten best genotypes. The lower genetic
gain detected in the present work, in comparison with
Table 3. Estimate of correlation coefficients among the
following traits: plant shoot weight (PSW), number of roots per plant (NRP), number of rotten roots per plant (NRRP), fresh root yield (FRY), harvest index (HI), and starch content in the roots (SCR) of 56 cassava (Manihot esculenta) genotypes that belong to the germplasm bank of Embrapa Amazônia Oriental, located in the state of Pará, Brazil.
Traits PSW NRP NRRP FRY HI
NRP 0.31*
NRRP 0.02ns 0.17ns
FRY 0.35* 0.30* -0.30*
HI -0.55* -0.20ns -0.52* 0.43*
SCR -0.16ns 0.11ns 0.09ns 0.01ns 0.08ns
*Significant by the t test, at 5% probability. nsNonsignificant.
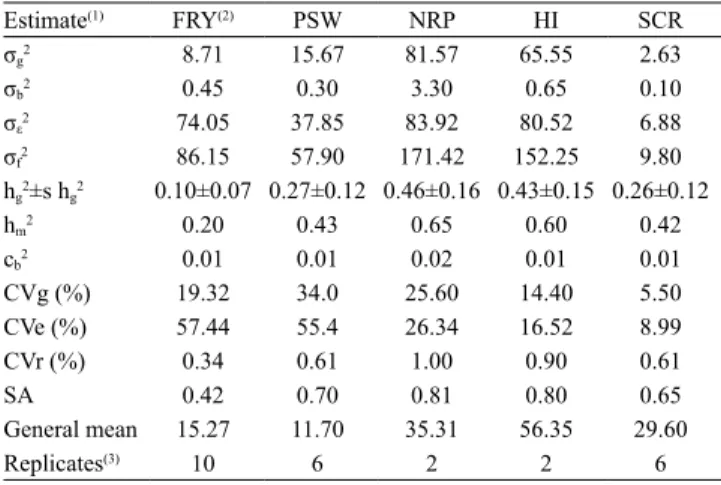
Table 4. Estimate of the variance components for the
following traits: fresh root yield (FRY), plant shoot weight (PSW), number of roots per plant (NRP), harvest index (HI), and starch content in the roots (SCR) of 56 cassava (Manihot esculenta) genotypes that belong to the germplasm bank of Embrapa Amazônia Oriental, located in the state of Pará, Brazil.
Estimate(1) FRY(2) PSW NRP HI SCR
σg2 8.71 15.67 81.57 65.55 2.63
σb2 0.45 0.30 3.30 0.65 0.10
σε2 74.05 37.85 83.92 80.52 6.88
σf2 86.15 57.90 171.42 152.25 9.80
hg2±s hg2 0.10±0.07 0.27±0.12 0.46±0.16 0.43±0.15 0.26±0.12
hm2 0.20 0.43 0.65 0.60 0.42
cb2 0.01 0.01 0.02 0.01 0.01
CVg (%) 19.32 34.0 25.60 14.40 5.50
CVe (%) 57.44 55.4 26.34 16.52 8.99
CVr (%) 0.34 0.61 1.00 0.90 0.61
SA 0.42 0.70 0.81 0.80 0.65
General mean 15.27 11.70 35.31 56.35 29.60
Replicates(3) 10 6 2 2 6
(1)σ
g2, genotypic variance; σb2, environmental variance between blocks; σε2,
residual variance; σf2, individual phenotypic variance; hg2, coefficient of
broad-sense heritabilitities at individual plots; hg2 ±s hg2, standard deviation
of heritability; hm2, adjusted heritability of the average of genotypes; cb2,
intraclass correlation coefficient; CVg, genotypic coefficient of variation; CVe, residual coefficient of variation; CVr, relative coefficient of variation;
and SA, selective accuracy. (2)FRY, nonsignificant trait with distribution for
1 degree of freedom; chi‑square of 3.84, at 5% probability; and analysis
of deviance. (3)Number of replicates based on the formula described by
these studies, was probably an effect of the lower genetic variation among genotypes for NRP. The value
of CVe was below 30%, but this coefficient alone does
not allow a proper evaluation of the experimental
quality; the ideal is to consider the CVr value, which was 1.00 (Table 4). CVr showed a better possibility
to obtain genetic gains with the selection of the best genotypes. It should be noted that genotypes with better values for NRP (Table 5) were not the same for FRY (data was not shown for FRY). When combined, these traits can improve cassava yield, which can be achieved with directed crossings among selected genotypes. Crossings have been successfully used in genetic breeding programs of cassava (Ceballos et al., 2004).
Therefore, considering the results of hg2, selective
accuracy, and CVr for NRP in the present study, there
are moderate perspectives for the selection of this trait in the initial phases of a genetic breeding program before the test of the best genotypes in more accurate
trials. Aina et al. (2007) identified cassava root traits
with moderate values of hg2 and suggested that they can
be improved based on their phenotypic performances.
For the HI trait, low CVg, moderate hg2, and selective
accuracy of intermediate magnitude were observed (Table 4). Ojulong et al. (2008) obtained the same
value for hg2 for HI when they analyzed 979 genotypes
from the International Institute of Tropical Agriculture
(IITA); however, Aina et al. (2007) found higher value
of hg2 (0.57). In the present study, values of CVg and
hg2 guaranteed genetic gains of 9.82 to 12.14% with the
selection of the five best genotypes, when compared
with the general mean of the sample (Tables 4 and 5). The control treatments were most promising for HI (Table 5), which indicated low innovative potential
of the genotypes evaluated for this trait. However, the
general mean for HI was above 50% (Table 4), which
was considered satisfactory in another study with cassava (Peixoto et al., 2005). This can be an indicative
of high root production, confirming indirect selection
for FRY, since HI tends to shows higher levels of heritability (Kawano et al., 1998).
The NRP and HI traits can be considered as good criteria for selection regarding root yield, since FRY
showed low hg2 (Table 4) and significant variation was
not detected for this trait at p >0.05 (Table 2). However, indirect selection based on HI has to consider that high values for this trait may also be an effect of low shoot growth and that the data has to be analyzed for each genotype to aid in the selection.
For HI, a low value was observed for CVe and a value close to 1.0 for CVr (Table 4). These values
indicate moderate genetic control of this trait, and more accurate trials can generate higher estimates of genetic parameters.
The lowest value of CVg was obtained for the SCR
trait. However, the general mean for this trait was high, which indicates the existence of materials with SCR
above 30%. In the present study, the value of hg2 was
low and selective accuracy was of medium magnitude (Table 4). Oliveira et al. (2015), however, obtained
high starch yield estimates for 47 genotypes of cassava, whereas Kizito et al. (2007) identified hg2 of 0.42 for
SCR in the analysis of genotypes with low hydrogen cyanide and high dry matter contents. Oliveira et al.
(2015) found that this difference in the results of hg2
concerning SCR may be due to the use of different methods to determine dry matter in the roots, as well as to the effects of location and harvest time. The values obtained in the present study provided genetic gains
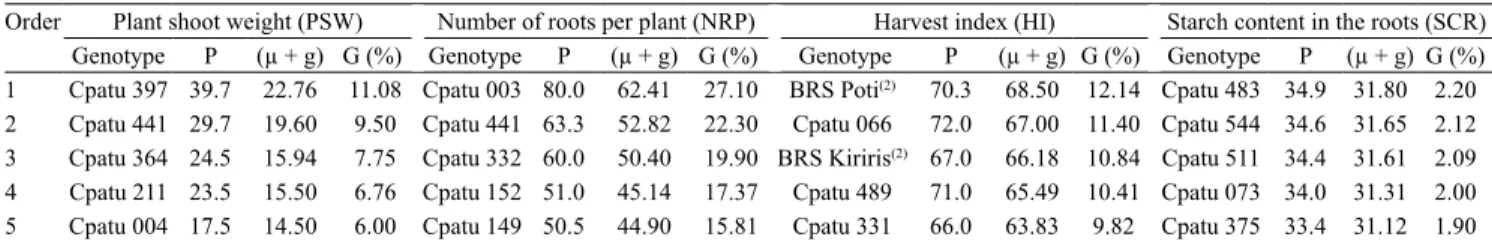
Table 5. Order, genotype, average phenotypic value (P), average genotypic value (µ+g), and genetic gain value (G) of the
five best cassava (Manihot esculenta) genotypes from the germplasm bank of Embrapa Amazônia Oriental (Cpatu), located in the state of Pará, Brazil(1).
Order Plant shoot weight (PSW) Number of roots per plant (NRP) Harvest index (HI) Starch content in the roots (SCR) Genotype P (µ + g) G (%) Genotype P (µ + g) G (%) Genotype P (µ + g) G (%) Genotype P (µ + g) G (%) 1 Cpatu 397 39.7 22.76 11.08 Cpatu 003 80.0 62.41 27.10 BRS Poti(2) 70.3 68.50 12.14 Cpatu 483 34.9 31.80 2.20
2 Cpatu 441 29.7 19.60 9.50 Cpatu 441 63.3 52.82 22.30 Cpatu 066 72.0 67.00 11.40 Cpatu 544 34.6 31.65 2.12 3 Cpatu 364 24.5 15.94 7.75 Cpatu 332 60.0 50.40 19.90 BRS Kiriris(2) 67.0 66.18 10.84 Cpatu 511 34.4 31.61 2.09
4 Cpatu 211 23.5 15.50 6.76 Cpatu 152 51.0 45.14 17.37 Cpatu 489 71.0 65.49 10.41 Cpatu 073 34.0 31.31 2.00 5 Cpatu 004 17.5 14.50 6.00 Cpatu 149 50.5 44.90 15.81 Cpatu 331 66.0 63.83 9.82 Cpatu 375 33.4 31.12 1.90
from 1.90 to 2.20% with the selection of the five best
genotypes, in comparison with the general mean of the sample (Tables 4 and 5).
Low values were observed for CVe and CVr;
the latter were due to low genetic variability among genotypes (Table 4). This indicated that SCR had low environmental effect on local conditions, and evaluations of SCR in a higher number of divergent cassava genotypes may guarantee better results of
genetic selection for this trait. Higher values of CVe
for starch yield were detected by Oliveira et al. (2014,
2015). However, estimates of CVg for starch yield
were low for a sample of 250 cassava genotypes assessed in the state of Amazonas, Brazil (Barreto & Resende, 2010).
Individual heritability estimates were of lower magnitude for FRY, PSW, and SCR. However, the heritabilities were more elevated when based on
genotype means (hm2 = 0.20, hm2 = 0.43, and hm2 = 0.42,
respectively) (Table 4). The major difference observed
between hg2 and hm2 for the PSW and SCR traits can
be attributed to the lower phenotypic variation in the calculation of inheritance due to reduction in residual variance (Table 4). This procedure most likely attenuated the variation in repeated measures and
proved to be a method for increasing the efficiency
of selection for FRY, PSW, and SCR. Similar results were obtained by Oliveira et al. (2014) for the amylose content trait in cassava roots.
The values of the intraclass correlation coefficient
(cb2), a parameter that quantifies variability within
blocks, varied from 0.01 to 0.02 for FRY, PSW, NRP,
HI, and SCR (Table 4), which indicated fine quality of
the experiment, according to Resende (2002).
Conclusions
1. Cassava (Manihot esculenta) genotypes have
genetic variation that can be used in genetic breeding programs.
2. Selection based on the harvest index can be applied due to its positive correlation with root yield.
3. The improvement of cassava is possible based on the following evaluated traits: shoot plant weight, number of roots per plant, number of rotten roots per plant, fresh root yield, harvest index, and starch content in the roots.
Acknowledgments
To Coordenação de Aperfeiçoamento de Pessoal de Nível Superior (Capes), to Conselho Nacional de
Desenvolvimento Científico e Tecnológico (CNPq,
Process No. 408042/2013-3), to Embrapa (Project No.
010601071409), and to Fundação Amazônia Paraense
de Amparo à Pesquisa (Fapespa, Icaaf 145/2014), for
financial support and scholarship grants.
References
AINA, O.O.; DIXON, A.G.O.; AKINRINDE, E.A. Effect of soil moisture stress on growth and yield of cassava in Nigeria. Pakistan Journal of Biological Sciences, v.10, p.3085‑3090, 2007. DOI:
10.3923/pjbs.2007.3085.3090.
BARRETO, J.F.; RESENDE, M.D.V. de. Avaliação genotípica de
acessos de mandioca no Amazonas e estimativas de parâmetros genéticos. Revista de Ciências Agrárias, v.53, p.131-136, 2010. DOI: 10.4322/rca.2011.018.
BORGES, V.; FERREIRA, P.V.; SOARES, L.; SANTOS,
G.M.; SANTOS, A.M.M. Seleção de clones de batata-doce pelo procedimento REML/BLUP. Acta Scientiarum. Agronomy, v.32,
p.643‑649, 2010. DOI: 10.4025/actasciagron.v32i4.4837.
CEBALLOS, H.; IGLESIAS, C.A.; PÉREZ, J.C.; DIXON, A.G.O. Cassava breeding: opportunities and challenges. Plant Molecular Biology, v.56, p.506‑516, 2004. DOI: 10.1007/s11103‑004‑5010‑5.
CRUZ, C.D. Programa Genes: estatística experimental e matrizes.
Viçosa: Ed. da UFV, 2006. v.1, 285p.
ELIAS, M.; MCKEY, D.; PANAUD, O.; ANSTETT, M.C.; ROBERT, T. Traditional management of cassava morphological and genetic diversity by the Makushi Amerindians (Guyana, South America): perspectives for on-farm conservation of crop genetic resources. Euphytica, v.120, p.143‑157, 2001. DOI:
10.1023/A:1017501017031.
FARIAS NETO, J.T. de; MOURA, E.F.; RESENDE, M.D.V.
de.; CELESTINIO FILHO, P.; AUGUSTO, S.G. Genetic parameters and simultaneous selection for root yield, adaptability and stability of cassava genotypes. Pesquisa Agropecuária Brasileira, v.48, p.1562-1568, 2013. DOI: 10.1590/S0100-204X2013001200005.
FUKUDA, W.M.G.; COSTA, I.R.S.; SILVA, S. de O. e. Manejo
e conservação de recursos genéticos de mandioca (Manihot esculenta Crantz) na Embrapa Mandioca e Fruticultura Tropical. Cruz das Almas: Embrapa Mandioca e Fruticultura, 2005. 4p. (Embrapa Mandioca e Fruticultura Tropical. Documento,
74).
FUKUDA, W.M.G.; GUEVARA, C.L. Descritores morfológicos
e agronômicos para a caracterização de mandioca (Manihot esculenta Crantz). Cruz das Almas: Embrapa Mandioca e Fruticultura, 1998. 38p. (Embrapa Mandioca e Fruticultura.
FURLANI, R.C.M.; MORAES, M.L.T. de; RESENDE, M.D.V. de.; FURLANI JÚNIOR, E.; GONÇALVES, P. de S.; VALÉRIO FILHO, W.V.; PAIVA, J.R. de. Estimation of variance components
prediction of breeding values in rubber tree breeding using the REML/BLUP procedure. Genetics and Molecular Biology, v.28,
p.271‑276, 2005. DOI: 10.1590/S1415‑47572005000200017.
GROSSMAN, J.; FREITAS, A.C. Determinação do teor de
matéria seca pelo peso específico em raízes de mandioca. Revista
Agronômica, v.160/162, p.75‑80, 1950.
HOWELER, R.; LUTALADIO, N.; THOMAS, G. Save and
grow: cassava. A guide to sustainable production intensification.
Rome: FAO, 2013. 129p.
INSTITUTO NACIONAL DE METEOROLOGIA. Normais climatológicas do Brasil 1961‑1990. Brasília: INMET, 2009. Available at: <http://www.inmet.gov.br/portal/index.php?r=clima/ normaisClimatologicas>. Accessed on: Oct. 13 2014.
KAWANO, K. Harvest index and evolution of major food crop cultivars in the tropics. Euphytica, v.46, p.195-202, 1990. DOI:
10.1007/BF00027218.
KAWANO, K.; NARINTARAPORN, K.; NARINTARAPORN, P.; SARAKARN, S.; LIMSILA, A.; LIMSILA, J.; SUPARHAN,
D.; SARAWAT, V.; WATANANONTA, W. Yield improvement in
a multistage breeding program for cassava. Crop Science, v.38, p.325-332, 1998. DOI: 10.2135/cropsci1998.0011183X00380002
0007x.
KIZITO, E.B.; RÖNNBERG-WÄSTLJUNG, A.-C.; EGWANG, T.; GULLBERG, U.; FREGENE, M.; WESTERBERGH, A. Quantitative trait loci controlling cyanogenic glucoside and dry matter content in cassava (Manihot esculenta Crantz) roots. Hereditas, v.144, p.129‑136, 2007. DOI: 10.1111/j.2007.0018‑06
61.01975.x.
LÉOTARD, G.; DUPUTIÉ, A.; KJELLBERG, F.; DOUZERY,
E.J.P.; DEBAIN, C.; GRANVILLE, J.‑J. de; MCKEY, D.
Phylogeography and the origin of cassava: new insights from northern rim of the Amazonian basin. Molecular Phylogenetics and Evolution, v.53, p.329-334, 2009. DOI: 10.1016/j. ympev.2009.05.003.
LEVANTAMENTO SISTEMÁTICO DA PRODUÇÃO
AGRÍCOLA: pesquisa mensal de previsão e acompanhamento das safras agrícolas no ano civil. Rio de Janeiro: IBGE, v.29, 2015. 83p.
OJULONG, H.; LABUSCHANGNE, M.T.; FREGENE, M.; HERSELMAN, L. A cassava clonal evaluation trial based on a new cassava breeding scheme. Euphytica, v.160, p.119-129, 2008.
DOI: 10.1007/s10681‑007‑9590‑4.
OLIVEIRA, E.J. de; AIDAR, S. de T.; MORGANTE, C.V.; CHAVES, A.R. de M.; CRUZ, J.L.; COELHO FILHO, M.A.
Genetic parameters for drought-tolerance in cassava. Pesquisa Agropecuária Brasileira, v.50, p.233-241, 2015. DOI: 10.1590/
S0100‑204X2015000300007.
OLIVEIRA, E.J.; SANTANA, F.A.; OLIVEIRA, L.A.; SANTOS, V.S. Genetic parameters and prediction of genotypic values
for root quality traits in cassava using REML/BLUP. Genetics and Molecular Research, v.13, p.6683‑6700, 2014. DOI: 10.4238/2014.August.28.13.
OLSEN, K.M. SNPs, SSRs and inferences on cassava’s origin. Plant Molecular Biology, v.56, p.517‑526, 2004. DOI: 10.1007/ s11103-004-5043-9.
PEIXOTO, J.R.; BERNARDES, S.R.; SANTOS, C.M. dos;
BONNAS, D.S.; FIALHO, J. de F.; OLIVEIRA, J.A. Desempenho
agronômico de variedades de mandioca mansa em Uberlândia, MG. Revista Brasileira de Mandioca, v.18, p.19-24, 2005.
RESENDE, M.D.V. de. Genética biométrica e estatística no
melhoramento de plantas perenes. Brasília: Embrapa Informação
Tecnológica, 2002. 975p.
RESENDE, M.D.V. de. SELEGEN‑REML/BLUP: sistema
estatístico e seleção genética computadorizada via modelos lineares
mistos. Colombo: Embrapa Florestas, 2007. 359p.
RESENDE, M.D.V. de; BARBOSA, M.H.P. Melhoramento
genético de plantas de propagação assexuada. Colombo: Embrapa Florestas, 2005. 130p.
RESENDE, M.D.V. de; DUARTE, J.B. Precisão e controle de
qualidade em experimentos de avaliação de cultivares. Pesquisa Agropecuária Tropical, v.37, p.182‑194, 2007.
RESENDE, M.D.V. de; FURLANI‑JÚNIOR, E.; MORAES,
M.L.T. de; FAZUOLI, L.C. Estimativas de parâmetros genéticos e predição de valores genotípicos no melhoramento do cafeeiro pelo procedimento REML/BLUP. Bragantia, v.60, p.185-193, 2001.
DOI: 10.1590/S0006‑87052001000300005.
SANTOS, H.G. dos; JACOMINE, P.K.T.; ANJOS, L.H.C. dos;
OLIVEIRA, V.A. de; LUMBRERAS, J.F.; COELHO, M.R.;
ALMEIDA, J.A. de; CUNHA, T.J.F.; OLIVEIRA, J.B. de. Sistema
brasileiro de classificação de solos. 3.ed. rev. e ampl. Brasília: Embrapa, 2013. 353p.
TUMUHIMBISE, R.; SHANAHAN, P.; MELIS, R.; KAWUKI, R. Genetic variation and association among factors influencing storage root bulking in cassava. Journal of Agricultural Science, v.153, p.1267‑1280, 2015. DOI:
10.1017/S0021859614000999.