IRSTI 06.56.01 https://doi.org/10.26577/be-2019-3-e10
Nawaz Ahmad
1, Salwa Sharif
2,
Maria José Palma Lampreia Dos-Santos
3 1PhD, Assistant Professor, e-mail: [email protected]2MPhil Scholar, e-mail: [email protected] 1,2 Institute of Business Management, Pakistan, Karachi 3PhD, Assistant Professor, ISCTE – University Institute of Lisbon,
Portugal, Lisbon, e-mail: [email protected]
THE PERFORMANCE COMPARISON
OF THE OPEN-ENDED FUND AND
CLOSE-ENDED MUTUAL FUND IN PAKISTAN
This research study show performance comparison of the Net Asset Values (NAVs) return of Open-ended and Close-Open-ended mutual funds in Pakistan. The aim of the study to analyze the dissimilarity between the “net asset values” (NAVs) returns of the open-ended and close-ended mutual funds. The monthly data of Net Asset Value return of both open-ended funds and close-ended funds were taken over the period from 2006 till 2011 (inclusive). The NAVs return was computed through (LN) natural log function. The normality test was conducted initially and then the Kolmogorov-Smirnov and Shapiro-Wilk test were applied, their result showed that the data is not normally distributed. The Mann- Whitney U test and then further the Kruskal Wallis was conducted to check for the differences between these two groups of independent variables. It showed dissimilarity between the net asset value returns of the open-ended and close-open-ended mutual funds. Further Kruskal Wallis test results indicated significant differences between the open-ended and close-ended funds. It is concluded that the performance of open-ended and close-ended mutual funds is not the same. Also, growth is witnessed in the mutual fund industry and many close-ended funds have been converted to open-ended funds.
Key words: Open-ended fund, Net Asset Value, Close-ended fund
JEL Classification: C12, C14, L10 Наваз Ахмад1, Салва Шариф2, Мария Хосе Пальма Лампрея Дос-Сантос3 1PhD, доцент, e-mail: [email protected] 2магистр, e-mail: [email protected] 1,2 Бизнесті басқару институты, Пәкістан, Карачи қ. 3PhD, доцент, ISCTE – Лиссабон университеті, Португалия, Лиссабон қ., e-mail: [email protected] Пәкістандағы ашық және жабық жарналық қорлардың жұмыс нәтижелерін салыстыру Бұл зерттеу Пәкістандағы ашық және жабық жарналық қорлардың таза активтерінің табыстылығын салыстыруға бағытталған. Зерттеудің мақсаты – ашық және жабық жарналық инвестициялық қорлардың «активтерінің таза құны» арасындағы айырмашылықты талдау. Ашық және жабық қорлардың активтерінің таза құны туралы ай сайынғы мәліметтер 2006 жылдан 2011 жылға дейінгі кезең үшін жиналды. Таза актив құнының мәні натурал логарифм (LN) функциясын қолдана отырып есептелді. Бастапқыда нормативті тексеру жүргізілді, содан кейін Колмогоров-Смирнов және Шапиро-Вилк тесттері қолданылды, оның нәтижелері мәліметтер қалыпты үлестірілмегенін көрсетті. Тәуелсіз айнымалыларды екі тобының арасындағы айырмашылықтарды тексеру үшін Манн-Уитни және Крускал-Уоллис U-тестілері де өткізілді. Нәтижесінде ашық және жабық қорлардың таза актив құнындағы айырмашылықтар анықталады. Крускал-Уоллис тестінің одан әрі нәтижелері ашық және жабық қорлар арасындағы айтарлықтай айырмашылықтарды көрсетті. Ашық және жабық қорлардың көрсеткіштері сәйкес келмейді деген қорытынды жасалды. Сонымен қатар, жарналық қорлар саласының өсуі байқалды, көптеген жабық қорлар ашық қорларға айналды. Түйін сөздер: ашық қор, таза активтер құны, жабық қор.
Наваз Ахмад1, Салва Шариф2, Мария Хосе Пальма Лампрея Дос-Сантос3 1PhD, доцент, e-mail: [email protected] 2магистр, e-mail: [email protected] 1,2 Институт управления бизнесом, Пакистан, г. Карачи 3PhD, доцент, ISCTE – Университет Лиссабона, Португалия, г. Лиссабон, e-mail: [email protected] Сравнение результатов деятельности открытых и закрытых паевых фондов в Пакистане Данное исследование посвящено сравнению эффективности доходности чистых активов открытых и закрытых паевых инвестиционных фондов в Пакистане. Целью исследования является анализ разницы «чистой стоимости активов» между открытыми и закрытыми паевыми инвестиционными фондами. Ежемесячные данные о чистой стоимости активов как открытых, так и закрытых фондов были собраны за период с 2006 по 2011 год (включительно). Чистая стоимость активов была вычислена с помощью функции натурального логарифма (LN). Первоначально был проведен тест на нормальность, а затем были применены тесты Колмогорова-Смирнова и Шапиро-Вилка, результаты которых показали, что данные нормально не распределены. Для проверки различий между этими двумя группами независимых переменных также были проведены U-тест Манна-Уитни и Крускал-Уоллиса. В результате определены различия чистой стоимости активов открытых и закрытых фондов. Дальнейшие результаты теста Крускала-Уоллиса показали значительные различия между открытыми и закрытыми фондами. Сделан вывод о том, что показатели открытых и закрытых фондов не совпадают. Кроме того, наблюдается рост в индустрии паевых фондов, и многие закрытые фонды были преобразованы в открытые фонды. Ключевые слова: открытый фонд, чистая стоимость активов, закрытый фонд. Introduction
A mutual fund is a portfolio of investments which is organized and professionally maintained to match with the investment purposes of investors as stated in their prospectus. In mutual fund money is collected from different investors and by investing in a variety of tradable financial assets such as stocks, money market instruments, bonds, and similar assets, positive returns are earned.
A mutual fund is beneficial for investors with limited knowledge, time and money. It gives access o to diversified portfolios which are professionally managed to small investors which seems quite difficult with a small amount of capital. Also, mutual funds are less risky than buying individual securities. Usually, a management fee is charged as funds are managed by fund managers. These fees are often concealed in several places of the prospectus. Usually, Income is earned, and capital appreciation is realized by investing in mutual funds. Both are shared with the investors in proportion of units owned by them.
Mutual fund was announced in the 1890s, in the United States but became most popular across the globe in the early 1980s. Initially, the U.S. funds were close-ended mutual funds whereas the first open-ended mutual fund was established in March 1924 with redeemable shares as the Massachusetts Investors Trust. In 2016, there were 530
closed-ended mutual funds in the U.S with collective assets of $300 billion, hence accounting for 1% of the U.S industry. Whereas most mutual funds are open-ended funds, 8066 in number with collective assets of $16.3 trillion, summing up to 86% of U.S industry.
In Pakistan, the mutual fund was introduced in the year 1962. This happened with the establishment of “National Investment (Unit) Trust” (NIT), by public offering as an open-ended mutual fund. One more fund, namely “Investment Corporation of Pakistan (ICP)” was established in the year 1966. It introduced a series of twenty-six close-ended funds. Till 1990 these twenty-six mutual funds floated by ICP, however in June 2000 government has considered the option of restructuring the corporation. In 2001 “mutual funds association of Pakistan” (MUFAP) was publically reckoned as the figure of asset management companies in the country. In 2002 privatization of ICP started and 25 out of 26 close-ended mutual funds were split.
The Mutual fund industry of Pakistan has exhibited tremendous progress over the last periods where expansion has been witnessed in many Asset management companies (AMCs), the number of funds and types of funds. It shows a growth of 52% during the financial year 2012. It continues to remain an important alternative investment avenue due to its comprehensive suite of products with
multiple investment classes and diversity of funds offered like:
The growth fund is a diversified portfolio, in
which fund investment is made in the companies that are in the expansion phase or reinvest their earnings or spend in research and development(R&D) or do acquisitions. The main objective is capital appreciation.
The money market fund is an open-ended fund,
typically invest in cash or cash equivalent and short- term debt securities like commercial papers or T-bills. These funds are considered safe like bank deposits and also offer a higher yield. This is a useful option for investors who seek limited exposure to loss.
The tracker fund is also known as the index fund.
It gives exposure to an entire index to the investor but at low cost. It usually tracks a segment or market index. This fund replicates the performance of a market fund.
The income fund is a kind of asset allocation
fund and usually invest in stocks that give good dividends. It may be the bond fund or stock fund.
This fund is for those investors who are more interested in the income rather than the capital gains. There are many varieties of income fund and the primary differentiation can be made on the types of the securities they invest to generate income.
The equity fund only invests in stocks and
known as the stocks funds. The size of this fund is determined by the investment style or market capitalization. It can be further broken down into local or international funds. Also, there can be funds that specially target business sectors like, real estate, health care etc.
The Islamic fund only invests in securities are
which are Shariah- Compliant.
The fund of funds invests in a variety of funds
instead of directly buying stocks, bonds or other securities.
The asset allocation fund maintains a portfolio
by investing in different asset classes. This fund includes bonds, stocks and cash equivalents. A balanced fund comprises of balanced allocation of fixed income and equities such as 60% stocks and 40% bonds or vice versa.
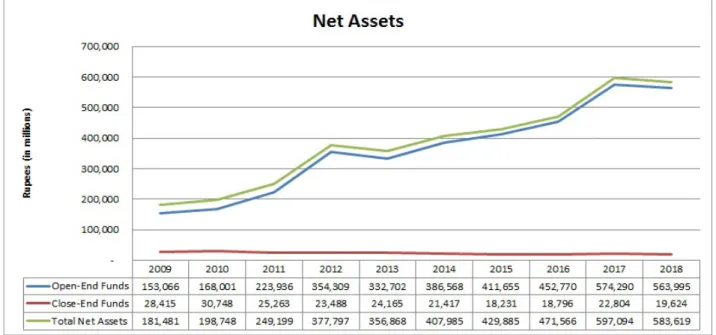
Figure 1 – Net assets (2009-2018)
Source: http://www.mufap.com.pk By observing the historical performance of
the mutual funds, the investors and the portfolio managers can make better investment decisions, therefore performance assessment of mutual funds is significant for both the investment fund managers and the investors. In this way, investors may also get
the opportunity to assess the performance of mutual funds managers. In 2009 the net asset value of close-ended mutual funds was PKR 28.4 billion and open-ended funds was PKR 153 billion, whereas in 2018 the net asset value of the close-ended fund was PKR 19.6 billion and the open-ended funds was
PKR 563.9 billion. Total net assets in 2009 were PKR 181.4 billion and in 2018 it raised to PKR 583.6 billion. This reflects a significant increase in the mutual funds’ investments from 2009 to 2018 thus emphasizing the importance of mutual funds’ performance evaluation (figure 1).
Kinds of the Mutual Fund (MF): The most com-The most com-mon kinds of the mutual fund are the open-ended (OEF) and the close-ended mutual funds (CEF). Both funds are managed by the Portfolio manag-ers sometimes they have a team of analysts to help them.
In Pakistan “The Securities and Exchange Com-mission of Pakistan (SECP)” is the controller of Mutual fund industry. SECP has the responsibility to issue licenses to fund management companies. It also does continuous monitoring of mutual funds through reports that are issued by them. Asset Man-agement Companies (AMCs) operates the mutual fund in Pakistan. AMCs, which are a public limited company, are registered under Companies Ordi-nance 1984.
By investing in mutual funds, specific security risk can be diversified. This also results in compara-tively low investment and operating costs due to the pooling of investor funds.
The Open-Ended fund (OEF): In the open-ended
mutual fund, unlimited shares are issued and more shares are created when investors purchase shares. In this fund, there are no restrictions on the issuance of the number of funds. When shares are sold, they are taken out of circulation. Open-ended funds are less liquid in nature. In this fund manager has to sell some of the investments to pay to the investor if a larger number of shares are sold (called redemp-tion). In the open-ended fund, price is adjusted at the trading day’s end. Majority of funds are open-ended and considered a convenient investment.
The Close-Ended fund (CEF): In close-ended
mutual funds a definite quantity of shares is shared by an “initial public offering” (IPO). These funds are usually listed on the stock exchange. They are bought and sold on the open market and are more liquid in nature. Typically, they are traded on an ex-change at a substantial discounted price or premium price in comparison to their “net asset value. This is dependent on the fund supply and demand through-out the trading day.
The mutual fund can be managed by a fund man-ager either passively or actively. The fund manman-ager role is very important in profit or loss-making of the fund hence effecting fund performance. Fund man-ager based on research, their knowledge and assess-ment make the analytical decision related to funds
buying and selling. The fund manager should abide by the prevailing market laws and comply with regulatory authorities. Also, their utmost duty is to protect the wealth and investment of their investors.
In the passively-managed fund, the fund manag-er doesn’t choose the investment securities, but se-curities are automatically chosen to match with the market or target index. This fund usually follows the market index and it does not require ta management team for securities decision making like the actively – managed funds. Overall portfolio turnover is low, also it incurs fewer expenses and taxes. An actively- managed fund, the fund manager either solely, with other managers, or with the team manage the fund and make conclusions about which securities to buy or sell on the basis of their knowledge and due dili-gence.
Literature Review
Some studies have used the fund’s size and age as their basis of estimation like Sawicki and Finn (2002) in their study of a sample size of 55 Austra- in their study of a sample size of 55 Austra-in their study of a sample size of 55 Austra-lians funds confirms that fund size and age effect on the performance of young funds. Another study by Rao (1996) in which 964 mutual funds sample size was analyzed for a period of 1994 concluded an inconsequential association of age and expenses for US mutual fund industry and that 12b – 1 plan did not offer economic value to the stockholders. Soder-lind, Engstrom and Dahlquist (2000) conducted re-search on the Swedish market and concluded that equity funds performance has a negative relation with fees. The performance of a smaller equity fund was relatively better than larger equity funds. Also, it finds some evidence that the performance of ac-tive- managed equity funds is better than funds that are passive-managed.
Kleinam and Sahu (1988) studied the impact of mutual fund size on its total return and mentioned that in United States small mutual funds are perform-ing better as they have significant positive risk than big mutual funds. Whereas Gorman (1991) study found that smaller funds determined on the basis of net assets achieved higher returns. It also mentioned that most of the mutual funds exhaust economies of scales and decline in returns. Also concluded that the superior performance of the portfolio cannot be completely related to higher risk.
Some studies conducted to show the relation-ship between mutual fund expenses and returns. Like O’Neal and Livingston (1998) study on open-ended mutual funds emphasized that expenses are important and show an adverse relationship between
fund returns and fund expense. In their study of the Finnish market, Korkeamaki and Smythe Jr (2004) concluded that investors were not compensated by giving higher risk-adjusted returns for paying high-er expenses phigh-ertaining to bank managed and oldhigh-er funds charge. Carhart (1997) examined the US fund market and there is an adverse relationship between performance of the fund and its expense ratio, the portfolio turnover and load Elton, Gruber and M (1993) Evaluated US mutual funds and found a neg-ative relation between the magnitude of the perfor-mance of equity fund and the expense ratio.
In the study of Sharpe (1966) a model of 34 open-ended mutual funds for a period of ten years from 1954-1963 were evaluated on their perfor-mance. It emphasized the relationship between the present and the past performance of mutual funds. Also concluded that good performance schemes re-lated to low expense ratio instead of investment size. In their study on US mutual funds Otten & Den-nis (2004) concluded due to the number of expenses charged, funds underperform the market.
In their research Eton, Gruber & Blake (1996) has taken into account USA mutual funds and the data claims. Their findings reflect that mutual funds on average underperform the market after taking into consideration the expenses charged to investors. Similarly, Warmer (2000) in their study evaluated the performance of the American mutual funds and mentioned that those funds that outperformed the market by 1.3% each year actually underperformed due to the transaction costs and the expenses.
In their study, Ramasamy & Yeung (2003) con- con- con-ducted research about factors that are significant in the selection of fund by financial consultants in Malaysia. The study mentioned that there were only three main aspects deploying the performance of the fund, namely the size of funds, the cost of the transaction and the reliable past performance of mutual funds. In their study, Glenn and Patrick (2004) found out that due to the reason of facing the possibility of redemption more cash is required as an asset for open-ended funds than the close-ended funds, which also means that money is less invested in the open-ended funds that leads to low returns.
In their work Brown & Goetzmann (1995) con- con- con-cluded that as a predictor for future mutual funds we can look at their past performance. Further empha-sized that mutual fund returns are repeatedly corre-lated over a period.
In the study of Hartzell, Muhlhofer & Titman (2010) different styles of investment handling un- different styles of investment handling un- different styles of investment handling un-der mutual fund were compared and it was conclud-ed that the actively managconclud-ed portfolio performconclud-ed
better as their managers were making the required adjustment timely than those with the passive style of holding investment.
In their work Philpot, Douglas & James (2000) emphasized that equity mutual fund performance is consistent relative to other funds. Also, mentioned that investors may invest in bonds through the mu-tual fund for the sake of diversification.
According to Sondhi & Jain (2010) in their study of Indian equity mutual funds have examined the market performance and risk for a period of 3 years using a sample of 36 equity fund. It concluded that the open-ended, close-ended, size of fund and ownership pattern has an important impact on the risk-adjusted investment performance. Also con-firmed that high-risk funds are not necessary to give high returns.
In their study, Jayadev (1996) examined the performance by using monthly returns of the two growth-oriented mutual funds and used Jensen, Treynor and Sharpe measures to analyze the perfor-mance. It concluded that on all three measures the performance of the Master gain fund was better than the Magnum express.
In their work JG (1974) measured the perfor- measured the perfor-measured the perfor-mance of 123 funds by using Jensen’s alpha, Sharpe ratio and Treynor ratio. He used monthly data rang-ing from 1960 – 1969 and concluded that the perfor-mance of funds was not better than the New York Stock Exchange (NYSE)
Several studies were also conducted on the mu-tual fund performance in Pakistan over period of time, like Cheema & Shah (2006) conducted re-like Cheema & Shah (2006) conducted re- (2006) conducted re- conducted re- conducted re-search by taking the yearly data ranging from 1994-2004 period and concluded that mutual funds play a significant role in amplifying corporate governance, so the regulatory framework should be organized in a style that boost progress of mutual fund industry.
In their work, Shah & Hijaz (2005) evaluated the Pakistan mutual fund industry performance in their research and concluded the funds that face the diversification problem usually underperforms. Fur-thermore, mentioned that the achievement of mutual fund industry of Pakistan depends on the compre-hensive role of regulating bodies and performance of the fund industry. Also, annual reports should state the risk associated with the fund so before making an investment decision it will be helpful for the investors to compare risk with expected returns. In their work Sipra (2006) conducted research on the mutual fund industry of Pakistan from 1995 to 2004. The study evaluates 33 close-ended fund performances and concluded that relative to the market performance the fund performance is not
good, as compared to the market the performance of very limited quantity of funds was better and the fund performance was not continual. But the mar-ket portfolio outperformed when risk was adjusted in Fama’s net selectivity measure. Bilawal, Khan, Hussain & U (2016) in their work examined the close-ended mutual fund performance in Pakistan from period January 2009 till December 2013 and used five different measures. The performance of funds exhibits mixed results, though Information measures and Treynor ratio reveals acceptable per-formance other measures reflect sturdy underperfor-mance.
In their study Bilal, Shah & Saifullah (2011) evaluated the performance of close-ended and open-ended mutual fund ranging over five years from 2006- 2010 and mentioned in their study that Pakistan Asset management industry is in develop-ing stage and godevelop-ing through tough macroeconomic challenges.
According to their research work, Afza & Rauf (2009) evaluated the performance of the open-ended mutual fund by applying regression analysis. It con-cluded that fund size cannot be used to differentiate between better and mediocre funds. Also, the inves-tor should consider the past performance of funds when selecting funds. Further, the results of funds with load charges and with no load charges has no big difference.
In his work Khan (2008) concluded that while making investment decision investors should con-sider funds with maximum return and minimum risks to capitalize on gain. Also, fund returns do not estimate their performance if risk aspects are not considered. And that funds past performance cannot forecast future outcomes. Razzaq, Sajid, Amir, Mu-hammad & Khan (2012) in their study taken a sam-ple of 15 conventional mutual funds over two years and evaluated their risk and return. It concluded that investors avoid investing in risky securities and that risk is a big factor in determining fund return.
Ahmad, Khoso, & Ahmed (2015) evaluated the performance of 5 open-ended and 5 close-end-ed mutual funds by applying non-parametric test. And concluded that there is no difference between NAV returns of open-ended and close-ended mutual funds.
Overall, many studies were conducted on the mutual fund industry across the globe and there are mixed results. The mutual fund industry is growing in Pakistan and by this study, we will assess the mu-tual fund performance.
The aim of the study: The core aim of this study
is to analyze the dissimilarity between the “net
as-set values” (NAVs) returns of the (OEF) and (CEF). NAV or “net asset value” is the price of an indi-vidual mutual fund share.
NAV equals the total value of all the securities divided by the number of mutual fund shares.
Though with time mutual funds are quite popular still investors are either doubtful or have lack of information regarding their performances. By this study, we would try to estimate how well the open-ended fund performed versus the close-ended mutual. This will be helpful for the understanding of the investors. This research will cater to queries like how mutual fund performance can be evaluated? Close-ended mutual fund returns are better than open-ended mutual fund returns or vice versa.
Methodology
For this study, the sample of NAVs of both, the (OEF) and (CEF) were downloaded from the avail-able websites of Pakistan stock exchange, the web-site of (MUFAP) i.e. www.mufap.com.pk and data from the asset management companies in Pakistan has been collected.
Organization of the Research. The data of all
the variables for this study pertain to the the period starting from the year 2006 to year 2011 (both in-clusive).
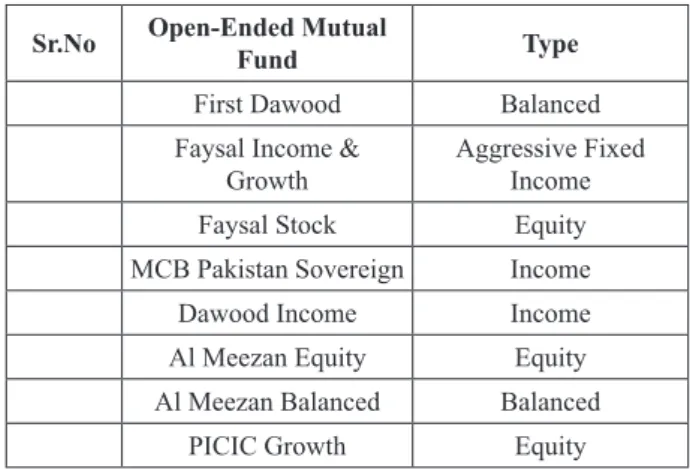
Participants. For this study, five closed-ended
funds (CEF) and five open-ended funds (OEF) have been selected (mentioned in Table 1). For Open-ended and Close-Open-ended mutual fund performance analysis we are using “Net Asset Value” (NAVs) of the open-ended and closed-ended fund as variables.
Table 1 – List of Variable
Sr.No Open-Ended Mutual Fund Type
First Dawood Balanced Faysal Income &
Growth Aggressive Fixed Income
Faysal Stock Equity
MCB Pakistan Sovereign Income
Dawood Income Income
Al Meezan Equity Equity Al Meezan Balanced Balanced
Sr.No Open-Ended Mutual Fund Type
PICIC Investment Equity Golden Arrow Selected
Stock Equity
Results and Discussion
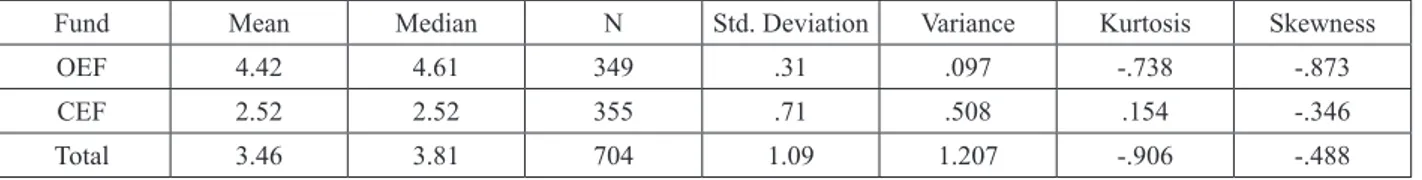
Normality Test. To check if the data is normally
distributed or not we did descriptive analysis in SPSS. For normality test mean, median and mode should be equal, kurtosis value should be 3 and skewness need to be 0. But the descriptive test result
shows that the mean is 3.46 which is not equal to the median, which is 3.81 but closer to its value. The kurtosis value is -0.906 and this is lower than the threshold value of 3, as required for normality test (Table 2).
Further, the value of skewness is -0.488 and this also reflects that the data is not normally distributed. There is another test in SPSS, namely Kolmogorov – Smirnov and Shapiro – Wilk which is also conducted to check the normality. The P-value for both the test results is below the threshold value of 0.05 which mean (P-value <0.05). And this means that the NAVs return of (OEF) and (CEF) is not equal and therefore we reject the null hypothesis (Table 3)
Continuation of table 1
Table 2 – Descriptive test results
Fund Mean Median N Std. Deviation Variance Kurtosis Skewness
OEF 4.42 4.61 349 .31 .097 -.738 -.873
CEF 2.52 2.52 355 .71 .508 .154 -.346
Total 3.46 3.81 704 1.09 1.207 -.906 -.488
Table 3 – Normality test result
Fund Kolmogorov-Smirnova Shapiro-Wilk
Statistic Df Sig. Statistic Df Sig.
Return OEF .245 349 .000 .815 349 .000
CEF .121 355 .000 .961 355 .000
Mann Whitney U Test. As our data is not
distributed normally, therefore, we applied the non-parametric test. This test is used to compare the two independent means when data is not normal.
Testing H1: The NAVs return of OEF and CEF
is equal. Close-ended fund means rank is 179.28
which is very high as compared to the mean rank of the Open-ended fund that is 528.70. Also, the sum of ranks of the open-ended fund is 184516.00 which is lowest as compared to the Open-ended fund i.e 63644.00. The test result shows that the exact significance value of 1 tailed and the exact significance of 2 tailed is 0.00 and 0.00 respectively, which is lower than the threshold P-value of 0.05. This shows that null hypothesis is rejected as there is a significant difference between the means of the Close-ended (CEF) and the Open-ended (OEF) mutual funds NAVs.
Further to check the differences between both OEF and CEF group of funds we conducted the Kruskal Wallis test. This test is used as an extension of the Mann – Whitney test. It is also sometimes called ‘one-way ANOVA on ranks’.We conducted Kruskal Wallis Test on the group of Open-ended funds and Close-ended funds that we have taken in this research, their result is provided below:
Testing H2: The NAVs return of OEF is equal:
Table 5 shows that the mean ranking of the MCB Pakistan Sovereign Fund is highest whereas the low-est in the group is of the Faysal Income & Growth Fund. And the test statistics
Table 6 shows the large value of 184.726 which indicates differences between the group of indepen-dent variables of Open-ended funds. Also, Asymp Sig value shows that there is a statistically signifi-cant difference between Open-ended funds NAVs.
Table 4 – Non-parametric significance test
Fund N Mean Rank Sum of Ranks
Return Open-ended (OEF) 349 528.70 184516.00 Close-ended (CEF) 355 179.28 63644.00 Total 704 Test Statistics NAV Mann-Whitney U 454.000 Wilcoxon W 63644.000 Z -22.793
Asymp. Sig. (2-tailed) .000
Exact Sig. (2-tailed) .000
Exact Sig. (1-tailed) .000
Point Probability .000
Table 5 – Kruskal Wallis test on open-end funds (OEF)
Name N Mean Rank
Return
Dawood Income Fund 66 191.30
Faysal stock Fund 69 187.89
MCB Pakistan Sovereign Fund 72 36.50
Faysal Income & Growth Fund 70 243.05
JS Income Fund 72 220.04
Total 349
Table 6 – Non- parametric Kruskal Wallis significance test (OEF)
Test Statistics Return
Chi-Square 184.726
Df 4
Asymp. Sig. .000
Testing H3: The NAVs return of CEF is equal. Table
7 shows that the mean ranking wise PICIC Growth Fund is the lowest whereas the highest mean rank in the group is of the Golden Arrow Fund. And the test statistics Table 7 shows the large value of 275.222 which indicates differences between the group of independent variables of Close-ended funds. And Asymp Sig value of 0.001 also shows that there is a statistically significant difference between Close-ended funds NAVs.
For the research study, the first normality test was conducted which shows that data is not normally distributed and therefore the non-parametric test
was applied. Considering the comparative study of two independent variables Mann- Whitney test is applied. The result showed a significant difference between the means of open-ended funds and closed-ended funds. Thus, we reject the null hypothesis that the Net asset value (NAVs) return of the open-ended fund and the close-ended fund is equal.
Further Kruskal Wallis test is conducted to check if there are significant differences between these two groups of independent variables and for both Open-ended and Close-ended funds it showed significant differences.
Table 7 – The Kruskal Wallis test on closed-end funds (CEF)
Ranks
Name N Mean Rank
Return
PICIC Growth Fund 72 317.21
PICIC Investment Fund 72 210.75
Al Meezan Equity Fund 63 173.41
Meezan Balance Fund 77 148.46
Golden Arrow Fund 71 39.73
Total 355
Table 8 – Non-parametric Kruskal Wallis significance test (CEF)
Test Statistics
Return
Chi-Square 275.222
Df 4
Asymp. Sig. .001
The findings of this study differ from the previ-ous study results conducted by Bilal, Shah & Saiful-lah (2011) in which they evaluated the performance of close-ended and open-ended mutual in Pakistan and concluded that there is no difference between the NAV returns of Open-end and Close end fund.
Conclusion
This research work is about the performance comparison of the NAVs return of Open-ended funds and Close-ended funds. For this research work, five Open-ended and five Close-ended mu-tual funds NAVs return was compared to evaluate the performance over the time period of six years (2006-2011).
In 1962, the mutual fund industry was estab-lished in Pakistan and with the passage of time, many funds were introduced. In 2001 “mutual funds
association of Pakistan” (MUFAP) was publically introduced and in 2002 when privatization of “In-vestment Corporation of Pakistan (ICP)” was start-ed 25 out of 26 close-endstart-ed mutual funds were split. Overall, the mutual fund industry has shown great progress over the last periods. The result reflects that there are substantial differences between the NAVs return of both the funds and this may be because of the selection of the asset in each type of funds. Also, 2002 onwards many Close-ended funds were start being converted to Open-ended funds therefore for previous year data for all the Close-ended funds is not easily accessible.
Recommendations
For further studies, a broader asset selection for the Open-ended and Close-ended funds can be taken into consideration.
References
Afza T., Rauf A. (2009) Performance Evaluation of Pakistani Mutual Funds. Pakistan Economic and Social Review, pp. 199-214.
Ahmad N., Khoso I., Ahmed R.R. (2015) A Comparative Study of NAV (Net Asset Value) Returns of Open-ended and Close-ended Mutual Funds in Pakistan. International Journal of Information, Business and Management, vol. 7(1).
B.N., Shah S.A., S.K. (2011) Performance Evaluation of Open End and Closed End Mutual Funds in Pakistan. African Journal of Business, pp. 11425-11434.
Bilawal M., Khan M.D., Hussain R.Y., U.A. (2016) Performance Evaluation of Closed Ended Mutual Funds in Pakistan. Inter-national Journal of Management Business Research, pp. 65-71.
Brown S.J., Goetzmann W.N. (1995) Performance persistence. Journal of Finance, pp. 679-699.
Carhart M.M. (1997) On persistence in Mutual Fund performance. Journal of Finance, vol. 52, pp. 56-82.
Chalmers J.M., Edelen R.M., Kadlec G.B. (1999) Transaction-Cost Expenditure and Relative Performance of Mutual Funds. Wharton Financial.
Cheema M., Shah S.A. (2006) The role of mutual funds and non banking financial companies in corporate governance of Paki-stan. Center for Management and Economic Research (CMER), pp. 6-47.
Droms W.G. (2006) Hot hands, cold hands: Does past performance predict future returns? Financial Planning Association Journal.
Elton E.J., Gruber M.J., Blake C.R. (1996) The Persistence of Risk-adjusted Mutual fund performance. Journal of Business, vol. 69, pp. 133-157.
Elton E.J., Gruber M.J., S.D., M.H. (1993) Efficiency with costly information: A reinterpretation of evidence from managed. Review of Financial Studies, vol. 6, pp. 1-22.
Glenn B.J., Patrick T. (2004) The mechanics behind investment funds: why closed‐end funds provide superior returns. Mana-gerial Finance, vol. 30.
Gorman L. (1991) A study of the relationship between Mutual Fund return and asset size. Akron Business and Economic Re-view, vol. 22, pp. 53-61.
Hartzell J.C., Mühlhofer T., Titman S.D. (2010) Alternative benchmarks for evaluating mutual fund performance. Journal of Real Estate Economist, pp. 121-154.
J.M. (1974) Objectives and performance of mutual funds, 1960–1969. Journal of Financial and Quantitative Analysis. Jayadev M. (1996) Mutual Fund Performance: An Analysis of Monthly Returns. Finance India, pp. 73-84.
Khan J.I. (2008) Performance Evaluation of Income Funds in Pakistan. NUST Business School. Retrieved from NUST Business School.
Kleiman R.T., Sahu A.P. (1988) The relationship between Mutual Fund size and risk adjusted performance. An analysis of load funds. American Business Review.
Korkeamaki T.P., Smythe Jr. T.I. (2004) Effects of market segmentation and bank concentration on Mutual Fund expenses and returns: Evidence from Finland. European Financial Management, pp. 413-438.
Lippolito R.A. (1989) Efficiency with Costly Information: A Study of Mutual Fund Performance. The Quarterly Journal of Economics, pp. 1-23.
Luther, Matatko, Corner. (1992) The Investment Performance of UK “Ethical” Unit Trusts. Journal of Accounting, Auditing and Accountability.
O’Neal E.S., Livingston M. (1998) The Cost of Mutual Fund Distribution Fees. Journal of Financial Research, pp. 205-218. Otten R., D.B. (2004) How to Measure Mutual Funds Performance: Economic Versus Statistical Relevance. Journal of Ac-counting and Finance, pp. 203-222.
Philpot J., D.H., J.R. (2000) Performance persistence and management skill in non conventional bond mutual funds. Financial Services Review, pp. 247-258.
Ramasamy B., Yeung M.C. (2003) Evaluating Mutual Funds in an emerging market: Factors that matter to financial advisors. International Journal of Bank Marketing, pp. 122-136.
Rao S.M. (1996) Does 12B-1 plan offer economic value to shareholders of Mutual Funds? Journal of Financial and Strategic, vol. 9.
Razzaq N., S.G., A.R., M.S., Khan M.B. (2012) Conventional Mutual Funds and their performance in Pakistan. Asian Journal of Business and Management Sciences, pp. 54-69.
Sawicki J., Finn F. (2002) Smart money and small funds. Journal of Business Finance and Accounting.
Shah S.A., Hijaz S.T. (2005) Performance Evaluation of Mutual Funds in Pakistan. The Pakistan development review, pp. 863-876.
Sharpe W.F. (1966) Mutual Fund Performance. Journal of Business, vol. 39, pp. 119-138.
Sipra N. (2006) Mutual Fund Performance in Pakistan 1995-2004. Centre for Management and Economic Research (CMER), pp. 1-14.
Soderlind P., Engstrom S., Dahlquist M. (2000) Performance and Characteristics of Swedish Mutual Funds. Journal of Financial and Quantitative Analysis, pp. 409-423.
Sondhi H.J., Jain P.K. (2010) Market Risk and Investment Performance of Equity Mutual Funds in India. Finance India, pp. 443-464.
Warmer R. (2000) Mutual Funds Performance: An Empirical Decomposition into stock-picking Talent, Styles, Transaction Cost and Expenses. Journal of Finance, vol. 4.