portuguese emigration
factbook 2015
Portuguese Emigration
Factbook 2015
Rui Pena Pires Cláudia Pereira Joana Azevedo Inês Espírito Santo Inês Vidigal
Portuguese Emigration Factbook 2015 was co-ordinated by Rui Pena Pires
and compiled and prepared by a research team from the Observatório da Emigração at the Instituto Universitário de Lisboa (ISCTE-IUL), CIES-IUL, Lisboa, Portugal: Rui Pena Pires, Cláudia Pereira, Joana Azevedo, Inês Espírito Santo and Inês Vidigal.
Please cite this publication as: Observatório da Emigração (2015), Portuguese Emigration Factbook 2015, Lisbon, Observatório da Emigração, CIES-IUL, ISCTE-IUL. DOI: 10.15847/CIESOEMFB2015.
First published December 2015 by Observatório da Emigração.
ISBN: 978-989-20-5329-5 DOI: 10.15847/CIESOEMFB2015 URI: http://hdl.handle.net/10071/8626
Tables and charts are provided in Excel format.
Just type the link at the beginning of each chapter to obtain the corresponding file.
The Observatório da Emigração (OEm) is based at the Centre for Research and Studies in Sociology at the University Institute of Lisbon.
Observatório da Emigração
Av. das Forças Armadas, ISCTE-IUL, 1649-026 Lisbon, Portugal Tel. (CIES-IUL): + 351 210464018
E-mail: observatorioemigracao@iscte.pt www.observatoriodaemigracao.pt
Public disclosure authorized
The OEm encourages dissemination of its work. You can copy, download or print this content for your own use, and you can include excerpts from this publication in your own documents, presentations, blogs, websites and teaching materials, provided that suitable acknowledgement of OEm as source is given.
Contents
Signs, abbreviations and acronyms ... 9
Acknowledgments ... 10
Foreword ... 11
Highlights ... 16
1 | Total emigration ... 21
Country statistical profile ... 23
Estimates of total emigration ... 25
International comparison ... 35
2 | Emigration to top destination countries ... 41
Summary ... 43 Inflows ... 46 Stocks ... 50 Citizenship ... 54 Consular data ... 60 3 | Remittances ... 63
Volume and composition ... 65
Changes ... 70
Economic weight ... 72
International comparison ... 73
4 | Focus: the census data (OECD countries) ... 77
Characteristics of Portuguese immigrants in 2010/11 ... 78
Changes 2000/01-2010/11 ... 97 Methodological remarks ... 107 Glossary ... 109 Metadata ... 113 References ... 121 Webography ... 123
List of tables, charts and maps
Tables
Table 1.1 Main social indicators: international comparison ... 23
Table 1.2 Main migration indicators: international comparison ... 24
Table 1.3 Permanent outflows of Portuguese emigrants: the historical background ... 25
Table 1.4 Estimates of the outflows of Portuguese emigrants, 2001-2014 ... 28
Table 1.3 Eurostat estimates of Portuguese net migration, 2004-2013 ... 29
Table 1.6 UN estimates of the stock of Portuguese-born emigrants, 1990-2015 ... 30
Table 1.7 Stock of Portuguese-born emigrants in EU and EFTA countries, 2000/2001 and 2010/11 ... 31
Table 1.8 Stock of Portuguese-born emigrants in OECD countries by age group and educational attainment, 2000/2001 and 2010/11 ... 33
Table 1.9 Net migration in EU and EFTA countries, 2013 ... 35
Table 1.10 Emigrants by country of origin, 2010 ... 37
Table 1.11 Emigration and immigration rates in EU countries, 2010 ... 39
Table 2.1 Main indicators of Portuguese emigration to top destination countries, 2014 or last year available ... 43
Table 2.2 Portuguese permanent inflows in top destination countries, 2014 or last year available ... 46
Table 2.3 Change in Portuguese permanent inflows in top destination countries, 2013-2014 or last two years available ... 49
Table 2.4 Stock of migrants born in Portugal in top destination countries, 2014 or last year available ... 50
Table 2.5 Change in the stock of migrants born in Portugal in top destination countries, 2013-2014 or last two years available ... 53
Table 2.6 Population with Portuguese citizenship in top destination countries, 2014 or last year available ... 54
Table 2.7 Change in the population with Portuguese citizenship in top destination countries, 2013-2014 or last two years available... 56
Table 2.8 Acquisition of citizenship by Portuguese in top destination countries, 2014 or last year available ... 57
Table 2.9 Change in the acquisition of citizenship by Portuguese in top
destination countries, 2013-2014 or last two years available... 59
Table 2.10 Stock of consular registrations in top destination countries, 2012 or last year available ... 60
Table 2.11 Change in the stock of consular registrations in top destination countries, 2011-2012 or last two years available ... 62
Table 3.1 Inward and outward remittance flows in Portugal, 2014 ... 65
Table 3.2 Top inward remittance flows in Portugal, 2014 ... 68
Table 3.3 Changes in inward remittance flows in Portugal, 2013-2014 ... 70
Table 3.4 Changes in economic weight of remittances in Portugal, 2013-2014 ... 72
Table 3.5 Top remittance-receiving countries, thousand US dollars, 2013 ... 73
Table 3.6 Top remittance-receiving countries, economic weight, 2013 ... 75
Table 4.1 Stock of Portuguese-born emigrants aged 15 and over in OECD countries by country of residence, 2010/11 ... 78
Table 4.2 Stock of Portuguese-born emigrants aged 15 and over in OECD countries by country of residence and sex, 2010/11 ... 80
Table 4.3 Stock of Portuguese-born emigrants aged 15 and over in OECD countries by country of residence and age group, 2010/11 ... 82
Table 4.4 Stock of Portuguese-born emigrants aged 15 and over in OECD countries by country of residence and nationality, 2010/11 ... 84
Table 4.5 Stock of Portuguese-born emigrants aged 15 and over in OECD countries by country of residence and duration of stay, 2010/11 ... 86
Table 4.6 Stock of Portuguese-born emigrants aged 15 and over in OECD countries by country of residence and educational attainment, 2010/11... 88
Table 4.7 Stock of Portuguese-born emigrants aged 15 and over in OECD countries by duration of stay and educational attainment, 2010/11 ... 90
Table 4.8 Stock of Portuguese-born emigrants aged 15 and over in OECD countries by country of residence and labour force status, 2010/11 ... 91
Table 4.9 Stock of Portuguese-born emigrants aged 15 and over in OECD countries by occupation, 2010/11 ... 93
Table 4.10 Stock of Portuguese-born emigrants aged 15 and over in OECD countries by country of residence and occupation (broad), 2010/11 ... 95
Table 4.11 Changes in the stock of Portuguese-born emigrants aged 15 and over in OECD countries, by country of residence, 2000/01-2010/11 ... 97
Table 4.12 Changes in the stock of Portuguese-born emigrants aged 15 and over in OECD countries, by country of residence, 2000/01-2010/11: share
of the emigrants aged 65 or older ... 99
Table 4.13 Changes in the stock of Portuguese-born emigrants aged 15 and over in OECD countries, by country of residence, 2000/01-2010/11: share of the emigrants with the nationality of the country of residence ... 101
Table 4.14 Changes in the stock of Portuguese-born emigrants aged 15 and over in OECD countries, by country of residence, 2000/01-2010/11: share of the emigrants living in the country of residence for more than ten years... 103
Table 4.15 Changes in the stock of Portuguese-born emigrants aged 15 and over in OECD countries, by country of residence, 2000/01-2010/11: share of the emigrants with high educational attainment [ISCED 5A/5B/6] ... 105
Charts
Chart 1.1 Permanent outflows of Portuguese emigrants: the historical background ... 27Chart 1.2 OEm estimates of the outflows of Portuguese emigrants, 2001-2014 ... 28
Chart 1.3 Eurostat estimates of Portuguese net migration, 2004-2013 ... 29
Chart 1.4 UN estimates of the stock of Portuguese-born emigrants, 1990-2015 ... 30
Chart 1.5 Major changes in the stock of Portuguese-born emigrants in EU and EFTA countries, 2000/2001 to 2010/11 ... 32
Chart 1.6 Stock of Portuguese-born emigrants in OECD countries by age group and educational attainment, 2000/2001 and 2010/11 ... 34
Chart 1.7 Net migration rates in EU and EFTA countries, except return flows, 2013 ... 36
Chart 1.8 Emigrants by country of origin, 2010 ... 38
Chart 1.9 Emigration and immigration rates in EU countries, 2010 ... 40
Chart 2.1 Portuguese permanent inflows in top destination countries, 2014 or last year available ... 47
Chart 2.2 Portuguese permanent inflows as a percentage of all permanent inflows in top destination countries, 2014 or last year available ... 48
Chart 2.3 Stock of migrants born in Portugal in top destination countries, 2014 or last year available ... 51
Chart 2.4 Stock of migrants born in Portugal as a percentage of all foreign-born
in top destination countries, 2014 or last year available ... 52
Chart 2.5 Population with Portuguese citizenship in top destination countries,
2014 or last year available ... 55
Chart 2.6 Acquisition of citizenship by Portuguese in top destination countries,
2014 or last year available ... 58 Chart 2.7 Stock of consular registrations in top destination countries, 2012 or
last year available ... 61 Chart 3.1 Top inward remittance flows in Portugal, 2014 ... 69
Chart 3.2 Changes in top inward remittance flows in Portugal, nominal values,
thousand euros, 2013-2014 ... 71
Chart 3.3 Changes in economic weight of remittances in Portugal, 2013-2014 ... 72
Chart 3.4 Top remittance-receiving countries, economic weight, 2013 ... 76
Chart 4.1 Stock of Portuguese-born emigrants aged 15 and over in OECD
countries by country of residence, 2010/11 (main destination
countries) ... 79
Chart 4.2 Stock of Portuguese-born emigrants aged 15 and over in OECD
countries by country of residence and sex, 2010/11 (main destination
countries) ... 81
Chart 4.3 Stock of Portuguese-born emigrants aged 15 and over in OECD
countries by country of residence and age group, 2010/11 (main
destination countries) ... 83
Chart 4.4 Stock of Portuguese-born emigrants aged 15 and over in OECD
countries by country of residence and nationality, 2010/11 (main
destination countries) ... 85
Chart 4.5 Stock of Portuguese-born emigrants aged 15 and over in OECD
countries by country of residence and duration of stay, 2010/11
(main destination countries) ... 87
Chart 4.6 Stock of Portuguese-born emigrants aged 15 and over in OECD
countries by country of residence and educational attainment,
2010/11 (main destination countries) ... 89
Chart 4.7 Stock of Portuguese-born emigrants aged 15 and over in OECD
countries by duration of stay and educational attainment, 2010/11 ... 90
Chart 4.8 Stock of Portuguese-born emigrants aged 15 and over in OECD
countries by country of residence and labour force status, 2010/11
Chart 4.9 Stock of Portuguese-born emigrants aged 15 and over in OECD
countries by occupation, 2010/11 ... 94
Chart 4.10 Stock of Portuguese-born emigrants aged 15 and over in OECD countries by country of residence and occupation (broad), 2010/11 (main destination countries) ... 96
Chart 4.11 Changes in the stock of Portuguese-born emigrants aged 15 and over, in OECD countries, by country of residence, 2000/01-2010/11 (main destination countries) ... 98
Chart 4.12 Changes in the share of Portuguese-born emigrants aged 65 or older, in OECD countries, by country of residence, 2000/01-2010/11 (main destination countries) ... 100
Chart 4.13 Changes in the share of Portuguese-born emigrants with the nationality of the country of residence, in OECD countries, by country of residence, 2000/01-2010/11 (main destination countries) ... 102
Chart 4.14 Changes in the share of Portuguese-born emigrants living in the country of residence for more than ten years, in OECD countries, by country of residence, 2000/01-2010/11 (main destination countries) ... 104
Chart 4.15 Changes in the share of Portuguese-born emigrants with high educational attainment [ISCED 5A/5B/6], in OECD countries, by country of residence, 2000/01-2010/11 (main destination countries) ... 106
Maps
Map 1.1 Stock of Portuguese-born emigrants in EU and EFTA countries, 2010/11... 32Map 2.1 Portuguese permanent inflows in top destination countries, 2014 or last year available ... 44
Map 2.2 Stock of migrants born in Portugal in top destination countries, 2014 or last year available ... 45
Map 3.1 Inward remittance flows in Portugal, 2014 ... 67
Map 3.2 Outward remittance flows in Portugal, 2014 ... 67
Signs, abbreviations and acronyms
.. missing value, not applicable or not available
EFTA European Free Trade Association
EU European Union
OECD Organisation for Economic Co-operation and Development
PALOP Países Africanos de Língua Oficial Portuguesa
(Portuguese-speaking African countries)
ISO codes for countries
AGO Angola BEL Belgium BRA Brazil CAN Canada CHE Switzerland DEU Germany ESP Spain FRA France GBR United Kingdom ITA Italy LUX Luxemburg MOZ Mozambique NLD Netherlands NOR Norway
USA United States of America
Acknowledgments
The authors would like to thank the Directorate-General of Consular Affairs and Portuguese Communities (DGACCP), from the Cabinet of the Secretary of State of Portuguese
Communities Abroad, for all the support provided. We wish to acknowledge the help provided by the national statistical institutes from the following countries: Angola (Instituto Nacional de Estatistica, INE), Brazil (Instituto Brasileiro de Geografia e Estatística, IBGE), France (Institut Nacional de la Statistique et des Études Économiques, INSEE), Germany
(Statistisches Bundesamt Deutschland, Destatis), Italy (Istituto Nazionale di Statistica, ISTAT), Luxemburg (Institut National de la Statistique et des Études Économiques du Grand-Duché du Luxembourg, STATEC), Mozambique (Instituto Nacional de Estatística, INE), Netherlands (Centraal Bureau voor de Statistiek, CBS), Spain (Instituto Nacional de Estadística, INE), Switzerland (Office Fédéral de la Statistique, OFS) and United Kingdom (Office for National Statistics, ONS).
We appreciate the data from the following institutions: Angolan Consulates in Portugal (Lisbon and Oporto), Federal Office for Migration and Refugees of Germany (Bundesamt für Migration und Flüchtlinge), Federal Office of Migrations of Switzerland (Office Fédéral des Migrations), Department for Work and Pensions of UK and the Brazilian International Migration Observatory (Observatório das Migrações Internacionais, OBMigra).
Foreword
01. Em 2014, a emigração portuguesa manteve-se em alta.1 Tal como em 2013, mais de 110 mil portugueses deixaram o país. A persistência destes volumes elevados de saídas durante os últimos cinco anos teve como consequência um aumento do número de portugueses
emigrados no mundo, o qual, de acordo com dados das Nações Unidas, ultrapassou em 2015 os 2,3 milhões de indivíduos.
02. A tendência para a estabilização da emigração num patamar elevado é convergente com a
evolução das remessas recebidas em Portugal entre 2013 e 2014. Enquanto nos dois anos anteriores o seu valor subiu de modo significativo, respetivamente, 13% e 10%, em 2014 o crescimento observado em termos nominais foi apenas de 1%. Esta quase estabilização fez-se,
porém, com os valores nomianais mais elevados de todo o perído posterior à adesão ao euro.2
03. O principal fluxo atual de emigração, para o Reino Unido, que integra quase um terço das
saídas anuais de portugueses do país, também desacelerou. Em 2014, tal como em 2013, o número de portugueses que emigrou para o Reino Unido manteve-se nos valores mais elevados de que há registo, superiores a 30 mil indivíduos por ano (com um ligeiro aumento em 2014). Porém, depois de taxas médias de crescimento anual da ordem dos 35% entre 2011
e 2013,3 também no caso da emigração para o Reino Unido se observa hoje uma tendência
para a estabilização num patamar elevado.
04. Depois de vários anos sem informação estatística oficial sobre a emigração para França
com origem em países da UE, foram finalmente publicados, em 2015, dados sobre as entradas de estrangeiros com cidadania comunitária. De acordo com esses dados, a França continua a ser um dos principais destinos da emigração portuguesa, com valores mais elevados do que os previstos. Em 2012, emigraram para França 18 mil portugueses, mais do dobro do estimado
pelo OEm no Relatório Estatístico de 2014.4 Os portugueses constituíram, em 2012, a
nacionalidade com mais entradas em França, seguidos de argelinos e marroquinos. A França é, hoje, o segundo país de destino da emigração portuguesa.
1
Data reported in this issue of the Portuguese Emigration Factbook refers to 2014 or last year available. See chapters on “Methodological remarks” and “Metadata”.
2
See Vidigal and Pires (2014).
3
See Observatório da Emigração (2014).
4
05. A estabilização da emigração portuguesa, em termos globais, esconde a existência de
variações de sentido contrário que se anulam mutuamente, umas de descida dos fluxos, outras de subida. Assim, pela primeira vez depois do eclodir da crise financeira, o número de
portugueses que emigrou para a Suíça diminuiu significativamente (-24%). No entanto, a emigração para este país continua a ter um valor elevado, pelo que a Suíça foi ainda o terceiro país para onde emigraram mais portugueses, depois do Reino Unido e da França. Esta mesma tendência para a diminuição do número de saídas em 2014, embora com intensidades varáveis, caracterizou também os fluxos para a Alemanha, Luxemburgo e Brasil.
06. Em sentido inverso, aumentou o número de entradas de portugueses na Bélgica,
Moçambique e Espanha. Na Bélgica, o crescimento foi particularmente elevado, na casa dos 35%, o que faz deste país o oitavo destino mais importante da emigração portuguesa. No caso de Espanha, foi a primeira vez, desde o início da crise financeira, que aumentou o número de entradas de portugueses. A Espanha era, no início do século, o principal destino da emigração portuguesa, situação que se alterou profundamente depois da crise financeira em resultado da
diminuição do emprego naquele país, sobretudo no sector da construção.5 A emigração para
Espanha não desapareceu mas diminuiu substancialmente, passando de mais de 27 mil, em 2007, para pouco mais de cinco mil, em 2013. Em 2014, este número subiu 12%. A Espanha é, atualmente, o quinto principal país de destino da emigração portuguesa.
07. Os efeitos da crise sobre o volume da emigração portuguesa variaram ao longo dos últimos
anos. Numa primeira fase, entre 2008 e 2010, a natureza global da crise financeira e, em particular, o impacto no emprego em Espanha acima referido, traduziram-se num decréscimo
do número de saídas, em linha com o que aconteceu à época no espaço da OCDE.6 Desde
2010, com a natureza assimétrica da chamada crise das dívidas soberanas e os efeitos
recessivos das políticas de austeridade, a emigração passou a crescer mais do que no período anterior à crise, estabilizando entre 2013 e 2014 na casa das 110 mil saídas por ano, o valor mais elevado desde 1974. É preciso recuar a 1973 para se encontrar valores para a emigração desta ordem de grandeza.
08. Aqueles valores elevados de emigração, conjugados com uma diminuição paralela da
imigração, traduzem-se em saldos migratórios negativos desde 2011. Em 10 anos, entre 2004 e 2013, Portugal, que apresentava um saldo migratório positivo de quase 50 mil indivíduos, passou a ser um dos países europeus com saldo mais negativo em termos absolutos (-36 mil
5
indivíduos), de acordo com os dados do Eurostat sobre migrações nos países da UE e EFTA. Em termos absolutos, só Polónia, Grécia e Espanha apresentavam saldos mais negativos. Descontando os efeitos dos movimentos de retorno, atrás de Portugal apenas apareciam Polónia e Roménia.
09. Apesar da emergência e crescimento de novos fenómenos migratórios caracterizados por
maior circulação entre origem e destino e a acumulação de percursos de reemigração, os dados indiciam uma tendência para a fixação dos novos emigrantes. Em 2014, a população portuguesa a residir no Reino Unido aumentou significativamente. Foram contabilizados mais 17.000 residentes nascidos em Portugal e mais 28.000 cidadãos com nacionalidade
portuguesa. Estas variações do stock, que são o resultado das novas entradas subtraídas dos falecimentos, retornos e reemigrações, só podem ser explicadas pelo predomínio das tendências para a fixação dos emigrantes portugueses que se dirigem para o Reino Unido.
10. A população nascida em Portugal a residir no estrangeiro (stock) aumentou em todos os
principais países de destino, à exceção de Espanha. Neste caso, o número de portugueses chegados nos últimos anos foi insuficiente para compensar o número dos que, em
consequência da crise, voltaram para Portugal ou reemigraram para outros países (bem como dos que morreram em Espanha).
11. Em termos absolutos, é em França que há maior número de portugueses emigrados a
adquirirem a nacionalidade do país de destino. Seguem-se Suíça, EUA e Luxemburgo. O número de processos de aquisição de nacionalidade, para além de refletir o número total de emigrantes em cada país e o seu tempo de fixação, depende também das políticas migratórias. Assim se explica, por exemplo, o elevado número de portugueses que adquiriram
nacionalidade nos EUA, por comparação com outros países onde residem mais emigrantes
portugueses.7
12. A análise dos dados dos censos de 2001 e 2011 nos países da OCDE, disponibilizados por
esta organização internacional (base de dados DIOC), permite caracterizar a população portuguesa emigrada nos diferentes países de destino e identificar as suas principais transformações durante a primeira década do novo século. Permite, ainda, distinguir os diferentes perfis migratórios da antiga e da nova emigração. As observações que se seguem refrem-se a esses dados.
7
13. Embora na população portuguesa emigrada predominem os indivíduos em idade ativa,
existe uma tendência geral para o envelhecimento que resulta do facto de o recente crescimento da emigração ser ainda insuficiente para compensar a redução verificada entre 1974 e os finais do século XX. O grupo etário dos emigrantes com mais de 64 anos passou de 9% para 16%, entre 2001 e 2011, no conjunto dos países da OCDE, graças sobretudo ao contributo do grande envelhecimento observado nos países de destino do continente americano, para onde diminui muito a intensidade dos fluxos de entrada de novos
portugueses. No Canadá, aquela percentagem atingiu os 28% em 2011, valor que contrasta fortemente com o de 7% observado, no mesmo ano, no Reino Unido, o principal país de
destino da nova emigração.8
14. Predominam também, entre os portugueses emigrados, os indivíduos com baixas e muito
baixas qualificações, embora se observe um crescimento significativo da proporção dos mais qualificados. A percentagem dos portugueses emigrados com formação superior a residir nos países da OCDE praticamente duplicou, passando de 6% para 11%, entre 2001 e 2011. Nos principais países de destino dos atuais fluxos de emigração a partir de Portugal, a situação é, no entanto, bastante diferente. No Reino Unido, a percentagem dos emigrantes com mais de 15 anos que dispunham de um diploma do ensino superior era, em 2011, de 38%. No polo oposto, aquela percentagem ficava-se pelos 7% entre os emigrantes portugueses a residir em França e os 4% entre os que se fixaram no Luxemburgo.
15. A proporção dos emigrantes com mais de 15 anos que dispunham de um diploma do
ensino superior, em 2011, é superior entre os que emigraram recentemente, há cinco ou menos anos. Esta percentagem decresce progressivamente entre os que saíram do país há mais anos. De forma inversa, nos que emigraram há dez ou mais anos é superior a
percentagem dos emigrantes com ensino básico, diminuindo essa percentagem entre os que saíram do país mais recentemente. As características da emigração para o Reino Unido nos últimos anos ilustram bem esta tendência para uma crescente qualificação da emigração
portuguesa recente, sobretudo aquela que se dirige para os novos destinos.9
16. A estrutura das qualificações reflete-se nas profissões dos portugueses emigrados, entre os
quais predominam as profissões manuais, nomeadamente os operários e trabalhadores não qualificados. Tal como acontece com as qualificações, esta estrutura varia bastante nos
8
O mesmo processo de envelhecimento pode ser observado nas populações portuguesas estabelecidas noutros países que, no passado, constituíram destinos importantes da emigração poruguesa, como o Brasil ou a Venezuela. See Pires, Machado, Peixoto, and Vaz (2011).
principais países de destino da OCDE. Em 2011, o Luxemburgo era o país com maior
percentagem de trabalhadores não qualificados entre os portugueses emigrados (36%), bem como com uma das mais baixas percentagens de dirigentes e quadros (10%). Inversamente, Dinamarca, Suécia e Irlanda eram os países com maior proporção de portugueses em profissões qualificadas (superior a 40%).
17. Refira-se, para finalizar, que os dados dos censos permitem identificar com clareza o
crescimento da emigração para novos destinos e, simultaneamente, a tendência para a fixação tanto da nova emigração como da mais antiga. Nos novos destinos, Reino Unido, Noruega, Dinamarca e Irlanda, a percentagem de emigrantes portugueses com menos de dez anos de estadia era superior a 50%, em 2011, o que confirma o crescimento recente da emigração para estes países. Pelo contrário, a grande diminuição da emigração para os principais países de destino antes de 1974 (França, EUA e Canadá) tem tradução no facto de a percentagem de portugueses com um tempo de estadia de dez e mais anos superar os 90% nestes países, em 2011. No entanto, mesmo nos países da nova emigração a percentagem de portugueses neles fixados há mais de cinco anos era superior a 40%.
18. The Factbook consists of four chapters. The first chapter provides aggregated data on total
Portuguese emigration, much of which is estimates, as well as comparative data on Portuguese and global emigration. The second chapter contains more detailed information on the four indicators of Portuguese emigration to the main destination countries: flows, stocks, citizenship, and consular records. The third chapter brings together the main information concerning remittances received in Portugal and sent from Portugal. The content of chapter four changes each year. In the first issue, last year, the Factbook provided a chronological
series on Portuguese emigration to all main destinations during the 21st century.10 This year’s
issue contains data from the 2000-01 and 2010-11 censuses concerning the socio-demographic characteristics of immigrant Portuguese populations in the main destination countries of OECD. Finally, the Factbook also contains basic information regarding the indicators and sources consulted (methodological remarks, metadata and glossary).
10
See Observatório da Emigração (2014). See also Pires, Rui Pena, Cláudia Pereira, Joana Azevedo, Inês Espírito-Santo, Inês Vidigal, and Ana Cristina Ribeiro (2015).
Highlights
Total emigration
For the second consecutive year, total inflow of Portuguese in destination countries exceeded 110 thousand migrants (both in 2013 and 2014).
In the XX and the XXI centuries, there were higher values of emigration only in five years, from 1969 to 1973, when an average of almost 150 thousand emigrants left Portugal each year.
Unemployment rate in Portugal was higher than 16% in 2013 and youth unemployment rate reached 38% in that same year.
According to estimates by the United Nations there were about two million and three hundred thousand Portuguese emigrants worldwide in 2015 (2.306.321), 10% more than five years ago.
Portuguese emigrants amount to more than 20% of the population living in Portugal. In relative terms, Portugal is the European Union country with more emigration
(after Malta).
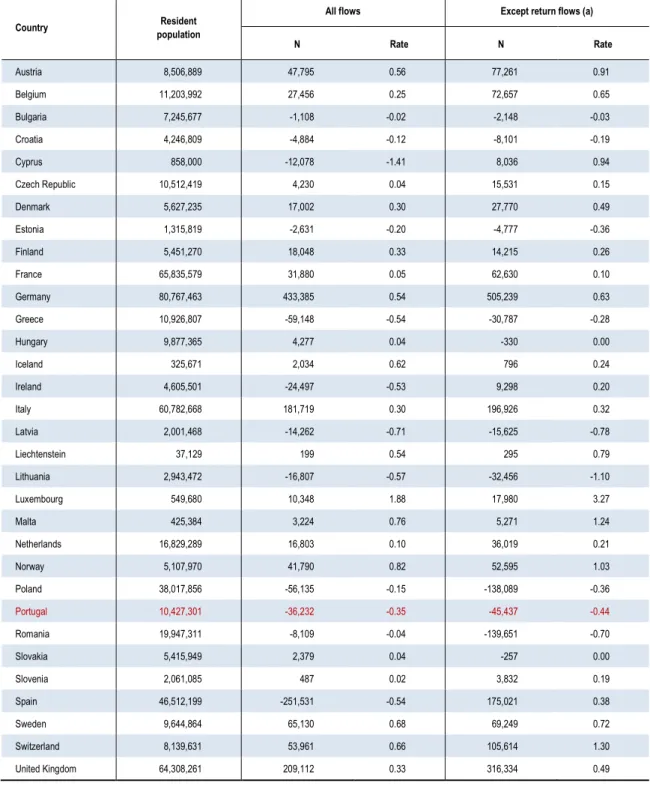
In ten years, net migration in Portugal dropped from 47 thousand, in 2004, to minus 36 thousand, in 2014, the fourth lowest value in EU after Spain, Greece and Poland.
Emigration to the main destination countries
The United Kingdom remained the main destination of Portuguese emigration, with more than 30,000 inflows from Portugal for the second consecutive year.
In 2014, all the top five countries of destination of Portuguese emigration were European: United Kingdom (30,546 Portuguese inflows), France (18,000), Switzerland (15.221), Germany (10.121), and Spain (5,923).
Outside Europe, the main destination countries of Portuguese emigration were Angola (ranked 6th in 2014), Mozambique (ranked 8th), and Brazil (ranked 11th), all of them Portuguese speaking countries.
In 2012 the Portuguese were the nationality most represented among migrant inflows in France.
In 2014, Portuguese emigration was the second migrant inflow in both Switzerland and Luxembourg, the sixth in the United Kingdom, and the seventh in Brazil.
Between 2013 and 2014, inflows of Portuguese migrants grew up mainly in Belgium (35%), Spain (12%), and Mozambique (6%).
Main decreases in the inflows of Portuguese migrants were observed in Brazil (-34%), Switzerland (-24%), Luxembourg (-16%), and Germany (-11%).
France remains the country with the highest stock of Portuguese-born migrants: 599,333 in 2012.
There are further seven countries with more than 100 thousand Portuguese-born migrants: Switzerland (211 thousand in 2013), USA (177 thousand in 2014), Canada (140 thousand in 2011), Brazil (138 thousand in 2010), United Kingdom (127 thousand in 2014), Spain (117 thousand in 2014), and Germany (107 thousand in 2014).
Portuguese-born migrants are the second most numerous immigrant populations in Switzerland (9% of all immigrants) and the third in France (11% of all immigrants). About a quarter (23%) of all immigrants living in Brazil in 2010 were Portuguese. In 2014 3,345 Portuguese acquired French citizenship.
In the same year, 2,447 Portuguese adquired the Swiss citizenship, 1,585 the USA citizenship and 1,211 the Luxembourg citizenship.
Portuguese were about a quarter (24%) of the foreigners that acquired Luxembourg citizenship in 2014.
Remittances
In 2014 there was a new record of inward remittances to Portugal exceeding three thousand million euros (€3,057,277,000) and corresponding to around 1.9% of GDP. France and Switzerland remain the source of more than half of the remittances received in
Portugal (respectively, 29% and 27% of the total).
Angola was the third country of origin of the remittances received in Portugal (8% of the total).
Brazil remains the destination for nearly half (48%) of remittances sent abroad by immigrants living in Portugal.
Between 2013 and 2014, remittances received in Portugal rose by 1.4% in nominal terms but decreased as a percentage of GDP (-1.8%).
Major remittance flows received in Portugal with largest increases between 2013 and 2014, in nominal terms, were those from the United Kingdom (29%) and Switzerland (10%).
Major remittance flows received in Portugal with largest decreases between 2013 and 2014, in nominal terms, were those from Angola (-19%) and France (-1%).
Between 2012 and 2013, Portugal dropped from 29th to 24th among the top recipient countries of migrant remittances.
The census data on Portuguese-born emigrants living in OECD countries
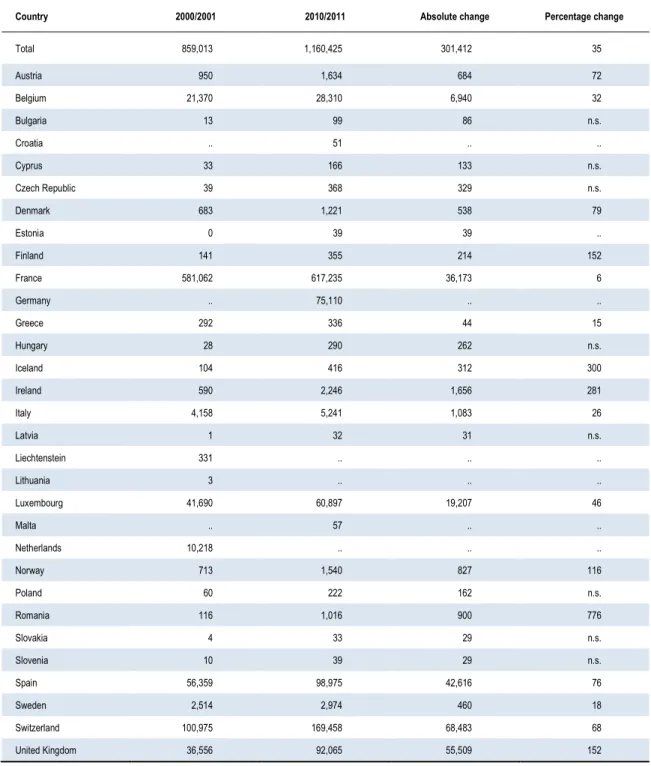
Acording to census data, the five countries with largest increases in the stockof Portuguese-born migrants between 2000/01 and 2010/11 were Switzerland (more 68 thousand Portuguese migrants), United Kingdom (55 thousand), Spain (43 thousand), France (36 thousand) and Luxembourg (19 thousand).
In relative terms, the largest increases in the major stocks of Portuguese-born migrants between 2000/01 and 2010/11 were observed in United Kingdom (152%), Spain (76%), Switzerland (68%), Luxembourg (46%), and France (6%).
Between 2000/01 and 2010/11, the share of Portuguese-born migrants aged 65 or older increased by 55%, from 11% to 17%.
In 2010/11 the share of Portuguese-born migrants aged 65 or older was higher in Canada (28%), Australia (23%) and USA (23%), and lower in Luxembourg (5%), United Kingdom (7%) and Spain (12%).
Between 2000/01 and 2010/11, the share of Portuguese-born migrants with the nationality of the country of residence increased by 14%, from 35% to 40%.
In 2010/11 the share of Portuguese-born migrants with the nationality of the country of residence was higher in Canada (83%), Australia (81%) and USA (68%), and lower in Ireland (3%), Luxembourg (6%), and United Kingdom (9%).
Between 2000/01 and 2010/11, the share of Portuguese-born migrants living in the country of residence for more than ten years decreased by -4%, from 84% to 81%. In 2010/11 the share of Portuguese-born migrants living in the country of residence
for more than ten years was higher in Canada (97%), USA (95%), Australia (94%)
and France (89%), and lower in Ireland (18%), Denemark (31%), Norway (39%) and United Kingdom (41%).
Between 2000/01 and 2010/11, the share of Portuguese-born migrants with high educational attainment [ISCED 5A/5B/6] increased by 70%, from 7% to 11%.
In 2010/11 the share of Portuguese-born migrants with high educational attainment [ISCED 5A/5B/6] was higher in Norway (40%), United Kingdom (38%) and Ireland (37%), and lower in Luxembourg (4%), Switzerland (6%), and France (7%).
In 2010/11 the share of Portuguese-born migrants with high educational attainment [ISCED 5A/5B/6] was 23% for those living in the country of residence for less than five years and 9% for those living in the country of residence for more than ten years.
In 2010/11 the share of unemployed Portuguese-born migrants aged 15 and over was 6% in OECD countries, in average, but it reached 18% in Ireland and 23% in Spain.
In 2010/11 only 19% of the employed Portuguese-born emigrants had hight or very hight skilled occupations (managers, professionals and technicians), ranging from 10%
1 | Total emigration
Country statistical profile
Table 1.1 Main social indicators: international comparison
Indicators Portugal
Top three countries of destination of Portuguese emigration (outflows)
Top three countries of origin of immigration in Portugal (inflows) United
Kingdom Switzerland Germany Brazil
Cabo
Verde Romania
Surface area (1000 km2, 2014) 92.2 243.6 41.3 357.2 8,515.8 4.0 238.4
Population (millions, 2014) 10.4 64.5 8.2 80.9 206.1 0.5 19.9
Population density (people per km2, 2014) 113.5 266.6 207.3 232.1 24.7 127.5 86.6
Urban population (% of total, 2014) 62.9 82.3 73.8 75.1 85.4 64.8 54.4
Population growth (annual %, 2014) -0.6 0.6 1.2 0.3 0.9 1.3 -0.4
Population ages 0-14 (% of total, 2014) 14.2 17.7 14.8 13.0 23.5 30.0 15.6 Population ages 65 and above (% of total, 2014) 20.4 17.5 17.8 21.1 7.6 4.7 16.9 Fertility rate, total (births per woman, 2013) 1.3 1.9 1.5 1.4 1.8 2.3 1.5
Labor force, total (millions, 2013) 5.4 32.8 4.7 42.0 108.4 0.2 9.5
Labor force with tertiary education (% of total, 2012) 19.8 38.1 34.3 28.1 .. .. 17.6 Unemployment, total (% of total labor force, ILO estimate, 2013) 16.4 7.9 4.3 5.6 4.5 6.7 7.9 Long-term unemployment (% of total unemployment, 2012) 48.7 34.7 34.7 45.2 14.6 .. 45.3 Unemployment, youth (ages 15-24, ILO estimate, 2013) 37.8 20.3 8.8 7.8 13.6 10.8 23.8 GDP (current US$, billions, 2014) 229.6 2,941.9 .. 3,852.6 2,346.1 1.9 199.0
GDP growth (annual %, 2014) 0.9 2.6 .. 1.6 0.1 2.7 1.8
GDP per capita (current US$, thousands, 2014) 22.1 45.6 .. 47.6 11.4 3.6 10.0 Infant mortality rate (deaths per 1000 live births, 2015) 3.0 3.5 3.4 3.1 14.6 20.7 9.7
Mean years of schooling (2014) 8.2 13.1 12.8 13.1 7.7 4.7 10.8
HDI score (2014) 0.8 0.9 0.9 0.9 0.8 0.6 0.8
HDI ranking (2014) 43 14 3 6 75 122 52
Note Top three countries of emigration and immigration with available data for, at least, the last three years.
Source Table by OEm, data from the World Bank, DataBank, World Development Indicators, updated 09/11/2015, and the United Nations Development Programme (UNDP), 2015 Human Development Report (for mean years of schooling, HDI score and HDI ranking).
Table 1.2 Main migration indicators: international comparison
Indicators Portugal
Top three countries of destination of Portuguese emigration (outflows)
Top three countries of origin of immigration in Portugal (inflows) United
Kingdom Switzerland Germany Brazil
Cabo
Verde Romania
Stock of emigrants (thousands, 2010) 2,230.0 4,668.3 407.8 3,540.6 1,367.1 192.5 2,769.4 Stock of emigrants as percentage of population (2010) 20.8 7.5 5.4 4.3 0.7 37.5 13.1 Emigration rate of tertiary-educated population (age of entry >
22, %, 2000) 13.1 11.7 6.6 3.2 1.9 55.5 10.2
Stock of immigrants (thousands, 2010) 918.6 6,955.7 1,762.8 10,758.1 688.0 12.1 132.8 Stock of immigrants as percentage of population (2010) 8.6 11.2 23.2 13.1 0.4 2.4 0.6 Inward remittance flows (current US$, million, 2013) 4,372.4 1,711.9 3,148.9 15,204.4 2,537.2 175.9 3,515.0 Inward remittance flows as a percentage of GDP (2013) 2.0 0.1 0.5 0.4 0.1 9.3 1.9 Outward remittance flows (current US$, million, 2013) 1,230.9 2,221.9 30,109.0 16,700.6 1,019.4 9.7 543.0 Note Top three countries of emigration and immigration with available data for, at least, the last three years.
Source Table by OEm, data from the World Bank: Migration and Remittances Factbook 2011, second edition (stocks of emigrants and of immigrants); Migration Database with Age of Entry, 1900-2000 (emigration rate of tertiary-educated population); DataBank, World Development Indicators, updated 11/06/2014 (remittance flows).
Estimates of total emigration
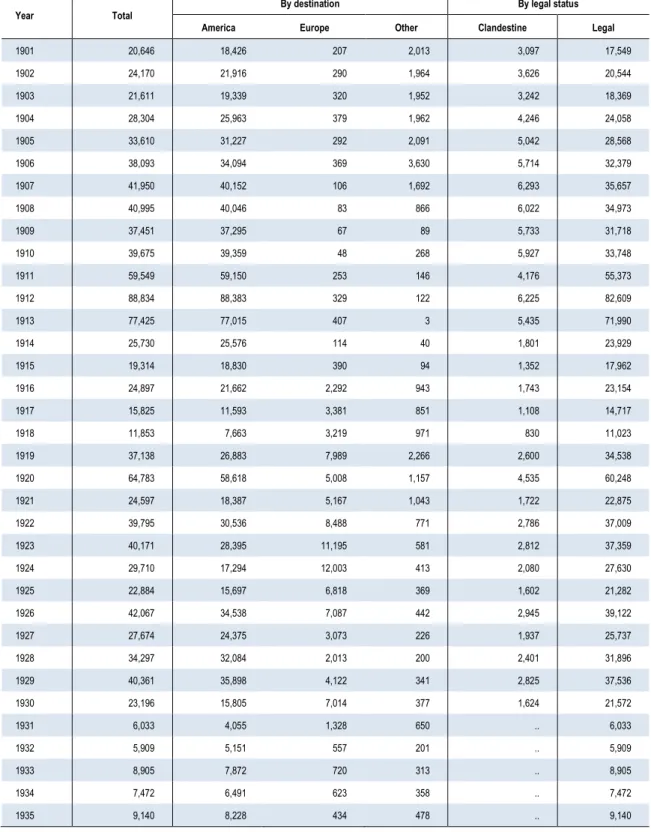
Table 1.3 Permanent outflows of Portuguese emigrants: the historical background
Year Total By destination By legal status America Europe Other Clandestine Legal
1901 20,646 18,426 207 2,013 3,097 17,549 1902 24,170 21,916 290 1,964 3,626 20,544 1903 21,611 19,339 320 1,952 3,242 18,369 1904 28,304 25,963 379 1,962 4,246 24,058 1905 33,610 31,227 292 2,091 5,042 28,568 1906 38,093 34,094 369 3,630 5,714 32,379 1907 41,950 40,152 106 1,692 6,293 35,657 1908 40,995 40,046 83 866 6,022 34,973 1909 37,451 37,295 67 89 5,733 31,718 1910 39,675 39,359 48 268 5,927 33,748 1911 59,549 59,150 253 146 4,176 55,373 1912 88,834 88,383 329 122 6,225 82,609 1913 77,425 77,015 407 3 5,435 71,990 1914 25,730 25,576 114 40 1,801 23,929 1915 19,314 18,830 390 94 1,352 17,962 1916 24,897 21,662 2,292 943 1,743 23,154 1917 15,825 11,593 3,381 851 1,108 14,717 1918 11,853 7,663 3,219 971 830 11,023 1919 37,138 26,883 7,989 2,266 2,600 34,538 1920 64,783 58,618 5,008 1,157 4,535 60,248 1921 24,597 18,387 5,167 1,043 1,722 22,875 1922 39,795 30,536 8,488 771 2,786 37,009 1923 40,171 28,395 11,195 581 2,812 37,359 1924 29,710 17,294 12,003 413 2,080 27,630 1925 22,884 15,697 6,818 369 1,602 21,282 1926 42,067 34,538 7,087 442 2,945 39,122 1927 27,674 24,375 3,073 226 1,937 25,737 1928 34,297 32,084 2,013 200 2,401 31,896 1929 40,361 35,898 4,122 341 2,825 37,536 1930 23,196 15,805 7,014 377 1,624 21,572 1931 6,033 4,055 1,328 650 .. 6,033 1932 5,909 5,151 557 201 .. 5,909 1933 8,905 7,872 720 313 .. 8,905 1934 7,472 6,491 623 358 .. 7,472 1935 9,140 8,228 434 478 .. 9,140
Year Total By destination By legal status America Europe Other Clandestine Legal
1936 12,484 12,024 .. 460 .. 12,484 1937 14,667 13,505 .. 1,162 .. 14,667 1938 13,609 11,290 .. 2,319 .. 13,609 1939 17,807 17,466 .. 341 .. 17,807 1940 13,226 13,013 .. 213 .. 13,226 1941 6,260 6,191 .. 69 .. 6,260 1942 2,214 2,108 .. 106 .. 2,214 1943 893 660 .. 233 .. 893 1944 2,424 2,168 .. 256 .. 2,424 1945 5,938 5,728 .. 210 .. 5,938 1946 8,275 8,123 .. 152 .. 8,275 1947 12,838 12,128 .. 710 .. 12,838 1948 12,343 11,474 .. 869 .. 12,343 1949 17,296 15,647 .. 1,649 .. 17,296 1950 21,892 21,491 401 .. .. 21,892 1951 34,015 33,341 674 .. 351 33,664 1952 47,407 46,544 863 .. 389 47,018 1953 39,962 39,026 936 .. 276 39,686 1954 41,190 40,234 956 .. 179 41,011 1955 30,147 28,690 1,457 .. 351 29,796 1956 28,096 26,072 2,024 .. 1,079 27,017 1957 33,894 32,150 1,744 .. 1,538 32,356 1958 35,600 29,207 6,393 .. 1,570 34,030 1959 34,754 29,780 4,974 .. 1,296 33,458 1960 35,159 28,513 6,646 .. 2,841 32,318 1961 38,572 27,499 11,073 .. 5,046 33,526 1962 43,002 24,376 18,626 .. 9,463 33,539 1963 55,218 22,420 32,798 .. 17,389 37,829 1964 75,576 17,232 58,344 .. 32,256 43,320 1965 91,488 17,557 73,931 .. 28,736 62,752 1966 111,995 33,266 78,729 .. 20,388 91,607 1967 94,712 28,584 66,128 .. 16,197 78,515 1968 96,227 27,014 69,213 .. 27,246 68,981 1969 155,672 27,383 128,289 .. 85,507 70,165 1970 183,205 22,659 160,546 .. 116,845 66,360 1971 158,473 21,962 136,511 .. 108,073 50,400 1972 115,545 20,122 95,423 .. 61,461 54,084 1973 129,732 22,091 107,641 .. 50,215 79,517
Source Table by OEm, data from Maria Ioannis Baganha and José Carlos Marques (2001), “População”, in Nuno Valério (ed.) (2001), Estatísticas Históricas Portuguesas, vol. I, Lisbon, Instituto Nacional de Estatística, pp. 33-126.
Chart 1.1 Permanent outflows of Portuguese emigrants: the historical background
Source Chart by OEm, data from Maria Ioannis Baganha and José Carlos Marques (2001), “População”, in Nuno Valério (ed.) (2001), Estatísticas Históricas Portuguesas, vol. I, Lisbon, Instituto Nacional de Estatística, pp. 33-126.
0 20.000 40.000 60.000 80.000 100.000 120.000 140.000 160.000 180.000 200.000 19 01 19 03 19 05 19 07 19 09 19 11 19 13 19 15 19 17 19 19 19 21 19 23 19 25 19 27 19 29 19 31 19 33 19 35 19 37 19 39 19 41 19 43 19 45 19 47 19 49 19 51 19 53 19 55 19 57 19 59 19 61 19 63 19 65 19 67 19 69 19 71 19 73
Table 1.4 Estimates of the outflows of Portuguese emigrants, 2001-2014
Year
Source Instituto Nacional de Estatística (National Institute of Statistics)
[A] OEm [B] Total Permanent Temporary
2001 20,223 5,396 14,827 40,000 2002 27,358 8,813 18,545 50,000 2003 27,008 6,687 20,321 60,000 2004 .. 6,757 .. 70,000 2005 .. 636 .. 75,000 2006 .. 56 .. 80,000 2007 .. 789 .. 90,000 2008 .. 20,357 .. 85,000 2009 .. 16,899 .. 75,000 2010 .. 2,376 .. 70,000 2011 100,978 43,998 56,980 80,000 2012 121,418 51,958 69,460 95,000 2013 128,108 53,786 74,322 110,000 2014 134,624 49,572 85,052 110,000
Source Table by OEm, data from: [A] Instituto Nacional de Estatística (INE), Migratory Exit Movement Survey (1992 until 2007) and Annual Estimates of Emigration (as from 2008), based on the Portuguese Labour Force Survey data, in Pordata, Contemporary Portugal Database; [B] OEm estimates based on destination countries permanent inflows data.
Chart 1.2 OEm estimates of the outflows of Portuguese emigrants, 2001-2014
20.000 40.000 60.000 80.000 100.000 120.000 2001 2002 2003 2004 2005 2006 2007 2008 2009 2010 2011 2012 2013 2014
Table 1.3 Eurostat estimates of Portuguese net migration, 2004-2013
Year Permanent outflows Permanent inflows Net migration
2004 10,680 57,920 47,240 2005 10,800 49,200 38,400 2006 12,700 38,800 26,100 2007 26,800 46,300 19,500 2008 20,357 29,718 9,361 2009 16,899 32,307 15,408 2010 23,760 27,575 3,815 2011 43,998 19,667 -24,331 2012 51,958 14,606 -37,352 2013 53,786 17,554 -36,232
Source Table by OEm, data from Eurostat, database on population and social conditions.
Chart 1.3 Eurostat estimates of Portuguese net migration, 2004-2013
Source Chart by OEm, data from Eurostat, database on population and social conditions. 0 10.000 20.000 30.000 40.000 50.000 60.000 70.000 2004 2005 2006 2007 2008 2009 2010 2011 2012 2013
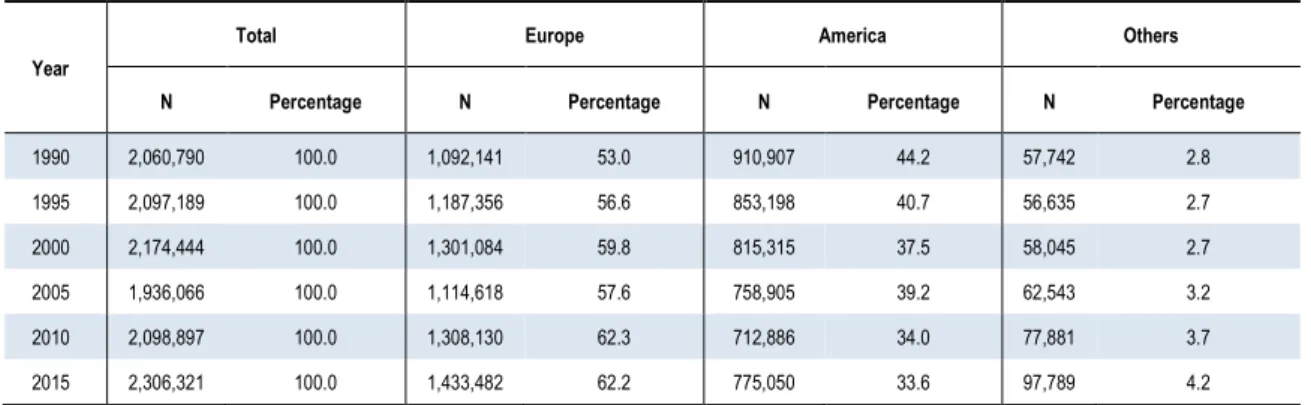
Table 1.6 UN estimates of the stock of Portuguese-born emigrants, 1990-2015
Year
Total Europe America Others N Percentage N Percentage N Percentage N Percentage
1990 2,060,790 100.0 1,092,141 53.0 910,907 44.2 57,742 2.8 1995 2,097,189 100.0 1,187,356 56.6 853,198 40.7 56,635 2.7 2000 2,174,444 100.0 1,301,084 59.8 815,315 37.5 58,045 2.7 2005 1,936,066 100.0 1,114,618 57.6 758,905 39.2 62,543 3.2 2010 2,098,897 100.0 1,308,130 62.3 712,886 34.0 77,881 3.7 2015 2,306,321 100.0 1,433,482 62.2 775,050 33.6 97,789 4.2
Source Table by OEm, data from United Nations, Department of Economic and Social Affairs, Population Division (2015), Trends in International Migrant Stock: Migrants by Destination and Origin (United Nations database, POP/DB/MIG/Stock/Rev.2015).
Chart 1.4 UN estimates of the stock of Portuguese-born emigrants, 1990-2015
Source Chart by OEm, data from United Nations, Department of Economic and Social Affairs, Population Division (2015), Trends in International Migrant Stock: Migrants by Destination and Origin (United Nations database, POP/DB/MIG/Stock/Rev.2015).
0 500.000 1.000.000 1.500.000 2.000.000 2.500.000 1990 1995 2000 2005 2010 2015
Table 1.7 Stock of Portuguese-born emigrants in EU and EFTA countries, 2000/2001 and 2010/11
Country 2000/2001 2010/2011 Absolute change Percentage change
Total 859,013 1,160,425 301,412 35 Austria 950 1,634 684 72 Belgium 21,370 28,310 6,940 32 Bulgaria 13 99 86 n.s. Croatia .. 51 .. .. Cyprus 33 166 133 n.s. Czech Republic 39 368 329 n.s. Denmark 683 1,221 538 79 Estonia 0 39 39 .. Finland 141 355 214 152 France 581,062 617,235 36,173 6 Germany .. 75,110 .. .. Greece 292 336 44 15 Hungary 28 290 262 n.s. Iceland 104 416 312 300 Ireland 590 2,246 1,656 281 Italy 4,158 5,241 1,083 26 Latvia 1 32 31 n.s. Liechtenstein 331 .. .. .. Lithuania 3 .. .. .. Luxembourg 41,690 60,897 19,207 46 Malta .. 57 .. .. Netherlands 10,218 .. .. .. Norway 713 1,540 827 116 Poland 60 222 162 n.s. Romania 116 1,016 900 776 Slovakia 4 33 29 n.s. Slovenia 10 39 29 n.s. Spain 56,359 98,975 42,616 76 Sweden 2,514 2,974 460 18 Switzerland 100,975 169,458 68,483 68 United Kingdom 36,556 92,065 55,509 152
Note [n.s.] not significant; low reliability of data on Poland for 2010.
Map 1.1 Stock of Portuguese-born emigrants in EU and EFTA countries, 2010/11
Source Map by OEm, data from Eurostat, based on member states census data, 2010/2011.
Chart 1.5 Major changes in the stock of Portuguese-born emigrants in EU and EFTA
countries, 2000/2001 to 2010/11
Note Low reliability of data on France for 2011. Missing data for Belgium, Germany and the Netherlands. Source Chart by OEm, data from Eurostat, based on member states census data, 2000-2001 and 2010/2011.
0 10.000 20.000 30.000 40.000 50.000 60.000 70.000 80.000 Switzerland United Kingdom Spain France Luxembourg
Table 1.8 Stock of Portuguese-born emigrants in OECD countries by age group and educational attainment, 2000/2001 and 2010/11
Indicator 2001 2011 Thousands % Thousands % Total 1,260 100.0 1,436 100.0 Age group 15-24 82 6.5 77 5.4 25-64 1,058 84.0 1,154 80.4 65+ 120 9.5 205 14.3 Educational attainment Low 847 69.4 876 62.1 Medium 295 23.4 384 26.8 High 78 6.2 151 10.5 Unknown 40 .. 24 ..
Note Data for ages groups in 2010/2011 includes partial estimations for Germany and Switzerland.
Source Table by OEm, data from OECD, Database on Immigrants in OECD Countries, DIOC 2000-2001 and DIOC 2010-2011 (Rev 3 File C).
Chart 1.6 Stock of Portuguese-born emigrants in OECD countries by age group and
educational attainment, 2000/2001 and 2010/11
Source Chart by OEm, data from OECD, Database on Immigrants in OECD Countries, DIOC 2000-2001 and DIOC 2010-2011. 0% 20% 40% 60% 80% 100% 2001 2011 Age group 65+ 25-64 15-24 0% 20% 40% 60% 80% 100% 2001 2011 Educational attainment High Medium Low
International comparison
Table 1.9 Net migration in EU and EFTA countries, 2013
Country population Resident
All flows Except return flows (a) N Rate N Rate Austria 8,506,889 47,795 0.56 77,261 0.91 Belgium 11,203,992 27,456 0.25 72,657 0.65 Bulgaria 7,245,677 -1,108 -0.02 -2,148 -0.03 Croatia 4,246,809 -4,884 -0.12 -8,101 -0.19 Cyprus 858,000 -12,078 -1.41 8,036 0.94 Czech Republic 10,512,419 4,230 0.04 15,531 0.15 Denmark 5,627,235 17,002 0.30 27,770 0.49 Estonia 1,315,819 -2,631 -0.20 -4,777 -0.36 Finland 5,451,270 18,048 0.33 14,215 0.26 France 65,835,579 31,880 0.05 62,630 0.10 Germany 80,767,463 433,385 0.54 505,239 0.63 Greece 10,926,807 -59,148 -0.54 -30,787 -0.28 Hungary 9,877,365 4,277 0.04 -330 0.00 Iceland 325,671 2,034 0.62 796 0.24 Ireland 4,605,501 -24,497 -0.53 9,298 0.20 Italy 60,782,668 181,719 0.30 196,926 0.32 Latvia 2,001,468 -14,262 -0.71 -15,625 -0.78 Liechtenstein 37,129 199 0.54 295 0.79 Lithuania 2,943,472 -16,807 -0.57 -32,456 -1.10 Luxembourg 549,680 10,348 1.88 17,980 3.27 Malta 425,384 3,224 0.76 5,271 1.24 Netherlands 16,829,289 16,803 0.10 36,019 0.21 Norway 5,107,970 41,790 0.82 52,595 1.03 Poland 38,017,856 -56,135 -0.15 -138,089 -0.36 Portugal 10,427,301 -36,232 -0.35 -45,437 -0.44 Romania 19,947,311 -8,109 -0.04 -139,651 -0.70 Slovakia 5,415,949 2,379 0.04 -257 0.00 Slovenia 2,061,085 487 0.02 3,832 0.19 Spain 46,512,199 -251,531 -0.54 175,021 0.38 Sweden 9,644,864 65,130 0.68 69,249 0.72 Switzerland 8,139,631 53,961 0.66 105,614 1.30 United Kingdom 64,308,261 209,112 0.33 316,334 0.49
Note (a) Only outflows of nationals and inflows of foreigners.
Chart 1.7 Net migration rates in EU and EFTA countries, except return flows, 2013
Note Except return flows: only outflows of nationals and inflows of foreigners. Source Chart by OEm, data from Eurostat, database on population and social conditions.
-1,20 -0,70 -0,20 0,30 0,80 1,30 1,80 2,30 2,80 3,30 Luxembourg Switzerland Malta Norway Cyprus Austria Liechtenstein Sweden Belgium Germany Denmark United Kingdom Spain Italy Finland Iceland Netherlands Ireland Slovenia Czech Republic France Hungary Slovakia Bulgaria Croatia Greece Estonia Poland Portugal Romania Latvia Lithuania Percentage
Table 1.10 Emigrants by country of origin, 2010
Ranking Top countries of origin Emigrants, millions
1 Mexico 11.9 2 India 11.4 3 Russian Federation 11.1 4 China 8.3 5 Ukraine 6.6 6 Bangladesh 5.4 7 Pakistan 4.7 8 United Kingdom 4.7 9 Philippines 4.3 10 Turkey 4.3
11 Egypt, Arab Rep. 3.7
12 Kazakhstan 3.7 13 Germany 3.5 14 Italy 3.5 15 Poland 3.1 16 Morocco 3.0 17 State of Palestine 3.0 18 Romania 2.8 19 Indonesia 2.5 20 United States 2.4 21 Afghanistan 2.3 22 Portugal 2.2 23 Vietnam 2.2 24 Colombia 2.1 25 Korea, Republic of 2.1 26 Uzbekistan 2.0 27 Sri Lanka 1.8 28 Belarus 1.8 29 France 1.7 30 Puerto Rico 1.7
Chart 1.8 Emigrants by country of origin, 2010
Source Chart by OEm, data from the World Bank, Migration and Remittances Factbook 2011, second edition.
0,0 2,0 4,0 6,0 8,0 10,0 12,0 Mexico India Russian Federation China Ukraine Bangladesh Pakistan United Kingdom Philippines Turkey Egypt, Arab Rep. Kazakhstan Germany Italy Poland Morocco State of Palestine Romania Indonesia United States Afghanistan Portugal Vietnam Colombia Korea, Republic of Uzbekistan Sri Lanka Belarus France Puerto Rico Emigrants, millions
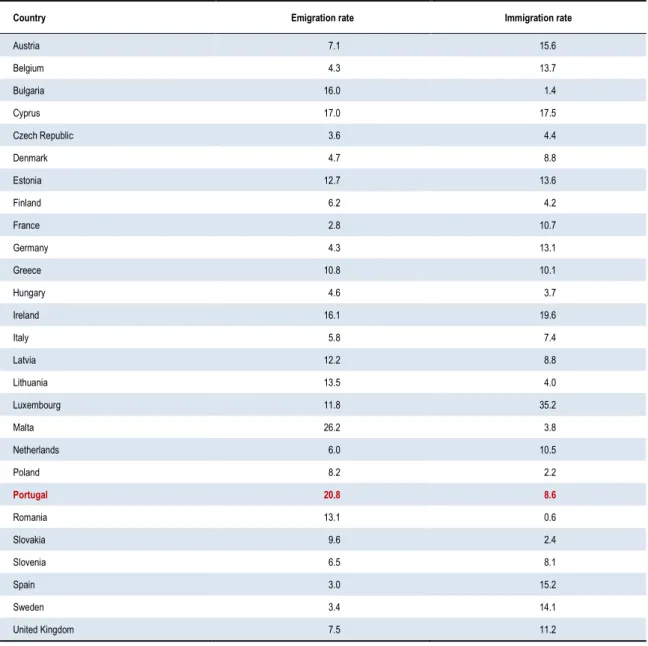
Table 1.11 Emigration and immigration rates in EU countries, 2010
Country Emigration rate Immigration rate
Austria 7.1 15.6 Belgium 4.3 13.7 Bulgaria 16.0 1.4 Cyprus 17.0 17.5 Czech Republic 3.6 4.4 Denmark 4.7 8.8 Estonia 12.7 13.6 Finland 6.2 4.2 France 2.8 10.7 Germany 4.3 13.1 Greece 10.8 10.1 Hungary 4.6 3.7 Ireland 16.1 19.6 Italy 5.8 7.4 Latvia 12.2 8.8 Lithuania 13.5 4.0 Luxembourg 11.8 35.2 Malta 26.2 3.8 Netherlands 6.0 10.5 Poland 8.2 2.2 Portugal 20.8 8.6 Romania 13.1 0.6 Slovakia 9.6 2.4 Slovenia 6.5 8.1 Spain 3.0 15.2 Sweden 3.4 14.1 United Kingdom 7.5 11.2
Chart 1.9 Emigration and immigration rates in EU countries, 2010
Note Only countries with more than one million inhabitants.
Source Chart by OEm, data from the World Bank, Migration and Remittances Factbook 2011, second edition. Austria Belgium Bulgaria Czech Republic Denmark Estonia Finland France Germany Greece Hungary Ireland Italy Latvia Lithuania Netherlands Poland Portugal Romania Slovakia Slovenia Spain Sweden United Kingdom 0 5 10 15 20 25 0 5 10 15 20 25 Im m igr ation r ate in pe rc enta ge
2 | Emigration to top destination
countries
Summary
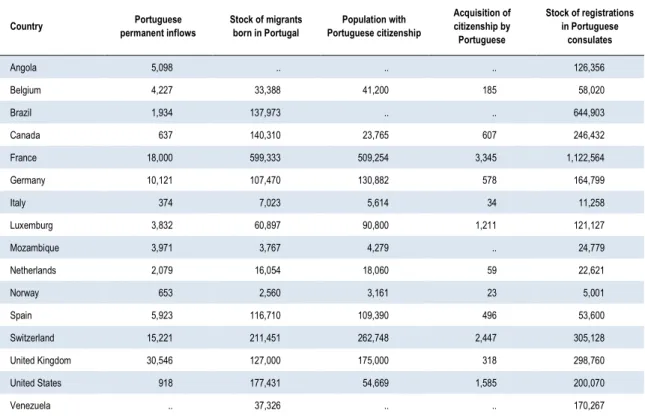
Table 2.1 Main indicators of Portuguese emigration to top destination countries, 2014
or last year available
Country permanent inflows Portuguese Stock of migrants born in Portugal Portuguese citizenship Population with
Acquisition of citizenship by Portuguese Stock of registrations in Portuguese consulates Angola 5,098 .. .. .. 126,356 Belgium 4,227 33,388 41,200 185 58,020 Brazil 1,934 137,973 .. .. 644,903 Canada 637 140,310 23,765 607 246,432 France 18,000 599,333 509,254 3,345 1,122,564 Germany 10,121 107,470 130,882 578 164,799 Italy 374 7,023 5,614 34 11,258 Luxemburg 3,832 60,897 90,800 1,211 121,127 Mozambique 3,971 3,767 4,279 .. 24,779 Netherlands 2,079 16,054 18,060 59 22,621 Norway 653 2,560 3,161 23 5,001 Spain 5,923 116,710 109,390 496 53,600 Switzerland 15,221 211,451 262,748 2,447 305,128 United Kingdom 30,546 127,000 175,000 318 298,760 United States 918 177,431 54,669 1,585 200,070 Venezuela .. 37,326 .. .. 170,267
Note [AGO] Permanente inflows: data from visas concerning permanent emigration. [BEL] Permanent inflows: 2012. Acquisition of citizenship by Portuguese: 2013. [BRA] Migrants born in Portugal: 2010. [CAN] Migrants born in Portugal and population with Portuguese citizenship: 2011. Acquisition of citizenship by Portuguese and registrations in Portuguese consulates: 2012. [FRA] Permanent inflows: 2012. Migrants born in Portugal: 2012. Population with Portuguese citizenship: 2011. [ITA] Permanent inflows: 2013. Migrants born in Portugal: 2012. Acquisition of citizenship by Portuguese: 2013. [LUX] Migrants born in Portugal: 2011. [MOZ] Migrants born in Portugal and population with Portuguese citizenship: 2007. [NLD] Permanent inflows: 2013. [CHE] Migrants born in Portugal: 2013. [USA] Permanent inflows: 2013. Population with Portuguese citizenship: 2012. Acquisition of citizenship by Portuguese: 2013. [VEN] Migrants born in Portugal: 2011.
Source Table by OEm, source data detailed in following pages. Entities: Consulado-Geral da República de Angola em Lisboa and Consulado-Geral da República de Angola no Porto, Portugal; Direção-Geral dos Assuntos Consulares e das Comunidades Portuguesas, Portugal (DGACCP); OCDE; Eurostat; Ministério do Trabalho e Emprego, Brazil; IMILA, Investigación Migración Internacional de Latinoamérica; Instituto Brasileiro de Geografia e Estatística; Citizenship and Immigration Canada; Institut Nacional de la Statistique et des Études Économiques, France; Ministère de L’intérieure, France; Instituto Nacional de Estatística, Mozambique; Statistisches Bundesamt Deutschland; Istituto Nazionale di Statistica, Italia; Le Portail des Statistiques du
Luxembourg; Ministère de la Justice, Luxembourg; Centraal Bureau voor de Statistiek, Netherlands; Statistics Norway; INE España; Observatorio Permanente de la Immigración, España; Office Fédéral de la Statistique, Switzerland; Department for Work and Pensions, UK; UK Office for National Statistics, Annual Population Survey (APS) /Labour Force Survey (LFS); Government UK, Home Office; US Department of Homeland Security; Instituto Nacional de Estadística, Venezuela.
Map 2.1 Portuguese permanent inflows in top destination countries, 2014 or last year available
Note [AGO] Data from visas concerning permanent emigration. [BEL] 2012. [FRA] 2012. [ITA] 2013.
Source Map by OEm, data from: [AGO] Consulates of Angola in Portugal (Lisbon and Oporto); [BEL] Eurostat, Statistics Database, Population and Social Conditions; [BRA] Ministério do Trabalho e Emprego; [CAN] Citizenship and Immigration Canada;
[DEU] Statistisches Bundesamt Deutschland; [FRA] Institut Nacional de la Statistique et des Études Économiques; [ITA] Eurostat, Statistics Database, Population and Social Conditions; [LUX] Le Portail des Statistiques du Luxembourg; [MOZ] Direção Geral dos Assuntos Consulares e Comunidades Portuguesas based on data from Mozambique Ministry of Labor; [NLD] Centraal Bureau voor de Statistiek; [NOR] Statistics Norway; [ESP] Instituto Nacional de Estadística; [CHE] Office Fédéral de la Statistique; [GBR] Department for Work and Pensions; [USA] US Department of Homeland Security.
Map 2.2 Stock of migrants born in Portugal in top destination countries, 2014 or last year available
Note [BRA] 2010. [CAN] 2011. [FRA] 2011. [LUX] 2011. [MOZ] 2007. [VEN] 2011.
Source Map by OEm, data from: [BEL] Eurostat, Statistics Database, Population and Social Conditions; [BRA] Instituto Brasileiro de Geografia e Estatística, Censos 2010; [CAN] Statistics Canada; [FRA] Institut Nacional de la Statistique et des Études
Économiques; [DEU] Statistisches Bundesamt Deutschland; [LUX] Le Portail des Statistiques du Luxembourg; [MOZ] Instituto Nacional de Estatística; [NLD] Centraal Bureau voor de Statistiek; [NOR] Statistics Norway; [ESP] Instituto Nacional de Estadística; [CHE] Office Fédéral de la Statistique; [GBR] UK National Statistics; [USA] US Census Bureau, Current Population Survey; [VEN] Instituto Nacional de Estadística, Censos de Población e Vivienda.
Inflows
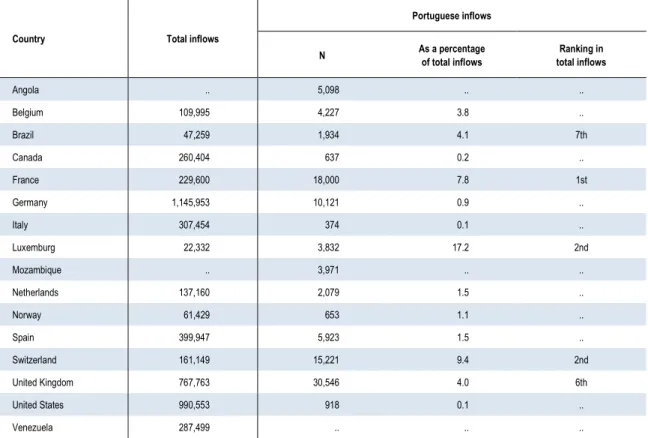
Table 2.2 Portuguese permanent inflows in top destination countries, 2014 or last year
available
Country Total inflows
Portuguese inflows N As a percentage of total inflows Ranking in total inflows Angola .. 5,098 .. .. Belgium 109,995 4,227 3.8 .. Brazil 47,259 1,934 4.1 7th Canada 260,404 637 0.2 .. France 229,600 18,000 7.8 1st Germany 1,145,953 10,121 0.9 .. Italy 307,454 374 0.1 .. Luxemburg 22,332 3,832 17.2 2nd Mozambique .. 3,971 .. .. Netherlands 137,160 2,079 1.5 .. Norway 61,429 653 1.1 .. Spain 399,947 5,923 1.5 .. Switzerland 161,149 15,221 9.4 2nd United Kingdom 767,763 30,546 4.0 6th United States 990,553 918 0.1 .. Venezuela 287,499 .. .. ..
Note [AGO] Data from visas concerning permanent emigration. [BEL] 2012. [FRA] 2012. [ITA] 2013. [NLD] 2013. USA [2013]. [VEN] 2011.
Source Table by OEm, data from: [AGO] Consulates of Angola in Portugal (Lisbon and Oporto); [BEL] Eurostat, Statistics Database, Population and Social Conditions; [BRA] Ministério do Trabalho e Emprego; [CAN] Citizenship and Immigration Canada; [DEU] Statistisches Bundesamt Deutschland; [FRA] Institut Nacional de la Statistique et des Études Économiques; [ITA] Eurostat, Statistics Database, Population and Social Conditions; [LUX] Le Portail des Statistiques du Luxembourg; [MOZ] Direção Geral dos Assuntos Consulares e Comunidades Portuguesas (DGACCP) based on data from Mozambique Ministry of Labor; [NLD] Centraal Bureau voor de Statistiek; [NOR] Statistics Norway; [ESP] Instituto Nacional de Estadística; [CHE] Office Fédéral de la Statistique; [GBR] Department for Work and Pensions; [USA] US Department of Homeland Security; [VEN] Instituto Nacional de Estadística.
Chart 2.1 Portuguese permanent inflows in top destination countries, 2014 or last year available
Note [AGO] Data from visas concerning permanent emigration. [BEL] 2012. [FRA] 2012. [ITA] 2013. [NLD] 2013. USA [2013]. Source Chart by OEm, data from: [AGO] Consulates of Angola in Portugal (Lisbon and Oporto); [BEL] Eurostat, Statistics Database, Population and Social Conditions; [BRA] Ministério do Trabalho e Emprego; [CAN] Citizenship and Immigration Canada; [DEU] Statistisches Bundesamt Deutschland; [FRA] Institut Nacional de la Statistique et des Études Économiques; [ITA] Eurostat, Statistics Database, Population and Social Conditions; [LUX] Le Portail des Statistiques du Luxembourg; [MOZ] Direção Geral dos Assuntos Consulares e Comunidades Portuguesas (DGACCP) based on data from Mozambique Ministry of Labor; [NLD] Centraal Bureau voor de Statistiek; [NOR] Statistics Norway; [ESP] Instituto Nacional de Estadística; [CHE] Office Fédéral de la Statistique; [GBR] Department for Work and Pensions; [USA] US Department of Homeland Security.
0 5.000 10.000 15.000 20.000 25.000 30.000 35.000 Italy Canada Norway United States Brazil Netherlands Luxemburg Mozambique Belgium Angola Spain Germany Switzerland France United Kingdom
Chart 2.2 Portuguese permanent inflows as a percentage of all permanent inflows in top destination countries, 2014 or last year available
Note [BEL] 2012. [FRA] 2012. [ITA] 2013. [NLD] 2013. USA [2013].
Source Chart by OEm, data from: [BEL] Eurostat, Statistics Database, Population and Social Conditions; [BRA] Ministério do Trabalho e Emprego; [CAN] Citizenship and Immigration Canada; [DEU] Statistisches Bundesamt Deutschland; [FRA] Institut Nacional de la Statistique et des Études Économiques; [ITA] Eurostat, Statistics Database, Population and Social Conditions; [LUX] Le Portail des Statistiques du Luxembourg; [NLD] Centraal Bureau voor de Statistiek; [NOR] Statistics Norway; [ESP] Instituto Nacional de Estadística; [CHE] Office Fédéral de la Statistique; [GBR] Department for Work and Pensions; [USA] US Department of Homeland Security. 0,0 2,0 4,0 6,0 8,0 10,0 12,0 14,0 16,0 18,0 20,0 United States Italy Canada Germany Norway Netherlands Spain Belgium United Kingdom Brazil France Switzerland Luxemburg
Table 2.3 Change in Portuguese permanent inflows in top destination countries,
2013-2014 or last two years available
Country
Total inflows Portuguese inflows 2013 2014 Change in percentage 2013 2014 Change in percentage Angola .. .. .. 4,651 5,098 .. Belgium 117,948 109,995 -6.7 3,140 4,227 34.6 Brazil 62,387 47,259 -24.2 2,913 1,934 -33.6 Canada 259,023 260,404 0.5 630 637 1.1 France 216,640 229,600 6.0 .. 18,000 .. Germany 932,920 1,145,953 22.8 11,401 10,121 -11.2 Italy 350,772 307,454 -12.3 446 374 -16.1 Luxemburg 21,098 22,332 5.8 4,590 3,832 -16.5 Mozambique .. .. .. 3,759 3,971 5.6 Netherlands 130,698 137,160 4.9 2,051 2,079 1.4 Norway 66,934 61,429 -8.2 815 653 -19.9 Spain 342,390 399,947 16.8 5,302 5,923 11.7 Switzerland 167,248 161,149 -3.6 20,039 15,221 -24.0 United Kingdom 617,236 767,763 24.4 30,121 30,546 1.4 United States 1,031,631 990,553 -4.0 811 918 13.2 Venezuela .. .. .. .. .. ..
Note [AGO] Data from visas concerning permanent emigration. [BEL] 2011 and 2012. [FRA] 2011 and 2012. [ITA] 2012 and 2013. [NLD] 2012 and 2013. [USA] 2012 and 2013.
Source Table by OEm, data from: [AGO] Consulates of Angola in Portugal (Lisbon and Oporto); [BEL] Eurostat, Statistics Database, Population and Social Conditions; [BRA] Ministério do Trabalho e Emprego; [CAN] Citizenship and Immigration Canada; [FRA] Institut National Etudes Démographiques; [DEU] Statistisches Bundesamt Deutschland; [ITA] Eurostat, Statistics Database, Population and Social Conditions; [LUX] Le Portail des Statistiques du Luxembourg; [MOZ] Direção Geral dos Assuntos Consulares e Comunidades Portuguesas (DGACCP), based on data from Mozambique Ministry of Labor; [NLD] Centraal Bureau voor de Statistiek; [NOR] Statistics Norway; [ESP] Instituto Nacional de Estadística; [CHE] Office Fédéral de la Statistique; [GBR] Department for Work and Pensions; [USA] US Department of Homeland Security.
Stocks
Table 2.4 Stock of migrants born in Portugal in top destination countries, 2014 or last year
available
Country Total population
All foreign-born migrants Migrants born in Portugal N As a percentage of total population N As a percentage of total population As a percentage of all foreign-born Ranking in foreign-born population Angola .. .. .. .. .. .. .. Belgium 11,150,516 1,773,148 15.9 33,388 0.3 1.9 .. Brazil 190,755,799 592,570 0.3 137,973 0.1 23.3 1st Canada 32,852,325 7,217,295 22.0 140,310 0.4 1.9 .. France 65,241,240 5,714,045 8.8 599,333 0.9 10.5 3rd Germany 80,925,031 6,920,193 8.6 107,470 0.1 1.6 .. Italy 59,685,227 4,387,721 7.4 7,023 0.0 0.2 .. Luxemburg 512,400 205,162 40.0 60,897 11.9 29.7 1st Mozambique 20,252,223 342,117 1.7 3,767 0.0 1.1 .. Netherlands 16,829,289 1,818,497 10.8 16,054 0.1 0.9 .. Norway 5,109,056 759,185 14.9 2,560 0.1 0.3 .. Spain 46,771,341 6,283,712 13.4 116,710 0.2 1.9 .. Switzerland 8,237,666 2,289,560 27.8 211,451 2.6 9.2 2nd United Kingdom 63,686,000 8,277,000 13.0 127,000 0.2 1.5 .. United States 313,094,549 44,708,963 14.3 177,431 0.1 0.4 .. Venezuela 27,150,095 1,156,578 4.3 37,326 0.1 3.2 ..
Note [BRA] 2010. [CAN] 2011. [FRA] 2012. [ITA] 2012. [LUX] 2011. [MOZ] 2007. [CHE] 2013. [VEN] 2011.
Source Table by OEm, data from: [BEL] Eurostat, Statistics Database, Population and Social Conditions; [BRA] Instituto Brasileiro de Geografia e Estatística, Censos 2010; [CAN] Statistics Canada; [FRA] Institut Nacional de la Statistique et des Études
Économiques; [DEU] Statistisches Bundesamt Deutschland; [ITA] OECD, International Migration Database; [LUX] Le Portail des Statistiques du Luxembourg; [MOZ] Instituto Nacional de Estatística; [NLD] Centraal Bureau voor de Statistiek; [NOR] Statistics Norway; [ESP] Instituto Nacional de Estadística; [CHE] Office Fédéral de la Statistique; [GBR] UK National Statistics; [USA] US Census Bureau, Current Population Survey; [VEN] Instituto Nacional de Estadística, Censos de Población e Vivienda.