BUBBLE DETECTION AND CONTAGION: AN ANALYSIS BY
SEGMENTS OF THE U.S. STOCK, REAL ESTATE, AND CREDIT
MARKETS
Daniel Valente dos Santos
Dissertation
Master in Economics
Supervised by
Manuel Duarte da Silva Rocha Sujiao Zhao
i
Acknowledgements
My first words of gratitude must go to my supervisors, Professor Manuel Duarte Rocha and Professor Sujiao Zhao, for the continuous guidance and encouragement throughout this journey of constant learning and personal development. Their endless patience, immense knowledge, valuable help, and availability were crucial tools to fulfil the objectives of this dissertation. Thank you for always light up the way forward.
I also would like to thank my mother, Maria, and my father, José, for their tremendous effort to provide me all the conditions to follow my dreams. I am eternally grateful for their support and kind advices.
To Daniela, for her love.
ii
Abstract
Excessive credit growth and asset price bubbles are among the origins of several banking crises. The recent global financial crisis is a remarkable example of how exuberance in financial markets can cause severe costs to economic activity. Therefore, it is of utmost importance to inspect whether bubbles in a specific market may transmit to other markets and threaten financial stability.
The present work proposes to detect bubbles and their contagion effects between the U.S. stock, real estate, and credit markets over 1980-2019. Particularly, the stock market is divided into non-financial and bank stocks; the real estate market is split into residential and commercial properties; and finally, the credit market is segmented into credit to households and credit to non-financial corporations. The segmented analysis of each market sheds light on the mechanisms through which bubbles spread across markets. Therefore, the methodology proposed by Phillips, Shi, and Yu (2015) is applied to detect and date-stamp bubble periods. Furthermore, the present study tests for bubble contagion with the method proposed by Greenaway-McGrevy and Phillips (2016), which estimates the sensitivity of a market to exuberance in another.
The main findings indicate that the housing market, credit to households, and credit to non-financial corporations experienced more quarters in which bubbles were detected than the others, though bubbles in the latter last for shorter periods. The results of the contagion analysis provide evidence of bubble contagion from the housing market to all the others. Additionally, housing bubbles may transmit to the stock market through the credit market, which points to this market being a fundamental driver of bubble contagion. Finally, there are two current ongoing bubbles in which contagion is found. The results highlight the need to develop macroprudential policies to prevent the emergence of multiple bubbles that could damage the financial system.
JEL codes
: G01; G12; G21; R31Keywords
: Financial Bubbles; Bubble Contagion; Stock Market; Real Estate Market; Credit Marketiii
Resumo
O crescimento excessivo do crédito e bolhas nos preços dos ativos estão na base da maioria das crises bancárias. A recente crise financeira global é um exemplo notório de como exuberância nos mercados financeiros podem causar graves perdas para a atividade económica. Assim, é de grande importância investigar se bolhas num determinado mercado se podem transmitir para outros mercados e ameaçar a estabilidade financeira.
Neste sentido, esta dissertação procura detetar bolhas e os seus efeitos de contágio entre os mercados acionista, imobiliário e do crédito nos Estados Unidos entre 1980 e 2019. Particularmente, o mercado acionista é dividido em empresas não financeiras e bancos; o imobiliário em propriedades residenciais e comerciais; e, finalmente, o do crédito em crédito às famílias e crédito às empresas não financeiras. Esta análise segmentada contribui, assim, para a explicação dos mecanismos através dos quais uma determinada bolha pode contagiar outros mercados. Para tal, é usada a metodologia proposta por Phillips, Shi e Yu (2015), que permite identificar períodos de bolhas e, para testar a presença de contágio, é utilizada a proposta de Greenaway-Mcgrevy e Phillips (2016), que permite estimar a sensibilidade de um mercado à exuberância noutro.
As principais conclusões indicam que foram detetadas bolhas em bastante mais trimestres nos mercados residencial e do crédito, embora no crédito às empresas não financeiras estas têm uma menor duração. Relativamente ao contágio, os resultados comprovam a existência de transmissão de bolhas do mercado residencial para todos os outros mercados em análise. Ademais, estas transmitem-se para o mercado acionista, sobretudo, através do crédito, o que evidencia o seu papel fundamental como transmissor de bolhas. Adicionalmente, existem atualmente duas bolhas financeiras em curso. Assim, os resultados enfatizam a necessidade de desenvolver políticas macroprudenciais para prevenir o aparecimento de múltiplas bolhas que podem fazer colapsar o sistema financeiro.
Códigos JEL
: G01; G12; G21; R31Palavras-chave
: Bolhas Financeiras; Contágio de Bolhas; Mercado Acionista; Mercado Imobiliário; Mercado do Créditoiv
Table of Contents
1 Introduction ... 1
2 Bubbles, Contagion, and Financial Stability: A Literature Review ... 4
2.1 The Prominent Role of Bubbles in Historical Episodes of Financial Crises... 4
2.2 Rational and Irrational Bubbles: A Theoretical Approach ... 6
2.3 How to Detect Bubbles ... 10
2.3.1 Empirical Methods for Bubble Detection ... 10
2.3.2 Putting Prices vis-à-vis Fundamentals ... 13
2.3.2.1 Stock Market ... 13
2.3.2.2 Real Estate Market ... 15
2.3.2.3 Credit Market ... 18
2.4 Exploring the Nexus Between Credit, Real Estate, and Stock Markets ... 19
2.4.1 Credit and Real Estate ... 20
2.4.2 Credit and Stock ... 21
2.4.3 Stock and Real Estate ... 22
2.4.4 The Central Role of Banks and Conditions for Credit Booms ... 24
2.5 Bubble Contagion: Methods and Empirical Evidence ... 25
3 Empirical Analysis: Bubble Detection and Contagion ... 29
3.1 Methodology ... 29
3.1.1 Bubble Detection ... 29
3.1.2 Bubble Contagion ... 32
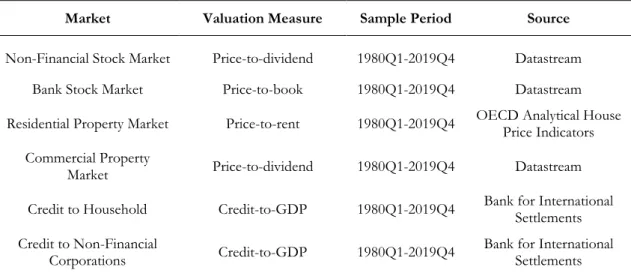
3.2 Data ... 34
3.3 Empirical Results: Testing for exuberance and contagion ... 36
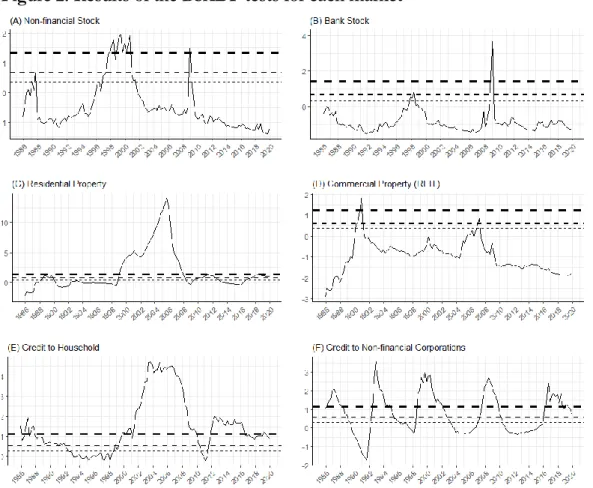
3.3.1 Bubble Detection and Date-Stamping ... 37
3.3.2 Bubble Contagion: From Core to Receptor ... 40
3.3.3 Additional Analysis: Exploring Other Contagion Movements ... 45
4 Concluding Remarks... 49
5 Appendix ... 51
v
List of Tables
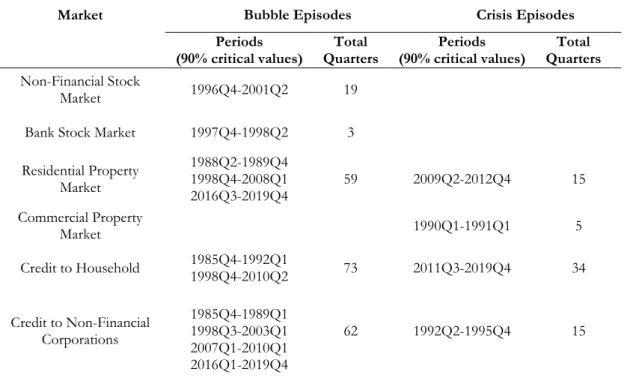
Table 1. Summary of the data ... 35 Table 2. Bubble and crisis periods ... 38
vi
List of Figures
Figure 1. Price-to-fundamental ratios by market (in logarithms) ... 36
Figure 2. Results of the BSADF tests for each market ... 37
Figure 3. Bubble contagion from residential property market ... 42
Figure 4. Bubble contagion from household credit market ... 45
Figure 5. Bubble contagion to non-financial stock market ... 46
Figure 6. Bubble contagion to bank stock market ... 47
Figure 7. Bubble contagion to residential property market ... 48
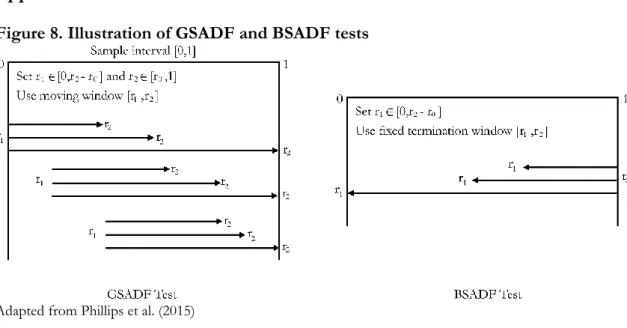
Figure 8. Illustration of GSADF and BSADF tests ... 51
Figure 9. Bank stock price, dividends, and earnings ... 52
1
1 Introduction
The recent global financial crisis has highlighted the importance of being alert to the build-up of vulnerabilities in the financial markets by capturing warning signals that allow policymakers to prevent a financial collapse. Therefore, several institutions worldwide are interested in monitoring the evolution of variables that can predict a forthcoming turmoil to react in due time and mitigate the devastating impacts of a financial crisis.
In this respect, many authors have concluded that excessive credit growth and asset price bubbles are the main causes of banking crises (Alessi & Detken, 2018; Anundsen, Gerdrup, Hansen, & Kragh-Sørensen, 2016; Kauko, 2014; Virtanen, Tölö, Virén, & Taipalus, 2018). Thus, policymakers should monitor asset price bubbles fuelled by loan growth, often called “leveraged bubbles” (Jordà, Schularick, & Taylor, 2015), and so they should be worried about whether an explosive behaviour would be symptomatic of future imbalances.
In this context, it is of utmost importance to inspect whether bubbles in a specific market may transmit to other assets and create a harmful environment in the financial system. This is particularly relevant since the literature identified several mechanisms through which financial markets are interconnected, both in a cross-asset perspective and in a cross-border sense, as will be clarified in the literature review (chapter 2). Also, historical episodes of explosiveness encourage to explore the emergence of multiple bubbles in financial markets, and, in particular, stock, real estate, and credit markets as they experience bubble periods recurrently, as will be addressed in the following chapter. For instance, the recent global financial crisis has strengthened the relevance of understanding how housing exuberance and credit booms may reinforce each other and precipitate the collapse of the financial system. The above-mentioned framework motivates the analysis of the present work. As asset price bubbles and credit booms increase the likelihood of financial crises, the present work proposes to detect bubbles and their contagion effects among the U.S. stock, real estate, and credit markets. In particular, an analysis of segments of each market is proposed to shed light on the transmission effects across them. More precisely, the present work inspects through which segments bubbles spread between the three markets referred to above. To this end, the stock market is divided into non-financial and bank stocks; the real estate market is split into residential and commercial properties; and finally, the credit market is segmented into credit to households and non-profit institutions serving households (hereafter referred to just as credit to households) and credit to non-financial corporations. The analysis of bubble
2 detection and contagion in these markets taking different segments allows for a deeper understanding of what underlies their behaviour as well as the contagion between them. In this manner, the present work proposes to answer two main questions. First, do some segments of the stock, real estate, and credit markets experience more bubbles than others? Second, do bubbles transmit between them? This analysis contributes to understand bubble behaviour of key markets and bubble contagion between them (all at the level of segments). And the importance of this knowledge directly derives from the importance of these markets for financial stability.
In the present work, data refer to U.S. markets for three reasons. First, testing for bubble detection and contagion in different countries may induce wrong conclusions. The financial system of each country has its own characteristics, hence, to present robust results one should select countries with similar features and consider control variables to avoid these biases (Hackethal, 2000). Data availability is so a constraint. Second, U.S. financial markets play a central role in global markets (e.g. Ehrmann, Fratzscher, & Rigobon, 2011). Therefore, U.S. markets are deemed sufficiently representative for analysing bubble contagion effects, as the U.S. has one of the most developed financial systems. Third, the recent experience evidences the importance of monitoring asset price bubbles that emerge in U.S. markets as it sowed the seeds of the Great Recession.
To address the questions above, the present work applies the methodology proposed by Phillips et al. (2015) (hereafter referred to as PSY) that allows detecting and date-stamping bubble periods. More specifically, this methodology proposes right-tailed unit root tests to search for explosive behaviour in the price-to-fundamentals ratio as evidence of a speculative bubble. These tests are applied to the valuation measure of each market using quarterly data over 1980-2019. This procedure allows us to identify bubble episodes and infer which markets face more bubble periods. Furthermore, the present work tests for bubble contagion to evaluate if bubbles spread across markets by applying the method proposed by Greenaway-McGrevy and Phillips (2016).
Although mostly following the Great Recession an extensive research literature on financial bubbles and their implications for financial stability has emerged, the main contribution of the present dissertation is threefold. First, the present work checks for bubble contagion in and between three different markets: stock, real estate, and credit. To the best of my knowledge, no one has explored the contagion of explosive movements between these
3 markets taken together in the same work. Although recent literature is plenty of evidence of interconnectedness between these markets, bubble contagion is still a subject little explored. The results indicate that housing bubbles are more contagious to the commercial segment and the credit to households, but also evidence of bubble contagion to the stock market and credit to non-financial corporations was found, which is particularly significant during the build-up phase of the Great Recession. Furthermore, the results suggest that housing bubbles may transmit to the stock market through the credit market, which is consistent with the view that the credit market is a fundamental driver of bubble contagion between these markets. Besides, bank stocks depend to a great extent on the performance of the remainder of the stock market and not so on the residential property prices. Second, to the best of my knowledge, there is not any other relevant work that proposed to detect bubbles considering this segmented analysis for all these crucial markets. The results highlight the relevance of this disaggregation as some segments experience more bubble periods than others. Particularly, the credit to non-financial corporations is the market where more bubbles were detected. The residential property market experienced the sharpest bubble. Conversely, bubbles in the stock market are less frequent and of lesser duration, in line with the results of Gómez-González, Ojeda-Joya, Franco, and Torres (2017). Third, the segmented analysis made possible to find out that the housing market and the credit to non-financial corporations are currently undergoing a bubble period and, moreover, evidence of bi-directional bubble contagion is found between these markets during these current ongoing bubbles. As the results showed that these markets may transmit exuberance to other markets, policymakers should be alert.
In sum, the present work contributes to the literature on empirical detection of bubbles in the stock, real estate, and credit markets, and sheds light on the linkages between these markets by analysing bubble contagion between segments of each market.
The present work is organized as follows. The following chapter presents a literature review on historical bubble episodes and how to detect market exuberance. Also, a critical review of the several contributions to the literature on the linkages between stock, real estate, and credit markets is undertaken. The empirical analysis is conducted in chapter 3. The procedures and methods applied to answer the research questions are described in subsection 3.1 and the data is detailed in subsection 3.2. Subsection 3.3 presents and discusses the econometric results. Finally, chapter 4 concludes.
4
2 Bubbles, Contagion, and Financial Stability: A Literature Review
In this chapter, a literature review is made on asset price bubbles. First, a brief historical context about bubbles in the financial markets is presented. Second, the definition and theoretical models that are on the basis of rational and irrational bubbles are discussed. Then, it will be presented not only an expositive approach about the existing literature, but mainly a critical view on bubble detection methods, how to identify asset price misalignments using price-to-fundamental ratios, the relationship between credit, real estate, and stock markets, and the methods to detect cross-market bubble contagion.2.1 The Prominent Role of Bubbles in Historical Episodes of Financial Crises
The deviation of market prices from fundamental values is not a recent phenomenon as it has been at the epicentre of many financial crises.1 The first known episode was the so-called
“tulip mania” in Holland (Scherbina & Schlusche, 2014). This bubble in tulip markets started in 1634 ignited by the widespread fascination for rare tulip bulbs. A virus infected the bulbs and caused tulips to change to colours never seen before. The rapid increase in its prices attracted speculators and the bubble reached its peak when a single bulb could be sold for an equivalent of 60.000$ today (Scherbina & Schlusche, 2014). This price explosiveness appeared after the emergence of formal future markets that allowed investors to speculate with future prices (Garber, 1989). The bubble burst in 1637 when a plague made investors realise the risk involved in these markets (De Vries, 1976). Since then, many periods of asset price exuberance have occurred, such as the South Sea and the Mississippi bubble in the early 1700s, the 1822-25 Loan bubble over the first Latin American debt crisis, the Roaring Twenties that led to the Great Depression in 1929, among many others throughout the world (Allen & Gale, 2000; Scherbina & Schlusche, 2014).2
More recently, the “dot-com” bubble emerged in the stock market and pointed out the relevance of monitoring sector-specific factors. During the period 1998-2000, internet stock prices extended far beyond the stock prices of the other sectors and trading volume of tech stocks reached 20% of the whole stock market (Ofek & Richardson, 2003). However, the great majority of these companies was deeply overvalued since they did not have any tangible
1 A commonly used definition of asset price bubbles (Blanchard & Watson, 1982).
2 An example of a bubble episode on the Asian continent was the explosive behaviour of both stock and real estate prices in Japan, in the 1980s.
5 asset in their balance sheets (Scherbina & Schlusche, 2014).3 In August 2002, the index
declined to values close to the starting point of the bubble (Scherbina & Schlusche, 2014). Bubble episodes that occur in a specific sector were the result of over-exuberance motivated by business prospects of disruptive innovation, as Zeira (1999) argued. In his model, stock market booms are triggered by informational overshooting when a new technology is introduced in the production process. The market boom remains as long as there is no evidence of its limitations. However, when the limit is reached, agents realise that future growth is no longer possible and prices start to collapse (Anderson, Brooks, & Katsaris, 2010).
The recent global financial crisis has shown how exuberance in financial markets can cause severe costs to economic activity. Output losses, unemployment, bankruptcies, government interventions to avoid bank runs are a few examples of “how costly” this crisis episode was (Claessens, Ayhan Kose, & Terrones, 2010). According to Claessens, Dell'Ariccia, Igan, and Laeven (2010), this period was triggered by the combination of factors that are common to past financial crises and new disruptive conditions.
So, “how similar?”. The Great Recession had its roots in a speculative behaviour that led to asset price booms. More specifically, a real estate bubble emerged in the U.S. market and reached a peak of six quarters before the beginning of the crisis (Claessens, Ayhan Kose, et al., 2010). This explosive behaviour in the housing market is remarkably similar to past financial crises, such as the so-called “Big Five” banking crises that happened in advanced countries after the Second World War (Claessens, Ayhan Kose, et al., 2010).4 Claessens,
Ayhan Kose, et al. (2010) also claimed that most economies that have experienced bubble-like behaviour in the housing market were the most affected when they were hit by the contagion effects (e.g. United Kingdom, Spain, Iceland, and many East European countries). Credit booms are also among the origins of many financial crises and the Great Recession is no exception. The rapid credit growth caused excessive household leverage and put the financial system in danger as financial innovation and low interest rates led banks to search for profitable investments and ease credit conditions. Hence, the credit became vulnerable to subprime loans (Claessens, Dell'Ariccia, et al., 2010). Additionally, as in other financial
3 Mainly, internet firms only needed a powerful name ended in “.com” to capture the interest of investors during the “dot-com” bubble period.
6 crises, this episode was also a consequence of a lack of regulation and supervision (Claessens, Ayhan Kose, et al., 2010).
However, “how different” was this crisis? Claessens, Ayhan Kose, et al. (2010) referred to new complex financial instruments with increasing opaqueness (securitisation process), financial integration and interconnectedness, the prominent role of the households, and the excessive leverage of financial institutions and debtors as new dimensions of this financial crisis. In addition, Taylor (2009) emphasized the role of loose monetary policy in the build-up of many vulnerabilities.
2.2 Rational and Irrational Bubbles: A Theoretical Approach
A bubble may be defined as the difference between the market price and the asset's fundamental value (Blanchard & Watson, 1982). It arises when investors buy or hold an overvalued asset because they expect to resell it at a higher price in the future (Brunnermeier, 2017). Therefore, the gap between the price and the value justified by fundamentals can persist over time in a context of rational agents, since they expect potential gains from the increasing gap (Blanchard & Watson, 1982; Diba & Grossman, 1988b).
Rational bubbles occur in a context in which all agents have rational expectations for future earnings and markets are assumed to be predominantly efficient (Wöckl, 2019). In theoretical literature, many seminal papers attempted to explain asset price bubbles in a context of rationality. Just to name a few, Blanchard and Watson (1982), Tirole (1982), Diba and Grossman (1988b), Froot and Obstfeld (1991), and Craine (1993) are among the most cited articles regarding rational bubble models.
Following Scherbina and Schlusche (2014) and Wöckl (2019), rational bubbles may be divided into four categories. First, there is an important distinction based on whether investors are symmetrically or asymmetrically informed. Furthermore, intrinsic bubbles, developed by Froot and Obstfeld (1991), are another specific category of rational bubble models. Finally, agency-based models assume that there are several perverse incentives that rational economic agents need to deal with.
Under specific assumptions, rational bubbles may occur when all agents share the same information. In this case, investors will only hold the overvalued asset if it expands infinitely (Brunnermeier, 2017). Finite lived assets, at the end of the asset’s life, T, will be liquidated at its fundamental value. Therefore, since all investors know that the bubble must burst at T,
7 no one is willing to pay more than the fundamental price at T-1 and, hence, it would also burst at T-1. By the same token, a bubble cannot exist at T-2, T-3, and so on (Scherbina & Schlusche, 2014). Hence, bubbles will only survive in infinite lived assets.
In turn, rational bubbles can also emerge under asymmetric information (Brunnermeier, 2017). Although investors know that the asset may be overvalued, they believe that it is not widely known, allowing finite bubbles to exist (Scherbina & Schlusche, 2014). Therefore, an investor holds an overvalued asset as he expects to sell it at a higher price to a fool investor, as a result of asymmetric information on what an investor himself knows about the price and what he thinks the others know (Brunnermeier, 2017).
Froot and Obstfeld (1991) constructed a model in which the bubble component is not a function of time. The bubble component of the asset price is a deterministic function of the fundamentals which led the authors to call it “intrinsic bubbles”. This model assumes that asset prices overreact in response to changes in market fundamentals. Conversely, agency-based models propose that bubbles arise in a context of perverse incentives that many economic agents need to deal with (Scherbina & Schlusche, 2014). Herding is an example of that since market participants follow the behaviour of others instead of making decisions based on market fundamentals, because of reputation, limited resources, and relative performance-based compensation (Wöckl, 2019). Limited liability and perverse incentives of information intermediaries are other examples of these models.5
Exploring the formal presentation of bubbles, the fundamental component of the asset price can be determined by the present value theory of finance, where it is defined as the sum of the present discount values of expected future cash flows. The fundamental value is derived from the no-arbitrage condition, where the stock price at time t (Pt) equals the expected value at t (Et) of the sum of the stock price at time t+1 and the generated cash flow at t+1 (CFt+1)
discounted to the present using a constant discount rate (r) (Diba & Grossman, 1988a):6
2.1. 𝑃𝑡 = 1
1+𝑟𝐸𝑡(𝑃𝑡+1+ 𝐶𝐹𝑡+1) .
5 Limited liability allows agents to only face limited downside losses and, on the contrary, benefit of the entire gains which incentives to ride bubbles rather than correcting it (Scherbina & Schlusche, 2014). Moreover, during a rising bubble, equity analysts, accounting auditors, rating agencies and other information intermediaries are reluctant to alert the public of it since they have incentives to profit with the mispricing. See Scherbina and Schlusche (2014) for some explanations.
6 According to Diba and Grossman (1988a), if the discount rate is time invariant, a bubble can be identified by detecting explosive characteristics in the data.
8 If we solve 2.1., the fundamental value of the asset can be written as follows:
2.2. 𝑃𝑡𝑓 = 𝐸𝑡[∑
𝐶𝐹𝑡+𝑖
(1+𝑟)𝑖
∞
𝑖=0 ] .
However, this form does not allow price to deviate from its fundamentals. If we do not impose the transversality condition
2.3. 𝑙𝑖𝑚
𝑘→∞𝐸𝑡[ 1
(1+𝑟)𝑘𝑃𝑡+𝑘] = 0
and considering a process {Bt}t=0∞ such that
2.4. 𝐸𝑡(𝐵𝑡+1) = (1 + 𝑟)𝐵𝑡 ,
prices are composed of the fundamental value and the bubble component (Bt) as follows:
2.5. 𝑃𝑡 = 𝑃𝑡𝑓+ 𝐵𝑡 .
Equation 2.4. is a crucial condition since the only way that allows the bubble component to persist over time is that this part of the price grows at rate r to compensate the investor for having bought an overvalued asset (Homm & Breitung, 2012; Zhang, 2008). In turn, r must not be greater than the growth rate of the economy to prevent the bubble exceeding the aggregate wealth in the economy (Brunnermeier, 2017).
According to Blanchard and Watson (1982), a realistic form to satisfy equation 2.4. is to consider that the bubble does not necessarily grow forever. Thus, the bubble component may continue increasing with probability π or collapse with probability 1-π:
2.6. 𝐸𝑡(𝐵𝑡+1) = { 𝜋−1(1 + 𝑟)𝐵 𝑡+ 𝜇𝑡+1 , with probability π 𝜇𝑡+1 , with probability 1-π , where {μt} t=1 ∞
is a sequence of independent and identically distributed (i.i.d) random variables with zero mean. In addition, Diba and Grossman (1988b) stated that the initial value B0
should not be zero to allow the bubble to grow.
The formulations presented in 2.4. and 2.6. take into account the explosive process that characterizes bubbles (Diba & Grossman, 1988b). In contrast, Evans (1991) argued that the approach designed by Diba and Grossman (1988b) does not allow to detect periodically collapsing bubbles, and thus he proposed a more prominent process of bubble formation (Waters, 2008). According to Evans (1991), the unit root test proposed by Diba and Grossman (1988a) does not allow to detect periodically collapsing bubbles since the
9 alternative hypothesis they suggested assumes a linear autoregressive process and Evans (1991) concluded that the bubble component follows a nonlinear behaviour.7
Nevertheless, there are other approaches to explain asset price bubbles by relaxing the assumption that all investors are completely rational. This refers to behavioural bubble models (often called irrational bubble models). These models assume that rational investors coexist with agents that are influenced by psychological biases (Wöckl, 2019).
In this context, bubbles emerge as a result of psychologically biased traders. Their irrational decisions can be explained by four behavioural models: disagreement-based models, feedback trading, biased self-attribution, and representativeness heuristic and conservatism bias (Scherbina & Schlusche, 2014; Wöckl, 2019). Although rational investors could seize the arbitrage opportunities created by irrational agents, a bubble may survive as there are some limits to eliminate them. The fact that short-sellers face additional costs and risks (both fundamental and synchronization risks8) by trading against an overvaluation lead them to
trade less than what is needed to eliminate arbitrage opportunities (Brunnermeier & Nagel, 2004; Scherbina & Schlusche, 2014).
The irrational behavioural explained by disagreement-based models assumes that traders have heterogeneous beliefs on asset valuations. Combining this with short-sale constraints, asset price bubbles can occur as a result of optimistic buyers that push prices up, while pessimist traders cannot correct the mispricing as they face short-sale constraints (Brunnermeier, 2017). Feedback trading, as the name suggests, refers to when a specific group of traders (feedback traders) buy assets in response to an initial price increase by basing their decisions on past price movements rather than what is justified by the current valuation. Hence, the price will increase and will attract additional feedback traders, amplifying the mispricing (Wöckl, 2019).
Irrational bubbles can also emerge because of biased self-attribution. In these models, there is a psychological tendency that puts more weight on facts that confirm our own expectations, discarding other relevant information that contradicts our predictions (Daniel, Hirshleifer, & Subrahmanyam, 1998). The bubble burst when the beliefs that caused the price exuberance are reversed (Wöckl, 2019). Finally, representativeness heuristic and 7 See Evans (1991) and Homm and Breitung (2012) for further details.
8 Synchronization risk is important in this context since short sellers need a common effort to trade against an overvaluation. If a short seller sells an overvalued asset, but he is not followed by other agents, this arbitrage opportunity will turn to a massive loss. See Abreu and Brunnermeier (2002) for more details.
10 conservatism bias explain bubbles by the impact of cognitive biases on the probability of an uncertain event (Wöckl, 2019). The representativeness heuristic is a psychological bias in which the probability of an uncertain event is estimated by comparing it to an existing idea that already exists in our minds (more representative) rather than what is more likely to occur. In turn, conservatism bias is the tendency to overestimate pre-existing information in comparison to new evidence (Wöckl, 2019).
2.3 How to Detect Bubbles
2.3.1 Empirical Methods for Bubble Detection
Regarding the above-mentioned formulations, many authors attempted to provide tests for bubble detection. During the 1980s and early 1990s, in-depth research arose to empirically detect rational bubbles. As Gürkaynak (2008) argued and recently followed by Frommel and Kruse (2012) and Wöckl (2019), these early econometric models can be decomposed in three types: variance bound tests, West (1987) two-step tests, and standard stationarity- and cointegration-based tests. The former aim to test whether fundamentals in itself can explain periods of high volatility in stock prices. Hence, variance bound tests are methods used the most to test the validity of the present-value model rather than searching for bubble detection. Shiller (1981) and Leroy and Porter (1981) were the first to show that stock prices are much more volatile than what is justified by fundamentals. However, the violation of the variance bound in these studies was only suggested as a critique of the present-value model (Gürkaynak, 2008). Although Blanchard and Watson (1982) and Tirole (1985) subsequently concluded that the violation of the variance bound can be attributed to bubbles, the result could also be ascribed to the failure of any assumption of the model (Wöckl, 2019).
The model constructed by West (1987) (the second type of models) tried to overcome this problem. The author proposed a method that tests the model and no-bubbles hypotheses sequentially in order to split both tests. If a bubble does not exist, the two estimates should be equal.9 Since this equality did not hold when applied to the S&P500 index from 1871 to
1980 (annual data) and the Dow Jones index during the period 1928-1987 (annual data), the null hypothesis of no bubble was rejected by West (1987).
9 The first specification only considers the stock price as a linear relationship with dividends. However, the second one allows the presence of a bubble in the data.
11 The latter type of models is based on stationarity tests between asset prices and its fundamentals. Unit root tests are often used in this context. These tests check the null hypothesis of the presence of a unit root in the time series against the alternative of stationarity.10 Campbell and Shiller (1987) applied these formulations to the S&P500 index
from 1871 to 1986 and a U.S. Treasury 20-year yield series from 1959 to 1983 and found evidence of a bubble in both datasets. On the contrary, Diba and Grossman (1988a) used a left-tailed augmented Dickey-Fuller (ADF) test and found no evidence of explosive rational bubbles in the S&P500 index during 1871-1986. The ambiguity of the conclusions and the challenges encountered, such as size distortions or the Evans’ critique (Evans, 1991) demonstrate that these methods provide unsatisfactory results (Wöckl, 2019).
More recently, there has been a renewed interest in methods for bubble detection. This growing appeal is not only due to the existent gap for further research on these topics but mostly due to the severe consequences of the recent global financial crisis which was founded on bubbles in the financial markets.
The recent methods are based on advanced stationarity- and cointegration-based tests. Unlike standard unit root tests, these advanced methodologies assume that, when a bubble emerges, mildly explosive behaviour must be observed in the data. Hence, the alternative hypothesis is located on the right side of the probability distribution of the test statistic, since these methods test for a unit root (non-stationary process) against an autoregressive process with a root greater but closer to one (Wöckl, 2019). In a nutshell, these methods assume that, if a bubble emerges in the data, asset prices must shift from a random walk to an explosive process. These tests also allow detecting periodically collapsing bubbles, overcoming the main limitations of early bubble detection tests. Recursive unit root tests, fractional integration tests, and regime-switching tests are different approaches for these recent methodologies.
Phillips, Wu, and Yu (2011) were the pioneers in proposing recursive unit root tests to test for asset price bubbles. The novelty of their method is the recursive application of right-tailed unit root tests to subgroups of the entire sample to locate periods of explosive behaviour in the price-to-fundamental data. The authors applied forward recursive regressions of the sup augmented Dickey-Fuller test to the logarithmic NASDAQ
10 The early unit root tests applied to bubble detection consider a stationary process for the alternative hypothesis which is a left-sided test regarding the probability distribution of the test statistic.
12 Composite real price and the logarithmic NASDAQ real dividend series from February 1973 to June 2005 (monthly data) and found evidence of a bubble from mid-1995 to sometime between the end of 2000 and the first quarter of 2001.
Instead of identifying the first observation as the initial condition as the previous authors, Phillips and Yu (2011) proposed to make this choice based on an information criterion and applied their method to three time series: monthly U.S. house price-to-rent ratios from January 1990 to January 2009; monthly crude oil prices during the same period; and the spread between Baa and Aaa bond rates from January 3, 2006, to July 2, 2009 (daily data). They detected a bubble period in all time series. Homm and Breitung (2012) concluded that the test proposed by Phillips et al. (2011) has a good performance as a detection mechanism for bubbles. However, they pointed out the higher finite sample power of a Chow-type Dickey-Fuller statistic and a modified version of the Busetti-Taylor test.
Phillips et al. (2011) assumed homoscedastic errors, however, time-varying volatility is a commonly accepted fact in empirical financial data. Therefore, Harvey, Leyboume, Sollis, and Taylor (2016) and Harvey, Leybourne, and Zu (2019) proposed a robust method for bubble detection in the presence of non-stationarity volatility. Hence, they constructed a weighted least squares-based variant of the Phillips et al. (2011) method. Harvey et al. (2019) applied their test to the logarithmic inflation-adjusted FTSE index from December 1985 to December 1999 and S&P500 index during the period 1980-2000, considering daily, weekly and monthly frequencies, and found evidence that their WLS-based test can outperform OLS-based approaches. Also, Astill, Harvey, Leyboume, Sollis, and Taylor (2018) reinforced the importance of building a robust model in case of time-varying volatility, and, following the methodology defined by Astill, Harvey, Leyboume, and Taylor (2017)11, detected bubble
periods in all five major stock market indices12 using monthly data from January 1995 to
January 2002.
According to Phillips et al. (2015), the methodology proposed by Phillips et al. (2011) does not perform well when there are multiple bubbles in the data. To overcome these limitations, the authors extended the model to better suit large time series in which multiple explosive and crisis periods may occur. The method is based on the generalised sup augmented
Dickey-11 The authors proposed an approach similar to Andrews and Kim (2006) along with the Dickey-Fuller t-ratio for critical value calculations.
13 Fuller test. This version proposes a flexible window width to set up the subsamples in the recursive procedure.13 The authors detected historical bubble periods by applying their
method to the monthly S&P500 price index from 1871 to 2010.
In contrast to unit root tests, fractionally integrated models consider that data has long memory. Koustas and Serletis (2005) stated that these models are suitable for low-frequency behaviour of stock prices, dividends, and their equilibrium relationship. The authors applied their model to the log dividend yield for the S&P500 index and concluded that, since the log dividend yield is a fractionally integrated process, there is no evidence of bubble-like behaviour in the data. Other authors have proposed similar approaches (Cunado, Gil-Alana, & de Gracia, 2005; Frommel & Kruse, 2012). Additionally, regime-switching tests try to find a shift between two regimes: a moderately evolving regime and an explosive and subsequently collapsing regime if a bubble exists (Wöckl, 2019). Some studies have used these models for bubble detection purposes, such as Al-Anaswah and Wilfling (2011), Balke and Wohar (2009), and Schaller and van Norden (2002).
2.3.2 Putting Prices vis-à-vis Fundamentals
Although there is a vast literature on bubble detection, the results depend on the way the model estimates the fundamental value. Once prices deviate from “fundamentals”, we cannot guarantee that it was actually a bubble or a wrong specification of the true fundamentals (Gürkaynak, 2008).
2.3.2.1 Stock Market
The great majority of studies that focused on tests for bubble detection in the stock market have used dividends as a proxy for stock’s fundamental value. Campbell and Shiller (2001), in line with their seminal contributions about present value models (e.g. Campbell & Shiller, 1988a, 1988b), concluded that dividend-price ratio can forecast movements in stock prices and, therefore, it is a suitable measure to evaluate firms.
As Leone and de Medeiros (2015) stated, dividend-price ratios provide a straightforward comparison between prices and fundamentals. Low dividend yields may indicate a stock price above its earning ability as represented by future dividends. Conversely, high dividend yields could be a sign of an undervalued stock. To check for bubbles, a decreasing trend of the
14 dividend yield can warn of a bubble implosion, since if prices are constantly increasing, at some point dividends should follow up the movement in prices (Leone & de Medeiros, 2015). If that does not happen, it implies that the firm is not able to produce earnings and the increase in prices is not accompanied by its fundamentals, and so a bubble arises (Craine, 1993; Shiller, 1981).
Just to name a few, Campbell and Shiller (1987), Froot and Obstfeld (1991), Shiller (1981), and West (1987) are some examples of early studies that have employed dividend-price ratios to test empirically the presence of rational bubbles in the stock market. More recently, many authors have used the price-to-dividend ratio to search for empirical evidence of rational bubbles in stock market data. For example, Gómez-González et al. (2017), Homm and Breitung (2012), Leone and de Medeiros (2015), and Nneji, Brooks, and Ward (2013) found evidence of rational bubbles by using this ratio as a measure that puts stock price vis-à-vis its fundamentals. In contrast, Koustas and Serletis (2005) used the same ratio but concluded in favour of the absence of rational bubbles in the data. Also, the PSY methodology which will be applied in the empirical analysis of the present dissertation, following Phillips et al. (2011), proposed to use the price-to-dividend ratio in order to detect bubbles in the stock market. Nevertheless, other ratios can be used for these purposes. Campbell and Shiller (1988b) considered real earnings as well-behaved predictors of firms’ present value. This conclusion was reinforced by Campbell and Shiller (2001) who showed that the price-smoothed-earnings ratio is a good valuation measure.14 Also Fu, Zhou, Liu, and Wu (2020) used price-to-earnings
ratio to evaluate the probability of a stock market crisis. Deng, Girardin, Joyeux, and Shi (2017) tested bubble contagion from the stock to the housing market in China between 2005 and 2010 by identifying stock market bubbles using weekly price-to-earnings ratios. In a similar vein, Leone and de Medeiros (2015) used the price-to-earnings ratio as a robustness check of their main analysis based on price-to-dividend ratios. Also, Hu and Oxley (2018) used price-to-earnings ratios to identify stock market bubbles. S. J. Lee, Posenau, and Stebunovs (2020) identified equity market pressures by using both price-to-earnings ratio and dividend yield data. In turn, Herwartz and Kholodilin (2014) concluded that price-to-book ratios have stronger explanatory power for the emergence of asset price bubbles. All these ratios were proposed to evaluate the stock market as a whole. However, evaluating a firm or a specific sector demands that the specific characteristics of each are considered. 14 The authors smoothed earnings by considering an average of real earnings in a 10-year period.
15 Shortly, some issues can undermine the correct valuation of a firm or sector. A specific dividend policy could bias the results that are based on price-to-dividend ratios. An example is the technology sector in which many companies do not pay dividends (Kim & Seo, 2014). Also, the price-to-earnings ratio is likely to pose problems when firms achieve negative earnings over a long period.15
Since banks are systemically important institutions, some authors have proposed to study bank bubbles separately and suggested particular market-to-book ratios to evaluate its fundamentals. Bertsatos and Sakellaris (2016) constructed a dynamic model of stock valuation for banks and defined a price-to-book ratio as a positive function of the expected growth of net income and dividend payout ratio, and negatively influenced by the cost of equity. Additionally, Bertsatos, Sakellaris, and Tsionas (2017) tested the impacts of the recent financial crisis on banks’ value considering price-to-book ratios as a valuation measure for this specific sector. To check for bank stock bubbles, Cajueiro and Tabak (2006) applied a bilinear test for logarithmic returns of 39 banking stock indices (both developed and emerging economies) from December 1994 to October 2003 (daily data). The authors found strong evidence of rational bubbles in most indices. Also, Miao and Wang (2015) proposed a theoretical model in order to explain the emergence of bank bubbles through a positive feedback loop mechanism.
2.3.2.2 Real Estate Market
As Virtanen et al. (2018) stated, the presence of rational bubbles can also be tested in real estate and credit markets. Many papers have used rents to empirically test real estate bubbles. This choice is based on the discounted cash flow model since rents are the payoffs associated with real estate investments. In this case, rents play the same role as dividends play in the stock market. Several authors have used this argument to advocate the employment of price-to-rent ratios for bubble detection in the real estate market (e.g. Deng et al. (2017), Floro (2019), Gómez-González et al. (2017), Gómez-González, Gamboa-Arbelaez, Hirs-Garzon, and Pinchao-Rosero (2018), Hu and Oxley (2018), Kivedal (2013), Phillips and Yu (2011), and Roche (2001)).
15 It could be the case of high-tech start-ups which report negative earnings in early life but have strong growth prospects (Bartov, Mohanram, & Seethamraju, 2002).
16 The real estate market can be divided into residential16 and commercial properties. As
Fabozzi, Kynigakis, Panopoulou, and Tunaru (2020) stated, rents are widely used as proxies for the fundamental value of the real estate market and its variants (both residential and commercial properties).17 However, these authors emphasised that data on rents may not
always be available. Therefore, other measures are also advocated in the literature.
Regarding the residential segment, the price-to-income ratio is a very popular alternative in the literature. This ratio is not only a valuable measure when data on rental markets is not available, but there is also an intuition behind: housing prices cannot increase indefinitely without being followed by income growth, under penalty of deteriorating the housing affordability (Arestis & Gonzalez, 2014; Chen & Cheng, 2017). Previous studies have found empirical evidence of a long-term equilibrium relationship between house prices and income, with both being cointegrated (Black, Fraser, & Hoesli, 2006; Malpezzi, 1999; Renaud, 1989), which suggests it as a reliable valuation measure. For instance, Anundsen et al. (2016) identified housing bubbles by testing for explosive behaviour in house price-to-income ratios of twenty OECD countries from 1975Q1 to 2014Q2.
Some authors have applied tests for bubbles detection to both ratios either as a robustness check or a joint analysis (e.g. Greenaway-McGrevy and Phillips (2016), Pavlidis et al. (2016), and Virtanen et al. (2018)). Vogiazas and Alexiou (2017) found evidence of overvaluation in the residential property market in most of the seven advanced OECD countries considered over 2002-2015 by using both rents and income as housing market fundamentals and concluded that both ratios produce similar results. Moreover, Shi (2017) proposed a composite measure for housing fundamentals. The author combined price-to-rent ratios with some macroeconomic variables such as real per capita income growth, population growth, and employment growth to investigate the existence of speculative bubbles in the U.S. national and regional housing markets during the period 1978-2015.
For the commercial property market, there are also alternatives to rents used in the literature. Since commercial properties are used to produce goods and services and so are mainly owned by companies, using price-to-income ratios may not be a suitable choice to evaluate these properties, as household income does not have a direct impact on its valuation.
16 The housing market is the residential property segment of the real estate market.
17 Hendershott, Hendershott, and Ward (2003) proposed rents as a valuation measure for the commercial property market.
17 Nneji et al. (2013) identified a commercial property bubble using a composite measure. A bubble was identified with a regime-switching model applied to a U.S. commercial property prices index divided by a combination of the following variables: GDP, long-term interest rates, money supply, term spread, and labour cost. The authors used quarterly data from 1978Q1 to 2012Q1.
In turn, F. Liu, Liu, Malekian, Li, and Wang (2017) considered GDP as the main fundamental to evaluate commercial properties. Besides, the European Central Bank (2010a) considered that commercial real estate is more synchronized with economic activity than the residential market. This study also assumed that disposable income is more suitable for residential properties while gross operating surplus is more adequate for commercial property valuation. Alternatively, some works propose Real Estate Investment Trusts (REIT) as a proxy for the real estate market (Brooks, Katsaris, McGough, & Tsolacos, 2001; Nneji et al., 2013). A REIT is a company whose core activity is trading commercial real estate properties (Escobari & Jafarinejad, 2016). Since their main revenues are rents and their assets are mostly commercial properties, these companies are significantly dependent on the performance of the real estate market (more specifically, the commercial segment). Although the early research on the relationship between direct and indirect real estate markets reported mixed conclusions, as, on the one hand, some authors concluded that these markets are not close substitutes (e.g. Goetzmann & Ibbotson, 1990; Seiler, Webb, & Myer, 1999) and, on the other hand, others advocated that there is a close link between them (e.g. Clayton & MacKinnon, 2003; Giliberto, 1990), more recent studies provided evidence of a strong nexus between REIT and the underlying real estate market (Bianchi, Guidolin, & Ravazzolo, 2018; Ghysels, Plazzi, Valkanov, & Torous, 2013; M. L. Lee & Chiang, 2010; Nneji et al., 2013). Moreover, some authors have proposed REITs to evaluate the performance of the real estate market, since their stocks are traded on stock exchanges, are more liquid and less costly than other real estate investments, and also have more data available (Ghysels et al., 2013). For example, Bianchi et al. (2018) investigated whether the burst of the real estate bubble over 2007-2010 was predominantly caused by the performance of the residential property market or the whole U.S. real estate market using REIT data of a large panel of countries from January 1994 to December 2014 and found no evidence of a pure residential real estate bubble during the sample period. Moreover, Ghysels et al. (2013) proposed REITs as an easy alternative to the valuation of the commercial real estate market, mainly because of the
18 complications related to the construction of real estate indices. Carmichael and Coen (2018) proposed to analyse the importance of the property market as a potential risk factor in asset returns determination and used REIT markets to determine the real estate factor.
Also, many tested for the presence of speculative bubbles in the REIT industry, as it is vulnerable to speculations in unsecuritised real estate markets (Bianchi et al., 2018). Brooks et al. (2001) applied variance bound tests to REITs and found evidence of some bubble periods in the United Kingdom (U.K.) real estate market using data from January 1986 to January 1998. Also, Fabozzi et al. (2020) tested for the presence of bubble-like behaviour in the U.S. and U.K. REIT markets from the late 1980s/early 1990s to 2015 and found evidence of explosive processes in both countries. Conversely, Jirasakuldech, Campbell, and Knight (2006) rejected the hypothesis of a bubble in REITs by applying unit root and cointegration tests to U.S. data over 1973-2003.
2.3.2.3 Credit Market
Although credit has supported unprecedented economic growth over the last century, credit bubbles which are defined, according to Mendoza and Terrones (2008), as an excessive credit growth in comparison to economic activity can lead to deep financial crises (e.g. Alessi & Detken, 2018; Reinhart & Rogoff, 2008; Schularick & Taylor, 2012).18 Jordà et al. (2015)
reinforced this argument and stated that “what makes some bubbles more dangerous than others is credit” (p. 1).
Many studies have considered credit-to-GDP ratio as an appropriate measure to identify an overgrowth of credit granted, in line with the previous definition of a credit bubble (e.g. Anundsen et al., 2016; Floro, 2019; Vogiazas & Alexiou, 2017). Alternatively, Korkmaz, Erer, and Erer (2016) found evidence of a credit bubble in Turkey using quarterly data on total credit volume from 1986 to 2014.
However, in accordance with some literature on early warning systems for banking crises, the credit market should be analysed by using a segmented approach (e.g. Anundsen et al., 2016; Büyükkarabacak & Valev, 2010; Virtanen et al., 2018). Anundsen et al. (2016) decomposed the credit market into credit to non-financial enterprises and credit to households and non-profit institutions serving households. For each, the authors
18 Since in the literature, the term “bubble” is mostly associated with asset prices, credit boom could be a more appropriate expression when referring to the credit market. However, the present work will refer to excessive credit expansion as a credit bubble, following the definition of Mendoza and Terrones (2008).
19 constructed credit-to-GDP ratios and found evidence that both types of credit have significant positive impacts on the likelihood of a banking crisis. However, they also suggested that household credit has greater marginal effects on the probability of a forthcoming crisis than credit to non-financial companies.
Büyükkarabacak and Valev (2010) also decomposed the credit series and concluded that household credit has robust impacts on the likelihood of a crisis, while corporate credit is less robust. These authors explained the importance of constantly monitoring household credit. On the one hand, the relative weight of household credit on total credit has significantly increased over time, and, on the other hand, this type of credit increases debt levels without necessarily increasing long-term output growth.
Just to mention a few more studies that proposed segmentation of the credit market, Alessi and Detken (2018) proposed to split credit into households and non-financial corporations; Kemme and Roy (2012) used private sector debt as a percentage of GDP as a suitable cause of banking crises; Virtanen et al. (2018) identified credit bubbles by using three different measures: total credit to GDP, bank credit to GDP, and household credit to GDP ratios; and S. J. Lee et al. (2020) identified financial vulnerabilities in terms of leverage by collecting data on bank credit to the private non-financial sector (% GDP), credit to households (% GDP), and equity capital to total assets of the banking system.
2.4 Exploring the Nexus Between Credit, Real Estate, and Stock Markets
As will be discussed below, in the literature on asset market linkages, it is widely accepted that credit, stock, and real estate markets are significantly interconnected.
The reason why credit bubbles often spread to asset markets is commonly explained using the financial accelerator (Bernanke, Gertler, & Gilchrist, 1996, 1999) and leverage cycle (Geanakoplos, 2010) theories. The concept of “financial accelerator” is related to mechanisms by which financial markets amplify the effects of shocks in the economy. These mechanisms generate a feedback loop between the financial sector and the real economy, which may reinforce each other. A positive shock in the credit market (e.g. lower interest rates following a Central Bank’s decision) can lead to booms in asset markets as it will cause economic agents to borrow more with the objective of buying more assets (Geanakoplos, 2010). Their balance sheets will increase and hence they may provide more collateral in order to get more credit (Bernanke et al., 1996). The increased demand for assets will result in
20 higher prices. Then, the same process will continue since higher prices will lead to larger collateral and hence to higher credit, and so on. As Geanakoplos (2010) mentioned, leverage plays a central role in the transmission of credit shocks to other markets. During this process, banks also ease credit conditions in order to obtain higher returns, and more leveraged borrowing will be allocated to acquire assets and drive their prices up (Geanakoplos, 2010).19
The same process applies to the crash. Once bad news increase uncertainty and market volatility, lenders become anxious and start to demand higher collateral. Credit growth drops and so does the demand for assets. Hence, the lower the demand for assets the higher the reduction in asset prices. During this deleveraging process, leveraged buyers face huge losses and prices continue their downward movement (Geanakoplos, 2010).
2.4.1 Credit and Real Estate
On the basis of the foregoing, credit bubbles can cause a bubble-like behaviour in both real estate and stock markets. When banks grant credit to the private sector, a boom in real estate can emerge in two segments: residential real estate and commercial properties.
As Cerutti, Dagher, and Dell'Ariccia (2017) mentioned, household credit boom is a powerful predictor of housing bubbles. A positive shock in household credit leads individuals to purchase more houses and, hence, it will produce an upward price pressure in the housing market (Arestis & Gonzalez, 2014). Once prices start rising, household balance sheets increase and they can offer more valuable collaterals to obtain more credit (Agnello & Schuknecht, 2011; Herring & Wachter, 2003). Then again, the higher the household credit the higher the demand for houses. With the supply in the housing market being inelastic in the short run, prices keep growing as a result of demand pressure. During this cycle, households become extremely leveraged, often without realising the risks involved as they are living the euphoria of their success (Sornette & Woodard, 2010).
Excessive credit granted to corporations may also contribute to the emergence of a bubble in the residential segment. On the one hand, purchasing and selling houses is the core business of real estate companies. Hence, they resort to credit in order to buy houses that can generate upward pressure on residential property prices. On the other hand, some companies deviate from the core business and invest in the housing market in the search for
19 During periods of low interest rates, banks are encouraged to make risky and less liquid investments in the “search for yield” (Dombret & Goldbach, 2017).
21 profitable investments and risk hedging. Therefore, instead of financing their main activities, these firms may use credit to invest in the real estate market (Deng et al., 2017).
Akin, Montalvo, Villar, Peydro, and Raya (2014) suggested a different mechanism by which credit and housing bubbles emerged in Spain from 2005 to 2010. The authors argued that, in Spain, bubble-like behaviour in the housing market was due to bank agency problems. As a response to strong regulation in the banking system, real estate appraisal firms were encouraged to overestimate the real value of the properties to satisfy their clients that are predominantly banks. This ability of banks to influence the valuation of properties by the appraisal firms drives prices up (Bian, Lin, & Liu, 2018). It may also induce a credit boom by the fact that higher prices in the real estate market mean a greater need for credit.
Vogiazas and Alexiou (2017) found evidence that bank credit growth is the basis of housing bubbles which supports the commonly accepted housing price-credit nexus. Real GDP, long-term bond yields and real effective exchange rates are other significant drivers of housing bubbles that authors detected using quarterly data from seven OECD countries (Australia, Belgium, Canada, Denmark, Great Britain, Norway, and Sweden) during the period 2002Q4-2015Q2.
Regarding the commercial real estate market, a bubble may also emerge as a result of a credit boom. As mentioned before, this segment of the real estate market is mostly owned by firms as it is used for the production of goods and services. Therefore, credit to businesses may be channelled into commercial property investments which, in turn, leads to higher property prices. The value of the firms’ collaterals starts increasing and allows firms to obtain more and more credit (European Central Bank, 2010b). As a consequence, the cycle continues its self-reinforcing movement. The European Central Bank (2010b) reinforced the important implications that the commercial property market has for financial stability as credit granted to invest in commercial real estate tends to be more volatile which affects bank’s portfolio management. Moreover, banks also invest in commercial properties and, considering that this specific segment of the real estate market has implications for the real economy, banks are exposed to both direct and indirect risks (European Central Bank, 2010b).
2.4.2 Credit and Stock
The above-mentioned theories on which the financial cycle is based can also explain how credit booms cause stock market bubbles (Wang & Chen, 2019). The mechanism is similar
22 to that of the real estate market. A positive shock in credit to corporations, which makes access to credit easier and less costly, allows firms to finance their capital projects and increase production capacities (Bernanke et al., 1999). This, in turn, makes firms expand their businesses, which can be conducive to greater profits. As a result, the increase in firms’ ability to generate cash flows will lead to an upsurge in their market value (i.e. stock price). Furthermore, the creditworthiness of the companies will increase, leading to higher collaterals and, hence, improve their ability to borrow from a financial institution (Kapopoulos & Siokis, 2005). Firms can also use credit to purchase stocks, thereby contributing to the increase in stock prices. Then again, the collateral value will rise and ease the access to more credit (Fostel & Geanakoplos, 2013).
Credit to households may also stimulate a stock market boom in case of consumer credit. The intuition is clear-cut: credit allows more consumption which in turn boosts firms’ sales and profits. Hence, the higher the expected future earnings, the higher the stock price. In the opposite direction of the implication, Poterba (2000) concluded that the stock market performance has a positive impact on consumption.
There is empirical evidence supporting this close link between credit and stock market bubbles. For instance, Wang and Chen (2019) demonstrated that credit as a percentage of GDP and its lagged term are the main drivers of equity bubbles using quarterly data from 22 representative countries, including OECD and emerging economies, over 2000-2018.
2.4.3 Stock and Real Estate
The interconnectedness between the stock and real estate markets is based on a number of transmission channels that are well known in the literature (Changa, Lib, Millerc, Balcilard, & Guptae, 2013; Fan, Li, Shi, & Su, 2018; Liow, Huang, & Song, 2019). The credit-price mechanism20 has been addressed in this section. This channel explains a unidirectional
movement from the real estate market to the stock market. Properties are commonly used as collateral by firms and households while accessing credit. Hence, an increase in property prices will ease borrowing constraints and enable leveraged households and firms to boost consumption and investment which in turn will result in higher stock prices.
23 The second mechanism is the wealth effect. Considering real estate as an investment and a consumption good,21 an unexpected increase in stock returns as a consequence of a rise in
stock prices will lead to an expansion of individuals’ wealth, causing an increase in total consumption and hence an expansion of real estate consumptions and prices (Liow et al., 2019). Therefore, this mechanism explains the one-way movement from the stock market to the real estate market. Finally, there is also a substitution effect that drives the relationship between these two markets. This channel is based on the seminal paper on the portfolio management theory of Markowitz (1952). The rationale behind the mechanism is simple: when the stock price goes up, the share of the stock market in the economic agents’ portfolios increases. Then, they will rebalance their portfolio by selling stocks and purchasing other assets, such as real estate (Fan et al., 2018). The increased demand for real estate assets will raise property prices. The same holds for the inverse causality.
Deng et al. (2017) and Gómez-González et al. (2017) pointed to another mechanism through which bubbles may transmit from the real estate to the stock market. Deng et al. (2017) called it the expectation formation effect. While prices in the real estate market are increasing and investors expect that they will continue to do so, investing in this market is expected to be profitable. Due to rising investment, a bubble may appear in this market. However, at some moment, the price will be excessively high, and investors realise that this growth is no longer possible. Then, investors will reshape their portfolios by selling real estate assets and investing in other markets. The real estate bubble will disappear as another come up, for instance, in the stock market (Gómez-González et al., 2017).
Several papers have empirically tested the relationship between the stock and the real estate markets. Ali and Zaman (2017) used monthly data on 22 European Union countries from January 2007 to October 2012 and concluded that house prices affect stock prices only in the long-run, however, the opposite causality holds for both the short-run and the long-run. Although the results do not hold for the whole sample period, Changa et al. (2013) found evidence that the U.S. housing market has strong impacts on the stock market, especially during 2007-2010. Fan et al. (2018) also found evidence that the housing market has positive effects on the stock market using data on Chinese housing and stock markets from January 2000 to December 2016. The authors found strong evidence of a reciprocal influence between housing and stock markets. The strong link between these two markets was also
24 confirmed by Hoesli and Reka (2015), Liow (2016), among many others (e.g. Gyourko & Keim, 1992; Hui & Chan, 2014; Lin & Lin, 2011; Okunev, Wilson, & Zurbruegg, 2000). However, Ding, Chong, and Park (2014) found no evidence of a significant causal link from land to stock markets in China during the period 1998-2011. Guo, Chen, and Huang (2011) concluded that the credit default market and the stock market do not affect significantly the real estate market.
Furthermore, a real estate bubble is more prone to occur than stock bubbles due to the prevalence of unsophisticated investors (households), short-sale constraints, and excessive costs to eliminate arbitrage opportunities (Deng et al., 2017; Scherbina & Schlusche, 2014). Gómez-González et al. (2017) added that the housing market is more heterogeneous and depends on subjective individual preferences. Besides, the stock market is easily traded in electronic platforms with high liquidity and trading volume, preventing arbitrage opportunities.
2.4.4 The Central Role of Banks and Conditions for Credit Booms
The emergence of a bubble in the real estate and stock markets caused by excessive credit growth may cause an overvaluation in bank stocks (Herring & Wachter, 2003). On the one hand, banks supply credit against the presentation of appropriate collaterals which may be, for instance, properties or stocks. If prices in these markets are increasing, the value of the collateral is likewise rising. Therefore, not only this allows banks to give more credit as a result of a decline in the perceived risk of lending, but it also raises the value of the existing loan contracts (Herring & Wachter, 2003). Both contribute to the expansion of their profits which may lead to higher bank stock prices. On the other hand, banks also have real estate and equity investments in their balance sheets (Herring & Wachter, 2003). A bubble in these markets lead to the expansion of bank assets and contribute to the emergence of an explosive behaviour of the bank stock prices.
Like the upswing of the financial cycle is a self-reinforcing process with interactions across different markets, similarly, the crash drags every market involved down. This is due to the interconnectedness between them. Thus, when a negative shock brings house and stock prices down and possibly bursts the bubbles, not only the value of the collaterals decreases but more importantly has an adverse effect on economic agents’ wealth and income (H. H. Liu & Chen, 2016). Hence, there is an increase in credit delinquencies which dramatically raises uncertainty. While households and firms start failing to repay their loans, banks tighten