Influence of Water Content on the Thermal Degradation
Kinetics of Ascorbic Acid at Low Water Contents
Jestis M. Frias,a Jorge C. Oliveira,‘* Luis M. Cunha” &
Fernanda A. Oliveira’
“Escola Superior de Biotecnologia, Universidade Catolica Portuguesa, R. Antonio Bernardino de Almeida s/n 4200 Porto, Portugal
“Inter-University Institute of Macau, NAPE Lote 18, Rua de Londres, Macau
(Received 18 September 1997; accepted 2 July 1998)
ABSTRACT
The kinetics of thermal degradation of ascorbic acid was studied in a Maltodextrin matrix at different temperatures between 7.5 and 140°C. Isothermal experiments were performed with samples earlier equilibrated in environments of known a, at 4°C enclosed in hermetically sealed vials, with water contents (w) between 0.17 and 168g water/g solids. Sampling times were selected according to an optimal experimental design in terms of minimum confidence regions of the parameters estimated, using the Bigelow model and estimates from preliminary experiments. The results showed a quadratic dependence of the reference D-value and linear dependence of the z-value with moisture content: D r(1400C, = 150*07-290*73w+-269w2 (min); z = 12*14+22.99w (“C) and showed the applicability of D-optimal designs for determining kinetic parameters in complex situations, with limited experimental requirements. The dependence of the rate constants with water content could not be described by the WLF model in qualitative terms, although in absolute values this model could be used with constants similar to those expected from glass transition theory. The thermodynamic analysis of the results showed a good application of the compensation theory in the whole range of water contents. 0 1998 Elsevier Science Limited. All rights reserved
*To whom correspondence should be addressed. E-mail: [email protected] 69
J.M. Frias et al. NOMENCLATURE Concentration of ascorbic acid (mg/ml) Initial concentration of ascorbic acid (mg/ml)
Decimal reduction time at the reference temperature (min) Energy of activation (cal/mol)
Rate constant at Tj (min-‘) Time (min)
Temperature (“C)
Isokinetic temperature (“C) Reference temperature (140°C)
Harmonic mean temperature (377.07 K) Water content (g/g dry)
Number of “C required to change the D-value by one decimal log unit (“C)
Matrix of the derivatives of the response function in order to the model parameters
Fractional concentration for the ith experiment Modulus of the determinant of F (Vmin) Enthalpy (J/mol)
Gibbs free energy (J/mol) Entropy (J/mol/K)
1. INTRODUCTION
The optimization of drying processes and its monitorization and analysis requires adequate indicators of the processing impact. In terms of nutritional retention or microbial lethality the degradation/death phenomena can be described by mathe- matical models that are essential for the engineering calculations, these must account for the effect of both temperature and water content. The physico-chemical characteristics of the matrix influence the kinetic parameters significantly (e.g. pH, ionic strength). For a complex process such as drying, it is very difficult to find indicators that mimic well the major quality descriptors or to optimize processes with model systems. The kinetic model and parameters of the actual target to optimize in the real matrix in question must therefore be used.
Unfortunately, as the variation of the kinetic parameters both with temperature and water content must be well described, the experimental requirements can be very large. Temperature dependence is normally relatively simple to model (many systems show apparent first-order degradation kinetics with Arrhenius temperature dependence in reasonable temperature-time ranges), but the influence of water content on the kinetic parameters is less established. Many experiments are there- fore needed to obtain a reasonable statistical significance of the models used for describing the joint influence of T and w on the kinetic parameters. It should be noted that as the kinetic parameters depend on physical properties and chemical composition of the matrix which typically vary significantly in food products, regular calibration is required to ensure that the model and parameters in which the optimization is based are adequate for the current processing situation. Therefore minimizing experimental requirements is very important.
The thermal destruction of ascorbic acid in food products and model foods is a well investigated area (Lee & Labuza, 1975; Ritter, 1976; Lee et al., 1976; Dennison & Kirk, 1978; Rao et al., 1981; Haralampu & Karel, 1983; Eison-Perchonok & Downes, 1982) with special reference to the work performed by Karel and co- workers (Mishkin et al., 1982, 1983, 1984) where the degradation of ascorbic acid during air drying was modelled and then applied to the selection of optimal process operating conditions (dry bulb temperature). Recently Banga & Singh (1994) solved different optimization problems in drying using previously developed models. How- ever, the application of such methodologies requires a more comprehensive description of the system kinetics, as a joint function of temperature and water content.
There are two major routes for minimizing experimental requirements while maintaining statistical significance:
l Design experiments at constant values of T and w according to optimal methods. The sampling conditions (temperature, time) that minimize the regression errors can be determined if there is a reasonable certainty of the type of decay model (Oliveira et al., 1995). The variation of the kinetic param- eters with T and w can be analysed.
l Perform dynamic experiments, that is, non-isothermal drying experiments. This requires the acquisition of moisture, temperature and quality factor concentra- tion data during an actual drying process (Mishkin et al., 1983) where T and w vary, and then fit the data assuming a given overall model (Mishkin, 1983; Frias & Oliveira, 1997a,b). It should be noted that it is not possible to control
T and w independently, in such a way that optimal designs can be used in this case, unlike non-isothermal methods for determination of kinetic or diffusional parameters (Cohen et al., 1994; Rhim et al., 1989; Oliveira et al., 1995).
The latter has the disadvantage of requiring regressions with models that may have many parameters, which can raise many problems of convergency, collinearity between parameters and statistical significance. It also requires a prior assumption of a given dependency of the kinetic parameters with T and W, and this may need preliminary experiments.
The objective of this work was to apply the first methodology above mentioned, based on the D-optimal design of experiments at constant T and W. A model system was used, to avoid variability in the raw materials, studying the thermal degradation of ascorbic acid in maltodextrin solutions. The results are also of interest for the second alternative (dynamic experiments), as a type of dependency of the kinetic parameters with w will be obtained. The main purpose, however, was to establish the experimental requirements that are typically needed for the implementation of this methodology. It should be noted that the condition of constant water content in the experiments was fulfilled (approximately) by using closed systems. Therefore, it was not expected that the exact parameters obtained here can be used directly to predict a drying situation without further validation, but it is hoped to identify the model structure. Drying experiments can then be performed to adjust the model parameters, if necessary, as proposed by Mishkin et al. (1984).
72 J.M. Frhs et al.
2. MATHEMATICAL MODELLING AND DESIGN STRATEGY
For modelling the thermal destruction of quality factors two different models are often used, the so-called Bigelow or TDT model and the Arrhenius model (Saraiva, 1994). It should be noted that the mathematical handling of the Bigelow model in statistical analysis and optimization problems is simpler than that of the Arrhenius model. For the Bigelow model, one can write
(1)
where D,, the D-value at a reference temperature, is the time required for one decimal log reduction of the concentration at the reference temperature T, and z is the number of “C required to change the D value by one log unit. The experimental goal was the determination of the unknown functions Q.(w) and z(w), being w the water content in dry basis.Similarly, the Arrhenius model is:
I I
--+)dt T+273
q being the reference temperature Kj the rate constant at q and Ea the activation energy, with Kj and Ea being potentially functions of w.
The use of a reference temperature in the Arrhenius model decreases the collinear- ity of the joint confidence region (Saraiva et al., 1996). In the Arrhenius model the harmonic mean temperature (104°C) of the experiments was used as reference temperature in order to minimize the error associated with the determination of the thermodynamic parameters (Manan et al., 1995). However, this temperature would not be the most adequate for the Bigelow model. The data analysis will show that the use of T, = 140°C in this latter case is more adequate, because the variation of D with moisture is more representative at that temperature.
The experimental strategy was the following:
(1)
(2)
(3)
(4)
(5)
Conventional heuristic isothermal experiments of thermal destruction at three moisture contents and four temperatures were performed.
With these experiments, the basic kinetic model was verified and preliminary estimates of the parameters and of their dependence on water content were obtained.
Using these estimates, the optimal experimental sampling design, leading to minimum confidence regions of the parameters (D-optimal design) (Box & Lucas, 1959), was determined.
This experimental design was applied for eight water contents and the varia- tion of D, and t with water content was re-analysed.
The model of the dependence of the kinetic parameters on water content was revised and the best parameters were then determined by performing a single non-linear regression to all the data.
(6) The model results were compared with the first isothermal (heuristic) experi- ments, for cross-validation.
2.1. Design of D-optimal isothermal experiments
The design of experiments involving response and regressors that are connected through a non-linear regression procedure, like those of destruction kinetics, has been studied by researchers, proposing design criteria to select the optimum sampl- ing points (Box & Lucas, 1959; Atkinson & Hunter, 1968; Chaudhuri & Mykland, 1993). The application of D-optimal design in food studies has been proposed by Oliveira et al. (1995) and Cunha et al. (1997). The latter have studied theoretically its application to the Bigelow model. This design criterion considers that the ‘real’ parameters of a given system will probably lie somewhere inside the confidence region of a given regression, thus the smaller this region, the higher the precision. This does not imply that the regression results are accurate, that is, as close as possible to the ‘real’ parameters, but provides the easiest path to maximize precision and minimize experimental bias (Oliveira et al., 1995).
As shown by Box & Lucas (1959), the volume of the confidence region of the parameters estimated by the regression of the experimental data is proportional to the Jacobian jFTFl - “2 of the derivative matrix F (where FE bj] and fij = a~,/aOj evaluated at t = ti,l pi 5~). Therefore, the minimum confidence region is obtained when the determinant D = IFTFI is maximum. If II =p the problem can be simplified to the maximization of A = mod(lFI) (Box & Lucas, 1959). For isothermal experi- ments, a minimum of two samples is required to estimate D, and z.
The optimal design for a more general case of a number of sampling points larger than the number of parameters (n >p) has only been studied for a few cases (Atkinson & Hunter, 1968) but it has been concluded that in many situations, and particularly for first order decay rates, the optimum design consists in replicating the optimal sampling points for 12 = p.
The following design was therefore applied in this work:
(1)
(2)
(3)
(4)
Initial estimates of the kinetic parameters were obtained and the kinetic model verified by performing preliminary experiments.
The physically attainable limits of the control variables were established, in this case time and temperature.
The D-optimal design for a number of sampling points equal to the number of parameters (n =p), was defined using the initial parameters estimated in step 2.
Experiments were performed replicating the optimal sampling points, for n >p.
The system response for isothermal experiments q(T,t) is:
T-T, fl0 z(w)
q(T,t) = lo- n,(w)
(3)
74 J.M. Ftias et al.
A=mod
= mod
vJn(tlhlNr/2W~
D,z2 (Tz-T,)
(4)
where ql is the system response for the experiment at T1 and y12 at T2. The determinant is therefore maximized if T2 - T,, yll In (rl) and q2 In (q2) are maxi- mized. This implies that experiments should be conducted at the extreme temperatures in the range tested and, for each temperature, sampling times should correspond to a reduction of one natural log cycle. Therefore the sampling times for the two isothermal experiments are (Cunha et al., 1997).
DT,
t,= -
1nlODT2
t2= - 1nlOThis analysis implies that the initial concentration C, is well known. Because C, with ascorbic acid solutions may vary significantly from sample to sample (the sample has to be equilibrated to the desired water content for several weeks), it was decided to analyse for t = 0 as many times as for t, and t2.
3. MATERIALS AND METHODS 3.1. Model food preparation
Vitamin C (Sigma A-1417) was added to a 400 g/l solution of maltodextrin DE12 (Glucidex 12, Roquette, France) in distilled water, to make up a concentration of 8 mg/ml; O-5 ml of this solution was transferred to a 4-ml Chrompak vial and placed for equilibrium in saturated binary salt solution atmospheres using the procedure described by Hendrickx et al. (1992) at 4°C. These environments corresponded to water activities of O-11, 0.23, 0.34, O-43, O-58, 0.76, 0.82 and 0.92 at 4°C that are equivalent to a water content of 0.17, O-37, 0.57, 0.72, 1.01, 1.34, 1.41 and 1.82 g/g dry mass on the maltodextrin, as determined experimentally. At these water con- tents the matrix varied from a moisted powder to a viscous paste-like solution. After equilibrium the vials were tightly crimped. At the inactivation temperatures, the actual water contents in the solid phase will be lower, as some water molecules evaporate and pressurize the closed vials. In a similar situation for ribonuclease, Multon & Guilbot (1975) found that the equilibrium relative humidity at 62°C in
closed vials, compared to 4°C decreased slightly. The authors concluded that desorption could not occur extensively during heating in a closed container without an equilibrium relative humidity regulator. Results in the present work are always referred to the initial water content, knowing that some deviation will occur at the experimental temperatures.
3.2. Ascorbic acid analysis
HPLC analysis was performed in a Beckmann HPLC with a 126 solvent delivery system and a 166 Beckman UV-VIS detector (Beckman Instruments Inc., San Ramon CA, USA). A weighed sample was diluted in ultrapure water:methanol (955) in a 10 ml volumetric flask and 1 ml of freshly prepared internal standard solution 50 mg/50 mg (isoascorbic acid sigma I-0502) was added. The solution was filtered through 0.45 pm nucleopore filters (Syrfil 25 mm 0.45 pm FN) and 10 ~1 of the solution were injected into the HPLC. The mobile phase was water:methanol (95:5) and 6.82 g/l H2P04K and 1.86 g/l cetrimide at a flux of 1.7 ml/min. The column used was Spherisorb ODS18 (250 x 4.6 mm). Absorbance was measured at 261 nm.
3.3. Thermal degradation experiments
Thermal degradation experiments were performed at temperatures in the range 75-140°C in a thermostatic oil bath. When applying D-optimal design, experiments were performed at 75°C when the sampling time was less than 9 days and 95°C otherwise, to prevent degradation of the maltodextrin during processing. A second experiment was conducted at 140°C.
In order to avoid the errors caused by the thermal lag, the initial time was set to 2 min after immersion of the vials in the oil bath (which was experimentally found to be the time required to heat a vial from ambient temperature to 140°C). Zero time samples were therefore taken 2 min after immersion. Two vials were removed at each of the pre-specified sampling times.
3.4. Statistical analysis
The non-linear regression procedures and the related statistical analysis were per- formed with a commercial software package (STATA 3.0 CRC Santa Monica, CA, USA).
4. RESULTS AND DISCUSSION 4.1. Preliminary experiments
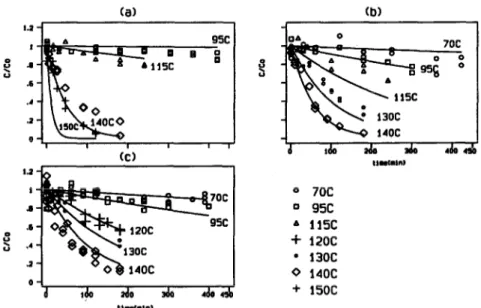
Preliminary experiments were performed at O-17, 1.00 and 1.35 g water/g dry matter and temperatures ranging from 75 to 150°C (see Fig. l), with a heuristic distribution of the sampling times. These experiments confirmed that the kinetic behavior was clearly first order and was well described by both the Bigelow and Arrhenius models and provided initial estimates of the kinetic parameters. Results are shown in Table 1
76 J.M. Frh et al. (a) I o 7oc s O 95c .6 A 115c D s .d + 12oc .a . 13oc 0 14oc 0 + 15oc tlr(unI
Fig. 1. Experimental data obtained in the preliminary heuristic experiments. Lines show the global model predictions (section 4.2) (a) water content 0.17 g/g dry solids, (b) water content
1.00 g/g dry solids and (c) water content 1.35 g/g dry solids.
The data suggested a parabolic dependence of the Q-value with moisture, but no particular effect on the z-value. A single one-step regression of all the experiments yielded:
D, = 247.82 - 279.56w+1754453w2, z = 29.42, R:dj = 0.992 (7)
4.2. D-optimal design
With these estimates, the optimum sampling times were calculated (see Table 2). A series of isothermal experiments at O-17, 0.37, 0.56, O-72, 1.00, l-35, 1.47 and 1.68 g/g dry matter were then performed, at 75 or 95 and 140°C. These results confirmed the
TABLE 1
Kinetic Parameters Obtained in the Preliminary Experiments (Z’,. = 140)
w (g/g dry matter) D, (min) 2 CC) RL
0.17 195 * 17 32f4.0 0.974
l-00 141 k 6.2 27&2-l 0.997
TABLE 2
Experimental Sampling Times According to the D-optimal Design and Eqn (7) w (g/g dry matter) o-17 0.37 056 0.72 1.00 1.35 1.47 1.68 11224 3007 - 9965 - 8853 - 2115 - 2809 - 3167 - 3907 88.7 71.0 61.4 58.3 62.4 82.9 93,5 115.3
parabolic variation of Or, but indicated a linear increase of the z value with moisture [see Fig. 2(a)].
Considering these functions:
D, = a+bw+cw2 (8)
(a)
Fig. 2. D-optimal design results: (a) moisture influence on the z-value (b) moisture influence on the D,,,,-value (c) distribution of residuals and (d) residuals versus predicted concentra- tions. The error bands represent the individual 95% confidence interval of the individual
78 J.M. Frias et al.
z = d+ew (9)
and incorporating then back into eqn (1) a single non-linear regression of all 133 experimental points was performed to obtain the best overall parameters. The fit is shown in Fig. 2(a) and (b). The goodness of fit can be seen by the error distribution, which is approximately normal with average close to zero [Fig. 2(c)] and most points within +20, being G the standard deviation of the data (Cunha et al., 1997). The inaccuracy of the initial estimates caused some of the optimum design data to be actually far from the target value C/Co = O-367 particularly at 95°C and lower water content. Chaudhuri & Mykland (1993) have suggested a sequential algorithm for an iterative convergence to the best solution. Unfortunately, if this route is followed, the experimental requirements will increase. Alternatively, the model predictions can be compared with the preliminary experiments, which indicates that the inaccu- racies were caused by one outlier experiment in that set (W = 0.17 g/g dry matter and
T = 15O’C). This can be seen in Fig. 1 where all heuristic preliminary experiments
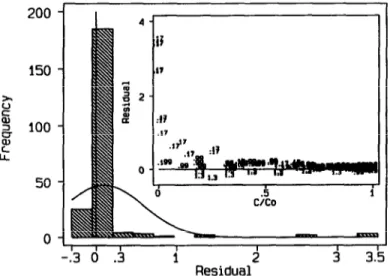
are compared with the model predictions based on the parameters obtained with the D-optimal experiments. The error between these experimental data and the model prediction is shown in Fig. 3. A normal distribution and a random error diagnosis plot would be obtained, except for the data of that single experiment. This outlier behaviour, that may be due to some experimental problem, was responsible for a z- value on that experiment well above the ‘real’ solution, which explains why the linear dependency oft with moisture was not evident in the preliminary data. Note in Table 1 that this corresponded also to the largest error in the estimated z value.
The approximately parabolic variation of D, with the moisture content indicates the existence of a water content where the ascorbic acid is more unstable (054 g/g dry matter at 140°C). Apparently, at this point the diffusion of the reactives and products gave optimum conditions for degradation. At higher or lower moisture
200
150
n 1
-.3 0 .3 1 2 3 3.5
Residual
Fig. 3. Frequency distribution and diagnosis plot of the residuals of the heuristic experiments
l.Oet06 - T=7SC
10
I I
0 .4 I I 1.6 I I
Moisture fQ H2WQ I%$ matter) 2
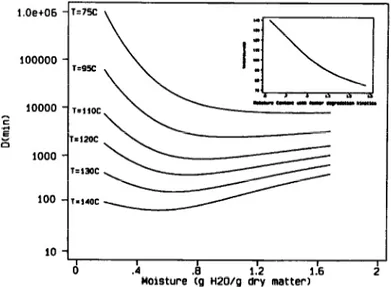
Fig. 4. Model predictions of the D-value variation for the Bigelow model with moisture content at constant temperature. The small plot shows the variation of the point where the
D-value is minimum with water content.
contents some reactives would not be at optimum concentrations, or the reaction would become limited by the diffusion processes. However, the linear variation of the z value with moisture implies that as temperature decreased this minimum was found at higher moisture contents (see Fig. 4). As a consequence, at temperatures around and below lOO”C, the minimum is not so clear. This made the use of the maximum temperature as reference temperature preferable.
These results indicated a protective effect of dehydration against thermal degra- dation of ascorbic acid at the lower temperatures. At higher temperatures (130-14O”C), dehydration actually led to a faster degradation rate of ascorbic acid. 4.3. Application of the glass transition approach
An alternative for describing the joint influence of water content and temperature on the degradation kinetics that is worth exploring is the application of glass transi- tion theory (Slade & Levine, 1991).
If the degradation kinetics would be controlled by molecular mobility in the solid matrix, then the D-value should increase with the average molecular relaxation time, and one could use the WLF equation (Roos, 1995), which is valid above Tg
D c,(T--T,) - =lO
DhJ
C,+(T- T,C) (10)
where DR is the D-value at the glass transition temperature, Tg
However, this equation cannot be applied in practice because Dg is extremely high. Writing eqn (10) for a reference temperature T, and dividing both, one obtains a more widely used form of the WLF equation (Roos, 1995)
80 J.M. Fnbs et al.
D --C,C,U--T,)
- = 10 (C*-(T~--,))(C*+(T--,~))
D, 01)
C, and C2 are constants that may vary somewhat with the system. C, is the differ- ence in order of magnitude between the molecular relaxation time in a glassy matrix (around lo3 s) and that of atomic vibration (around lo-l3 s), that is, should be around 16. For a large number of polymers, the values of C, = 17.44 and C2 = 51.6 have been suggested as universal constants (Slade & Levine, 1991). Tg is the glass transition temperature of the matrix, that for a simple binary system (maltodextrin- water, neglecting the effect of the ascorbic acid on Tg) is given by the Gordon-Taylor equation (Roos & Karel, 1991a):
T,=
kT,
H,O XH,O+T~ MDlZXMDl2kXH,o+XMD12
(12)
where XH,o and XMDr2 are the mass fractions of water and maltodextrin respec- tively, TgMD12 is the glass transition temperature of dried maltodextrin, TgH20 is the glass transition temperature of pure water, assumed to be - 135°C (Roos & Karel, 1991b) and k is the ratio of specific heat change in the glass transition. The Tg of the maltodextrin DE12 and the k for the system maltodextrin DE12/water can be estimated by interpolating the data published by Roos & Karel (1991a), yielding T &,MD12 = 164°C and k = 7.64. The resulting values are indicated in Table 3.
The whole experimental data were fitted to eqn (ll), with C, = 17.44, yielding an apparently reasonable fit (SSQ = 8.912 and Rzdj = O-9925) with Dr(,430cj = 170 f 30 min; C2 = 36 +2*5 K and T, = 143 +2*3”C (see Fig. 5). The C2 value obtained is well within reported values [Peleg (1992), collected C2 values from literature between 24 and 80 K].
Although quantitatively acceptable, the WLF equation does not predict a mini- mum D-value at the higher temperatures, as the experimental data indicated [see Fig. 2(b)]. Below T,, the D-value decreases with water content similarly to the data obtained but with no minimum and above T, the shape is reversed. This is shown in
TABLE 3
Glass Transition Temperature Estimated From Literature [Data Roos & Karel (1991a)] and Arrhenius Model Results From the D-optimal Experiments with the Corresponding Thermo-
dynamic Parameters
w (g/g dry matter) Cc?) 3 (Jlmol) &I (Jlmol) Am (Jlmol) AGS (Jlmol K) Ass
0.17 -8.2 0.00738 169 674 166538 130 197 96.376 0.37 -58.0 O-03168 131884 128744 125 617 8.294 056 - 79.0 0.07062 108848 105 713 123 104 -46.118 0.72 - 89.5 0.0963 94 893 91758 122 129 - 80.550 1.00 - 100.7 0.1023 78017 74 877 122313 - 124.800 1.47 - 110.9 0.07494 59 273 56 137 122916 - 177.106 1.68 -113.7 0.06426 53 632 50497 123 402 - 193.338
200 150 r E 3 x 100 k 50 0 -3 ci .5 Residual
Fig. 5. Distribution of residuals of the whole experimental set modelled using the WLF
equation.
Fig. 6. This means that qualitatively the WLF model cannot describe accurately ascorbic acid degradation in drying in the whole experimental range. This may be due to the effect of an increased concentration at lower water content, that is, at high temperatures and low water contents the degradation of ascorbic acid is not controlled solely by molecular mobility, which is a theoretically reasonable conclu- sion. l.Oet07 F l.Oe+06 . E 0 100000
Fig. 6. Model predictions of the dependence of the D-value on moisture content using the
82 J.M. Frhs et al.
However, if the WLF model would be used to predict the concentration data, the results would be fairly well described in quantitative terms. Figure 5 shows the distribution of residuals for concentrations predicted with eqn (11) and the experi- mental values.
4.4. Thermodynamic calculations
Labuza (1980) studied the enthalpy/entropy compensation effect in vitamin degrada- tion in several model foods. Three studies that were reviewed showed that the activation energy decreased with increased water content (the result obtained in this work), while one reported the opposite variation and another one did not suggest any pattern. These discrepancies did not allow confirmation of the effect of water on the degradation reaction, since the activation energy both increased and decreased with moisture in different experiments. For the results obtained in this work, enthalpy and entropy were calculated following the procedure suggested by Manan et al. (1995) for all-trans retinol degradation kinetics. Results are shown in Table 3.
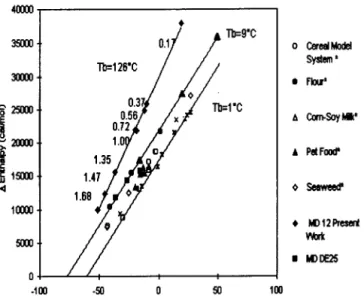
Figure 7 shows the comparison between the present work and some published results from ascorbic acid degradation in different food matrixes (Labuza, 1980; Nelson, 1993; Dennison & Kirk, 1978; Eison-Perchonok & Downes, 1982). Enthalpy and entropy are in the range of values reported in literature, but a very different isokinetic temperature (T,{#T,) of 126f 15°C was found, although a clear compen- sation effect is visible with the enthalpy and entropy decreasing with moisture content. This different Tp can be due to the use of small closed volumes in this work, that can lead to significant pressure differences, thereby causing inaccuracies
4am 3ml - 8- s i- flwa 4 loo00 saa 0 T- l -rm -50 0 50 im AErbapytwK)
Fig. 7. Compensation plot for ascorbic acid degradation. (*) Experimental data reviewed by Labuza (1980), MD DE25 from Nelson (1993), buffer solution from Eison-Perchonok & Downes (1982) and oxygen uptake in ascorbic acid solutions from Dennison & Kirk (1978).
in the definition of enthalpy, which assumes open systems or negligible increase on pressure, when applying the Manan et al. (1995) procedure.
It is also important to note that Labuza (1980) showed that when the confidence interval of the isokinetic temperature includes the harmonic mean temperature, large errors arising from the collinearity of the parameters can be expected. This implies that although a compensation phenomenon is very clear with these experi- mental results, it is not statistically valid to establish the isokinetic temperature as 126°C.
5. CONCLUSIONS
The D-optimal design proved to be an adequate and simple technique to obtain precise kinetic parameters, with reasonably small amounts of data.
It was found that the decimal reduction time at the reference temperature of 140°C followed an approximately parabolic dependence with moisture and the z value increased linearly with moisture. The whole set of data (133 experimental points) were adequately fitted
290*73w+269*30w2; z = 12_14+22*99w.
by a single model with D, = 150.07- With the exception of one outlying experiment, a good correlation between the preliminary heuristic experiments and this model was obtained, providing a cross- validation.
The application of the glass transition theory to the data, assuming the WLF equation, was not qualitatively successful, indicating that diffusion of reagents is not the single controlling factor of ascorbic acid degradation in maltodextrin at very low water content. However, quantitatively, predictions made with the WLF equation for D, = 170, C2 = 36 and T, = 143°C with C, = 17.44, TgMDIZ = 164°C and k = 7.64 would generate generally good estimates in absolute terms,
An enthalpy/entropy compensation phenomenon was clearly observed.
ACKNOWLEDGEMENTS
This research work was partly financed by the FLAIR programme (Contract No. AGRF-CT91-0051). The first author is most grateful to the financial support of the AAIR programme (ERBAIRCT925102). We also want to thank Mr Cezary Bernat for the support on the preliminary experimental part and Mrs Teresa R. Silva- Brandao for her valuable suggestions and advice.
REFERENCES
Atkinson, A. G. & Hunter, W. G. (1968). The design of experiments for parameter estima- tion. Technomettics, 10(2), 271-289.
Banga, J. R. & Singh, R. P. (1994). Optimisation of air dyring of foods. Journal of Food
Engineering, 23,189-221.
Box, G. E. P. & Lucas, H. L. (1959). Design of experiments in non-linear situations. Techno- metrics, 46, 77-90.
Chaudhuri, P. & Mykland, P. A. (1993). Nonlinear experiments: optimal design and infer- ence based on likelihood. Journal of the American Statistical Association, 88(422), 538-546.
84 J.M. F&s et al.
Cohen, E., Birk, Y., Mannheim, C. H. & Saguy, I. S. (1994). Kinetic parameter estimation for quality change during continuous thermal processing of grapefruit juice. Journal of Food Science, 59(l), 155-158.
Cunha, L. M., Oliveira, F. A. R., Brandao, T. R. S. & Oliveira, J. C. (1997). Optimal design for estimating the kinetic parameters of the Bigelow model. Journal of Food Engineering, 33, 111-128.
Dennison, D. B. & Kirk, J. R. (1978). Oxygen effect on the degradation of ascorbic acid in a dehydrated food system. Journal of Food Science, 43, 609-618.
Eison-Perchonok, M. H. & Downes, T. W. (1982). Kinetics of ascorbic acid autooxidation as a function of dissolved oxygen concentration and temperature. Journal of Food Science, 47, 765-773.
Frias, J. M. & Oliveira, J. C. (1997a). Degradation of ascorbic acid during drying. In Engineeting and Food at ICEF7, No. 2, p. G21, ed. R. Jowitt. Sheffield Academic Press, Brighton.
Frias, J. M. & Oliveira, J. C. (1997b). Kinetics of thermal inactivation of horseradish peroxi- dase in maltodextrin solutions during hot-air drying. In Engineering and Food at ICEF7, No. 2, p. G17, ed. R. Jowitt. Sheffield Academic Press, Brighton.
Haralampu, S. G. & Karel, M. (1983). Kinetic models for moisture dependence of ascorbic acid and p-carotene degradation in dehydrated sweet potato. Journal of Food Science, 48, 1872-1973.
Hendrickx, M., Saraiva, J., Lyssens, J., Oliveira, J. & Tobback, P. (1992). The influence of water activity on thermal stability of horseradish peroxidase. International Journal of Food Science and Technology, 27, 33-40.
Labuza, T. P. (1980). Enthalpy/entropy compensation in food relations. Food Technology, 34(2), 66-77.
Lee, S. H. & Labuza, T. (1975). Destruction of ascorbic acid as a function of water activity. Journal of Food Science, 40, 370-373.
Lee, Y. C., Kirk, J. R., Bedford, C. & Heldman, D. R. (1976). Kinetics and computer simulation of ascorbic acid stability of tomato juice as functions of temperature, pH and metal catalyst. Journal of Food Science, 42(3), 640-648.
Manan, F., Baines, A., Stone, J. & Ryley, J. (1995). The kinetics of the loss of all-trans retinol at low and intermediate water activity in air in the dark. Food Chemistry, 52, 267-273.
Mishkin, M. A. (1983). Dynamic modeling, simulation and optimization of quality changes in air-drying foodstuffs. PhD thesis, Massachusetts Institute of Technology, Cambridge, MA, USA.
Mishkin, M., Saguy, I. & Karel, M. (1982). Applications of optimisation in food dehydration. Food Technology, 36(7), 101-109.
Mishkin, M., Saguy, I. & Karel, M. (1983). Dynamic optimization of dehydration processes: minimizing browning in dehydration of potatoes. Journal of Food Science, 48, 1617-1621. Mishkin, M., Saguy, I. & Karel, M. (1984). Optimization of nutrient retention during process-
ing: ascorbic acid in potato dehydration. Journal of Food Science, 49, 1262-1266.
Multon, L. & Guilbot, A. (1975). Water activity in relation to the thermal inactivation of enzymic proteins. In Water Relation of Foods, ed. R. B. Duckworth, pp. 379-396. Academic Press, London.
Nelson, K. A. (1993). Using the glass transition approach for understanding chemical reac- tion rates in model food systems. PhD dissertation, Minnesota University, USA.
Oliveira, F. A. R., Silva, T. R. & Oliveira, J. C. (1995). Optimal experimental design for estimation of mass diffusion parameters using non-isothermal conditions. In Proceedings of the First International Symposium on Mathematical Modelling and Simulation in Agriculture and Bio-Industries, Brussels, Belgium.
Peleg, M. (1992). On the use of the WLF model in polymers and foods. Critical Reviews in Food Science and Nutrition, 32(l), 59-66.
Rao, M. A., Lee, C. Y., Katz, J. & Cooley, H. J. (1981). A kinetic study of the loss of vitamin C, colour and firmness during thermal processing of canned peas. Journal of Food Science, 46,636-637.
Rhim, J. W., Nunes, R. V., Jones, V. A. & Swartzel, K. R. (1989). Determination of kinetic parameters using linearly increasing temperature. Journal of Food Science, 54(2), 446-450. Ritter, E. D. (1976). Stability characteristics of vitamins in processed foods. Food Technology,
30(l), 48-51.
Roos, Y. H. (1995). Phase Transition in Foods, pp. 271-308. Academic Press, London. Roos, Y. & Karel, M. (1991a). Phase transition of mixtures of amorphous polysaccharides
and sugars. Biotechnology Progress, 7, 49-53.
Roos, Y. & Karel, M. (1991b). Water and molecular weight effects on glass transactions in amorphous carbohydrates and carbohydrate solutions. Journal of Food Science, 56(6), 1676-1681.
Saraiva, J. (1994). Effect of environmental aspects on enzyme heat stability and its applica- tion in the development of time temperature integrators. PhD thesis, Escola Superior de Biotecnologia, Catholic University of Portugal, Porto, Portugal.
Saraiva, J., Oliveira, J., Hendrickx, M., Oliveira, F. & Tobback, P. (1996). Analysis of the interaction of freeze dried cc-amylase from Bacillus amylolique faciens at different moisture contents. Lebensmittel-Wissenschaft und Technologie, 29, 260-266.
Slade, L. & Levine, H. (1991). Beyond water activity: recent advances on an alternative approach to the assessment of food quality and safety. Critical Reviews of Food Science and Nutrition, 30, 115-360.