NORTH-SOUTH ALIGNMENT IN NORTHEN ESPÍRITO SANTO STATE, BRAZIL Ana Paula Pereira Bis1, Fábio Luiz Partelli2, Weverton Pereira Rodrigues3,
Antelmo Ralph Falqueto4, Marcelo Curitiba Espindula5, Lima Deleon Martins6 (Received: July 29, 2019; accepted: September 25, 2019)
ABSTRACT: The objective in this work was to study the influence of the North-South plantation alignment with respect to microclimatic, growth, and mineral nutrition conditions in order to quantify the variables and to point out possible consequences for the coffee tree. The experiment was carried out in a 6-year-old conilon coffee (Coffea canephora) crop with a mean height of 1.6 m, cultivated in full sun and spaced 3.5 m x 1.0 m. The data were collected on four dates from December 2016 to September 2017 in North Espírito Santo State, Brazil. The irradiance, air temperature, and vapor pressure deficit variables were quantified by means of external data loggers. The leaf temperature was determined by means of thermal images, and the plant growth and nutrient concentration in the leaves on both sides of the plant (East and West) were evaluated. The West side of the plant showed higher values of irradiance, temperature, and vapor pressure deficit in the afternoon, reaching a difference of 5°C between the two sides. The leaf temperature had similar behavior to air temperature, reaching a difference of approximately 12°C between the two sides in the afternoon. Although significant differences were observed for some nutrients between the sides of the plant, macro and micronutrient leaf contents remained within the range considered adequate for the coffee tree.
Index terms: Coffea canephora, irradiance, temperature, East, West. 1 INTRODUCTION
Solar radiation is the source of energy for carbon fixation, so it is one of the main environmental factors that affect the development of plants, especially through photosynthesis. In addition, the solar radiation is fundamental in the characterization of the other climatic factors related to the growth of plant species. It is influenced by the orbit of the Earth around the sun during the year and by the inclination in its imaginary axis of rotation in relation to the plane of the terrestrial orbit (FERREIRA et al., 2012). The solar radiation captured by a crop is an important meteorological variable responsible for determining the transpiration and photosynthesis of the plant (ANGELOCCI et al., 2008). However, it is known that high irradiation values combined with high temperatures can damage the leaves, hindering several foliar metabolic processes and increasing the production of highly reactive molecules of chlorophyll and oxygen (RAMALHO et al., 1998; DAMATTA; RAMALHO, 2006).
In 2017 world coffee production surpassed 159 million bags, where approximately 60% was related to the production of Arabica coffee (Coffea arabica) and 38% to the coffee Robusta/
1,2,4Universidade Federal do Espírito Santo/UFES - Departamento de Ciências Agrárias e Biológicas - Centro Universitário
Norte do Espírito Santo - Rod. BR 101 Km 60 - 29.932-540 - Bairro Litorâneo - São Mateus-ES - [email protected], [email protected], [email protected]
3Universidade Estadual Norte Fluminense Darcy Ribeiro - Centro de Ciências e Tecnologias Agropecuárias Darcy Ribeiro -
Avenida Alberto Lamego, 2000 - 28.013-602 - Campos dos Goytacazes-RJ- [email protected]
5Empresa Brasileira de Pesquisa Agropecuária - Centro de Pesquisa Agroflorestal de Rondônia - BR 364 Km 5,5 - Zona Rural
76.815800 - Porto Velho-RO - [email protected]
6 Universidade Federal do Espírito Santo/UFES - Departamento de Agronomia - Centro de Ciências Agrárias e Engenharias -
Alto Universitário s/n - 29.500-000 - Guararema - Alegre-ES- [email protected]
Conilon (Coffea canephora) (ICO, 2018). In Brazil, the production of coffee in 2018 was about 61.66 million bags, where about 23% of this production corresponded to the conilon coffee, thus maintaining its position as the second largest producer in the world (CONAB, 2019). This important crop is exposed to high temperatures often extrapolating at 38°C in the summer, grain filling phase (PARTELLI et al., 2010; 2013; 2014). The prolonged exposure of the coffee trees to minimum temperatures of less than 17ºC or maximum values above 31ºC promotes a reduction in the growth rate, directly harming the production (PARTELLI et al., 2013). Generally, elevated temperatures result in an increase in the vapor pressure deficit (VPD) of the air that can, depending on the stomatal control, result in increased water loss through transpiration (NOBEL, 2009). The coffee tree presents limited capacity to replace the water lost by transpiration when submitted to the high VPD of the air, due to its hydraulic limitations that result in the stomatal closure (RODRIGUES et al., 2016a; 2018). Therefore, different strategies are necessary to mitigate the effects of environmental stresses in tropical regions where microclimatic conditions, combined with the occurrence of strong winds and
displacement that the Sun can have so there is greater availability of solar radiation at that point (CUNHA et al., 2011).
In order to determine the four alignments, the azimuth of the sun was calculated by means of the angle in the horizontal plane between the projection of the sun radius and the cardinal point NS based on the zenith angle, since it is this one that defines the position of the sun in relation to the local vertical plane. The azimuth representing each alignment for established dates, sunrise and sunset times, time angle, sun declination, and zenith angle (Table 1) is presented.
The microclimate characterization was performed using the measurement of the irradiance (lum/ft²), temperature (°C) and relative humidity (%) variables. Measurements were obtained by means of an external data logger (HOBO U12 Temp/RH/Light/External Data Logger), implanted at a height of 1.20 m and at two different positions per plant: West side and East side. This device was programmed to record the data every 10 minutes, between 6:00 and 7:00 in eight repetitions.
Based on the data of the relative humidity and air temperature obtained in the microclimatic evaluations, the vapor pressure deficit (VPD) was calculated according to the model proposed by Tetens (1930).
Thermal images were obtained using a Flir T440 infrared camera (FLIR-United States) with an emissivity of 0.98, an image gradient of 76,800 pixels (320 x 240), and a thermal sensitivity of 0.035°C. One leaf was chosen randomly in the upper third of the plant to quantify its point temperature on the side of the plant facing West and East of the crop. Freshly expanded leaves located in the upper third were selected. The experimental design was in subdivided plots, where the plots correspond to the timetables of the evaluations: 8:00 (T1), 10:00 (T2), 12:00 (T3), 14:00 (T4), and 16:00 (T5), as well as the subplots on both sides of the plant (East and West). The experimental plot consisted of 8 plants (repetitions), where growth, shading, number of nodes per branch, and microclimatic evaluations were performed.
For the growth study, measurements of the length of the plagiotropic and orthotropic branches were performed in the upper third with the aid of a graduated ruler, using the West and East sides of the plant. Evaluations were carried out on the same day as the first and last climate assessments. The number of nodes of the plagiotropic branches on each side of the plant was also quantified. high evapotranspiration rates, may be limiting to
coffee (PARTELLI et al., 2013).
In the hillside regions, the climatic factors that characterize the microclimate are influenced by the rotation of the Earth, seasonality, and the orientation of the slope face exposed to the sun, among other things (Ferreira et al., 2012). In flat regions, climatic factors are also defined by these characteristics; however, in this case, the orientation of the crop planting is one of the factors that most influence the local microclimate, due to the interception of direct solar radiation on both sides of the plant (OLIVEIRA et al., 2012). Therefore, understanding the system that constitutes the microenvironment is essential to create strategies to adapt to the effects of climate change (CRAPRARO et al., 2017). In this way, the objective of this work was to study the influence of the North-South plantation alignment regarding microclimatic aspects, plant growth, and mineral nutrition.
2 MATERIALS AND METHODS The experiment was conducted in a rural property located in the municipality of Boa Esperança, located in the Northern region of Espírito Santo (18°31’19.66 “South latitude and 40°20’36.75” longitude West) with an altitude of 146.42 m above sea level and flat relief. The local climate is characterized by the classification proposed by Köppen as Aw - tropical humid, with dry winter and hot and humid summer (ALVARES et al., 2013). The experiment was carried out from December 2016 to September 2017.
Data collection was performed in a conilon coffee plantation (Coffea canephora) planted in a spacing of 3.5m x 1.0m, aligned North-South, cultivated in full sun, and maintained under drip irrigation. At the beginning of the experiment, the plants were 6 years and 9 months old and had a height of approximately 1.6 m.
Four alignments for coffee were established based on four dates throughout the year: 1st) 12/15/2016, 2nd) 03/05/2017, 3rd) 06/18/2017 and 4th) 09/20/2017. These four alignments were calculated by determining the position of the sun at a given instant, at a given location, and date, all by means of the zenith angle.
For the calculations, a nine hour schedule was adopted because for a given latitude and date, the positioning of the sun at this time will form an hour angle of 45° with a reference point of the Earth, presenting a maximum angular
In these evaluations, a completely randomized experimental design with eight replications was used.
For the analysis of leaf concentration, the third and fourth leaves were collected from the apex of the branches, four leaves on each side of the plant, represented with four replicates. The leaves were packaged in paper bags, duly identified, and sent to the Plant Tissue Analysis laboratory where N, P, K, Ca, Mg, S, B, Cu, Zn, Fe, and Mn were analyzed according to Silva (2009). For statistical analysis, the scheme of sub-divided plots was used, in which the plots corresponded to the four dates evaluated and the subplots on both sides of the plantation. For these characteristics, a completely randomized design with 8 replications was used.
The data of leaf temperature, growth, node size, and leaf concentration were submitted to analysis of variance, and the means were compared by the Tukey test at 5% error probability, using the Genes statistical program (CRUZ, 2013).
3 RESULTS AND DISCUSSION
The mean irradiance on the East side of the plant presented higher values than the West side in the morning for all dates of the experiment (Figure 1). This is because the East side receives the incidence of direct solar radiation from morning to noon.
In the afternoon, the Eastern side of the plant no longer receives the direct solar radiation, and the side of the plant facing West receives this radiation, so higher values were obtained for this side at all dates of the experiment with the exception of on 09/20/2017. On 09/20/2017, similar values were obtained for both sides, due to the appearance of clouds during this period. The face of the planting line facing the afternoon sun is more susceptible to scalding, known as leaf discoloration (SANTINATO et al., 1996). The
TABLE 1 - Sunrise and sunset times, hour angle, sun declination, zenith angle, and solar azimuth for conilon coffee crop cultivated in North-South alignment in Boa Esperança, ES.
Date Sun Hours (h) Hour
Angle Declinationof the sun ZenithAngle Azimuth
Sunrise Sunset (h) (d) (Z) (a)
12/15/2016 05:59 19:14 45° 23,37° S 42,14° 75.33° - 255.33°
03/05/2017 05:41 18:04 45° 6,76° S 45,31° 99.02° - 279.02°
06/18/2017 06:12 17:13 45° 23,41° N 60,72° 48.07° - 228.07°
09/20/2017 05:32 17:37 45° 0,20° S 47,81° 107.38° - 287.38°
clouds are responsible for reflecting much of the incident solar radiation (FERREIRA et al., 2012).
It was observed that higher values of irradiance are associated with the 12/15/2016 data, whose zenith angle calculated for this day was the loWest (Table 1). This means that the position of the sun in relation to the vertical plane locality is also smaller, and consequently, there is reduction of the obliquity of the solar rays, thus increasing the incident solar radiation. The opposite occurs with the data obtained on 06/18/2017, where the zenith angle is higher, and the position of the sun in relation to the zenith is also larger, thus increasing the obliquity of the solar rays and, as a result, the reduction of incident solar radiation.
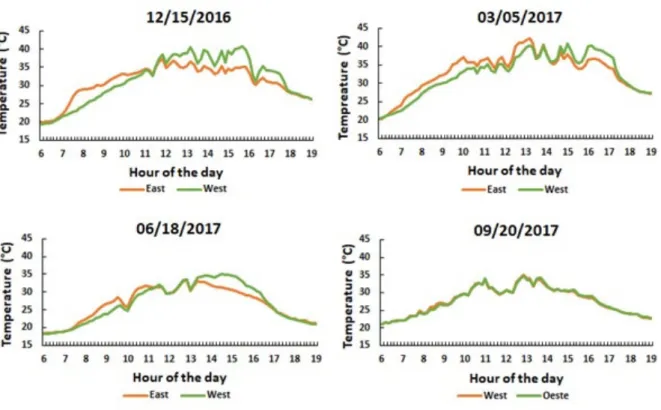
In the morning, the highest average temperatures were obtained on the side of the plant facing East on dates 12/15/16, 03/05/17, and 6/18/17 because it is the side that heats up faster due to solar radiation direct. By contrast, the face of the plant oriented to the West is heated more slowly by indirect solar radiation in the morning (Figure 2).
In the afternoon, the Eastern side begins the cooling process as solar radiation is directly incident on the side of the plant facing West, causing shading on the East side and results in milder temperatures.
Note that for the dates 12/15/16, 03/05/17, and 6/18/17, the highest values of average temperatures reached were observed in the afternoon. This can be explained by the fact that the East side receives the sunlight with less intensity in the morning because they need to travel a greater distance to reach the terrestrial surface. At noon, the sun is at the zenith, being a time when the obliquity of the sun rays is zero. As a result, the thickness of the atmosphere to be crossed is smaller, thus the highest intensity of solar radiation occurs and promotes high temperatures at this time (FERREIRA et al., 2012).
FIGURE 1 - Average daily irradiance for four dates (12/15/2016, 03/05/2017, 06/18/2017, and 09/20/2017) on a conilon coffee plant established in the North-South alignment in Boa Esperança, ES.
FIGURE 2 - Daily average temperature for four dates (12/15/2016, 03/05/2017, 06/18/2017, and 09/20/2017) on a conilon coffee plant planted in the North-South alignment in Boa Esperança, ES.
In the afternoon, the effect is similar to that of the morning, but there is still heat on the surface of the earth as a result of solar heating, thus promoting higher average temperatures in the afternoon.
These results described above were observed in all dates except for 09/20/2017, where both the East and West sides showed similar average temperatures in the morning and afternoon. Possibly, this behavior is attributed to the appearance of clouds, which is responsible for obtaining milder temperatures.
A mean temperature difference between the two sides of 5°C was observed at approximately 16 hours, whereas in the morning, this difference was less expressive. In addition, the values of temperatures are numerically smaller in the morning when compared with the afternoon period. Due to these results, it is suggested that the highest thermal stress of this plant occurs on the West side in the afternoon, since high average temperatures of approximately 42°C were recorded.
High temperature can cause damage to photosynthetic machinery due to protein denaturation and increased membrane permeability of chloroplasts (DUSENGE et al., 2018). In fact, at 42ºC coffee presents a reduction in the photosynthetic rates associated with photochemical damage, as well as a reduction in the activity of key enzymes from the Calvin cycle (RODRIGUES et al., 2016b). However, the coffee plants of the present study were subjected to 42°C for a short period of time, and the average temperature throughout the day was about 29°C, i.e., below the maximum average temperature threshold reported by Partelli et al. (2013) as suitable for the conilon coffee.
Recent studies suggest that conilon coffee plants did not present damage to the photochemical apparatus up to 37-30ºC day/night over a long period of exposure (RODRIGUES et al., 2016b), mainly through an increase in enzymatic and non-enzymatic antioxidant compounds and by means of protective proteins (MARTINS et al., 2016).
The high temperature can compromise the filling of the grains and anticipate the development of the fruit, which will result in premature ripening with fragile fruits, which will consequently affect the quality of the beverage (DAMATTA et al., 2012; DAMATTA et al., 2018). However, high temperatures in the final stages of maturation may not significantly lower the quality of the beverage, as observed for C. arabica cv. Icatú by Ramalho et al. (2018).
In relation to the vapor pressure deficit, as this depends inversely on the relative humidity and directly on the air temperature, the VPD followed a pattern similar to that of the temperature in the four dates evaluated in this work (Figure 3).
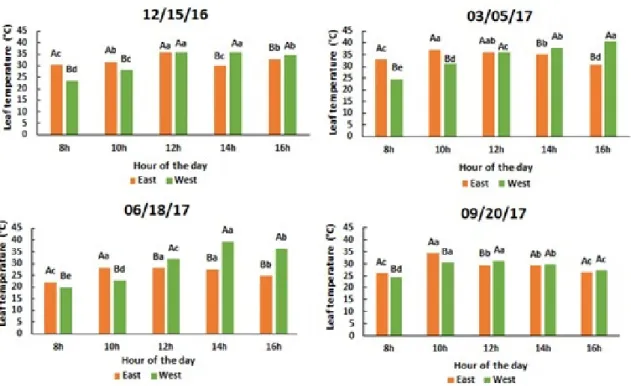
There was interaction between the hour and side of the plant factors for the leaf temperature variable on 12/15, in which the highest averages were observed at 8:00 and 10:00 on the East side and at 14:00 and 16:00 on the West side (Figure 4). Comparing the five schedules in relation to the East side of the plant, the highest significant mean was observed at 12:00, and for the West side, it was at 12:00 and 14:00. This can be explained by the fact that these times correspond to the incidence of direct solar radiation on the sides of the plant that obtained the highest values.
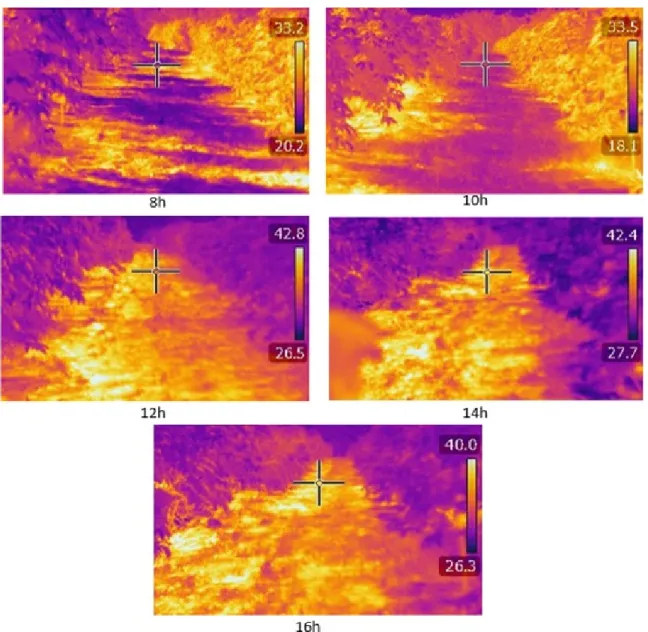
Figure 5 illustrates this difference between the five schedules for 12/15. On 03/05, the differences between the two sides of the plant were observed in the five schedules evaluated, where the highest averages correspond to 8:00 and 10:00 on the East side and at 14:00 and 16:00 on the West side. Comparing the five schedules in relation to the Eastern side of the plant, the highest significant mean was observed at 10:00 and 12:00, and for the West side, it was 16:00. On 06/18, differences were observed between the two sides of the plant in the five evaluated schedules, where the highest averages correspond to 8:00 and 10:00 on the East side and 12:00, 14:00 and 16:00the West side. Comparing the five schedules in relation to the East side of the plant, the highest significant mean was observed at 10:00, 12:00 and 14:00, and on the West side, it was 14:00. On day 09/20, a difference was observed for leaf temperature only for the first three schedules, where at 8:00 and 10:00, the highest averages corresponded to the East side of the plant and, at 12:00, corresponded to the West side. Comparing the five schedules in relation to the East side of the plant, the highest average was observed at 10:00, and for the West, it was at 10:00 and 12:00. Possibly, this behavior is attributed to the appearance of clouds that contributed to milder temperatures on both sides of the plant.
The values found for leaf temperature follow the trend the air temperature behavior showed previously. The morning period had the loWest averages for the East side of the plant, and the larger ones for the West side were in the afternoon, reaching average difference of up to 12°C between the two sides at 14:00 and 16:00.
FIGURE 3 - Daily Vapor Pressure Deficit for four dates (12/15/2016, 03/05/2017, 06/18/2017, and 09/20/2017) on a conilon coffee plant planted in North-South alignment, in Boa Esperança, ES.
FIGURE 4 - Average leaf temperature during five hours of the day (plots) on two sides of the plant (subplots) for four seasons of the year in a conilon coffee crop cultivated in the North-South alignment in Boa Esperança, State of São Paulo. CV (%): Parcel 12/15 = 2.56%; Subpart 12/15 = 2.31%; Parcel 03/05 = 2.96%; Subpart 03/05 = 2.19%; Parcel 06/18 = 2.62%; Subpart 06/18 = 1.93%; Parcel 09/20 = 2.71%; Subpart 09/20 = 2.15%. Means followed by the same letters, within the same hours, and lower case, comparing the five schedules inside each plant side, do not differ among themselves by the Tukey test at 5% probability.
The highest leaf temperatures correspond to the times with the highest incidence of direct solar radiation on the respective sides of the plant. In addition, the increase in leaf temperature coincides with increases in air VPD. This is because coffee can reduce stomatal conductance due to increased air VPD (RODRIGUES et al., 2016a, RODRIGUES et al., 2018). In this work, values above 2 kPa have been found for most of the day, that is, values well above the maximum limit reported for coffee (BARROS et al., 1997; RODRIGUES et al., 2016a). Since transpiration rate contributes to leaf cooling through latent heat loss (NOBEL, 2009), stomatal closure results
FIGURE 5 - Thermal image of the conilon coffee crop illustrating the East (right) and West (left) sides of the plant at five times of the day on 12/15 in a conilon coffee crop cultivated in the North-South alignment in Boa Esperança, ES.
in increased leaf temperature, which probably occurred at warmer times when air VPD was above 2 kPa.
The lengths of the plagiotropic and orthotropic branches, number of nodes per plagiotropic branch, and distance between plagiotropic branches were not influenced by the treatments of East or West exposure (Figure 6). Therefore, the most unfavorable microclimate in the hotter hours of the West side was not enough to affect the growth of the coffee. This was probably due to the similar absorption of nutrients on both sides of the plant (Table 2).
FIGURE 6 - Growth of the plagiotropic branch (A), Growth of orthotropic Branches (B), number of nodes per plagiotropic Branch (C), and plagiotropic Branch Length (D) of the conilon coffee tree grown in North-South alignment in Good Hope, ES. CV (%): A: 14.03%, B: 20.07%, C: 8.79%, and D: 10.34%.
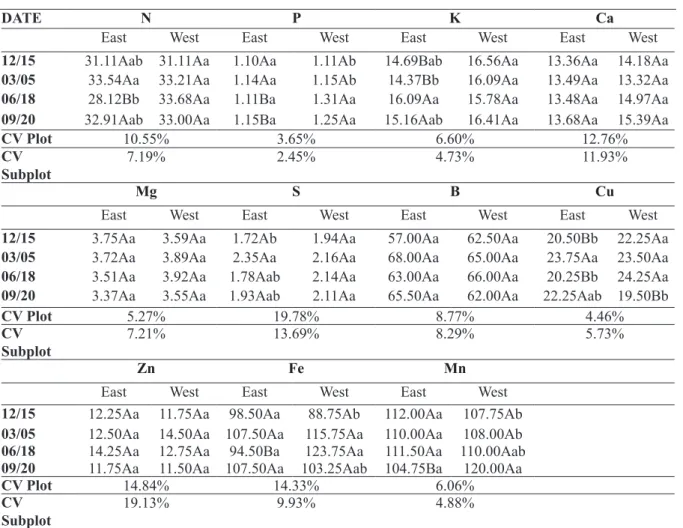
TABLE 2 - Mean of macronutrient concentrations (g kg-1) for N, P, K, Ca, Mg, and S and micronutrients (g kg-1) B, Cu, Zn, Fe, and Mn on the four dates evaluated (plots) and on both sides of the plant (subplots) in a conilon coffee crop cultivated in the North-South alignment in Boa Esperança, ES.
DATE N P K Ca
East West East West East West East West
12/15 31.11Aab 31.11Aa 1.10Aa 1.11Ab 14.69Bab 16.56Aa 13.36Aa 14.18Aa 03/05 33.54Aa 33.21Aa 1.14Aa 1.15Ab 14.37Bb 16.09Aa 13.49Aa 13.32Aa 06/18 28.12Bb 33.68Aa 1.11Ba 1.31Aa 16.09Aa 15.78Aa 13.48Aa 14.97Aa 09/20 32.91Aab 33.00Aa 1.15Ba 1.25Aa 15.16Aab 16.41Aa 13.68Aa 15.39Aa
CV Plot 10.55% 3.65% 6.60% 12.76%
CV
Subplot 7.19% 2.45% 4.73% 11.93%
Mg S B Cu
East West East West East West East West
12/15 3.75Aa 3.59Aa 1.72Ab 1.94Aa 57.00Aa 62.50Aa 20.50Bb 22.25Aa 03/05 3.72Aa 3.89Aa 2.35Aa 2.16Aa 68.00Aa 65.00Aa 23.75Aa 23.50Aa 06/18 3.51Aa 3.92Aa 1.78Aab 2.14Aa 63.00Aa 66.00Aa 20.25Bb 24.25Aa 09/20 3.37Aa 3.55Aa 1.93Aab 2.11Aa 65.50Aa 62.00Aa 22.25Aab 19.50Bb
CV Plot 5.27% 19.78% 8.77% 4.46%
CV
Subplot 7.21% 13.69% 8.29% 5.73%
Zn Fe Mn
East West East West East West
12/15 12.25Aa 11.75Aa 98.50Aa 88.75Ab 112.00Aa 107.75Ab 03/05 12.50Aa 14.50Aa 107.50Aa 115.75Aa 110.00Aa 108.00Ab 06/18 14.25Aa 12.75Aa 94.50Ba 123.75Aa 111.50Aa 110.00Aab 09/20 11.75Aa 11.50Aa 107.50Aa 103.25Aab 104.75Ba 120.00Aa
CV Plot 14.84% 14.33% 6.06%
CV
Among the analyzed macronutrients, the Ca and Mg leaf concentration was not influenced by the interaction of the following factors: evaluation dates and plant sides (East and West). The same occurred for B and Zn, which characterize the micronutrients (Table 2). The nutrient S was similar between the two sides of the plant however, it was different in the four evaluated dates with respect to the East side.
On 12/15, only the K and Cu presented differences between the sides of the plant, both with higher values in the side of the plant facing towards the West. As of 03/05, no nutrients were influenced by the exposure side of the plant. On 6/18, N, P, Cu, and Fe were higher on the West side of the plant. At 09/20, the leaf concentration of P was higher on the West side, while the concentrations of N, Cu, and Fe were higher on the North side.
Means followed by the same capital letters in rows or lowercase in columns do not differ among themselves by the Tukey test at 5% probability.
For the nutrients that had a significant difference between the two sides, the highest averages were observed on the West side of the plant, except for Cu, which had the highest average on the East side on 09/20. The West side of the plant is the face that directly receives the radiation coming from the afternoon sun, so it intercepts the highest solar radiation intensities and, consequently, it has the highest averages for air and leaf temperature, as well as vapor pressure deficit. In spite of the observed differences, the values of the nutrients found in this work are within the range considered adequate for the coffee tree (PARTELLI et al., 2016) so that there were no differences in the growth variables evaluated.
4 CONCLUSIONS
The West side of the plant presents higher values of irradiance, temperature, and vapor pressure deficit in the afternoon, reaching air temperature differences of up to 5°C in relation to the East side. Leaf temperature has similar behavior to air temperature, reaching differences of approximately 12°C between the two sides of the plant in the afternoon. The growth of the plagiotropic branches is not affected by the plant face of exposure (East or West). On both sides of the plant, macro and micronutrients were kept within the range considered suitable for coffee plants.
5 ACKNOWLEGEMENTS
This work was carried out with the support of the Coordenação de Aperfeiçoamento de Pessoal de Nível Superior - Brasil (CAPES) - Financing Code 001. It also had the support of the Federal University of Espírito Santo and the rural producers José Paulo Ferrari and Jocemar da Silva Campos who provided the experimental area.
Funding from FAPERJ (grants
E-26/202.323/2017, W.P.R.) and CNPq (grants 304687/2017-0, F.L.P.) are also gratefully acknowledged.
6 REFERENCES
ANGELOCCI, L. R.; MARIN, F. R.; PILAU, F. G.; RIGHI, E. Z.; FAVARIN, J. L. Radiation balance of coffee hedgerows. Revista Brasileira de Engenharia Agrícola e Ambiental, v. 12, n. 3, p. 274-281, 2008. ALVARES, C. A.; STAPE, J. L.; SENTELHAS, P. C.; GONÇALVES, J. L. M.; SPAROVEK, G. Köppen’s climate classification map for Brazil. Meteorologische Zeitschrift, v. 22, p. 711-728, 2013.
BARROS, R.; MOTA, J.W.S.; DAMATTA, F. M.; MAESTRI, M. Decline of vegetative growth in Coffea arabica L. in relation to leaf temperature: water potential and stomatal conductance. Field Crops Research, v. 54, p. 65–72, 1997.
CONAB. Companhia Nacional de Abastecimento. In Acompanhamento da safra brasileira: Café. Brasília: CONAB, v.4, n.4, 2017. 84p. Retrieved January 30, 2019, from http///D:/Perfil/Downloads/ BoletimZCafeZjaneiroZ2019%20(2).pdf> .
CUNHA, A.R.; VOLPE, C.A.
Curvas decrescimento do fruto de cafeeiro cv. Obatã IAC 1669-20 em diferentes alinhamentos de plantio. Ciências Agrárias, v. 32, n. 1, p. 49-62, 2011.
CRAPARO, A. C. W.; STEPPE, K.; VAN ASTEN, P. J. A.; LÄDERACH, P.; JASSOGNE, L. T. P.; GRAB, S. W. Application of thermography for monitoring stomatal conductance of Coffea arabica under different shading systems. Science of the Total Environment, v. 609, p. 755-763, 2017.
CRUZ, C.D. Genes - a software package for analysis in experimental statistics and quantitative genetics. Acta Scientiarum Agronomy, v. 35, p. 271-276, 2013. DAMATTA, F. M.; RAMALHO, J. D. C. Impacts of drought and temperature stress on coffee physiology and production: a review. Brazilian Journal of Plant Physiology, v. 18, n. 1, 55-81, 2006.
DAMATTA, F. M.; CAVATTE, P. C.; MARTINS, S. C. V. Coffee physiology: growth, yield and quality. In: Oberthur, T.; Laderach, P.; Jurgen Pohlan, H. A.; Cock, J. H. (Ed.). Specialty Coffee: Managing Quality. Norcross: International Plant Nutrition Institute, 2012. p. 75-91.
DAMATTA, F. M.; AVILA, R. T.; CARDOSO, A. A.; MARTINS, S. C. V.; RAMALHO, J. C. Physiological and agronomic performance of the coffee crop in the context of climate change and global warming: A Review. Journal of Agricutural and Food Chemistry, v. 66, p. 5264−5274, 2018.
DUSENGE, M. E.; DUARTE, A. G.; WAY, D. A. (2018). Plant carbon metabolism and climate change: elevated CO2 and temperature impacts on photosynthesis, photorespiration and respiration. New Phytologist, v. 221, p. 32-49, 2018.
FERREIRA, W. P. M., RIBEIRO, M. F., FERNANDES FILHO, E. I., SOUZA, C. F., CASTRO, C. C. R. (2012). As características térmicas das faces noruega e soalheira como fatores determinantes do clima para a cafeicultura de montanha. Brasília, DF: Embrapa Café, 2012, 34p.
ICO. International Coffee Organization. Dados históricos. . Retrieved January 30, 2019, from http:// www.ico.org/prices/po-production.pdf>.
MARTINS, L. D.; TOMAZ, M. A.; LIDON, F. C.; DAMATTA, F. M.; RAMALHO, J. C. (2014). Combined effects of elevated [CO2] and high temperature on leaf mineral balance in Coffea spp. plants. Climate Change, v. 126, p. 365–379, 2014. NOBEL, P. S. Physicochemical and Environmental Plant Physiology. 4 ed. Amsterdam: Academic Press, 2009, 582p.
OLIVEIRA, K. M. G.; CARVALHO, L. G., LIMA, L. A.; GOMES, R. C. C. Modelagem para a estimativa da orientação de linhas de plantio de cafeeiros. Engenharia Agrícola, v. 32, n. 2, p. 293-305, 2012. PARTELLI, F. L.; VIEIRA, H. D.; SILVA, M. G.; RAMALHO, J. C. Seasonal vegetative growth of different age branches of conilon coffee tree. Semina: Ciências Agrárias, v. 31, p. 619-626, 2010.
PARTELLI, F. L.; MARRÉ, W. B.; FALQUETO, A. R;, VIEIRA, H. D.; CAVATTE, P. C. Seasonal vegetative growth in genotypes of Coffea canephora, as related to
climatic factors. Journal of Agricultural Science, v. 5, p. 108-116, 2013.
PARTELLI, F. L.; ARAÚJO, A. V.; VIEIRA, H. D.; DIAS, J. R. M.; MENEZES, L. F. T.; RAMALHO, J. C. Microclimate and development of ‘Conilon’ coffee intercropped with rubber trees. Pesquisa Agropecuária Brasileira, v. 49, n. 11, p. 872-88, 2014.
PARTELLI, F. L.; GOMES, W. R.; OLIVEIRA, M. G.; DIAS, J. R. M.; ESPINDOLA, M. C. Normas foliares e diagnóstico nutricional do cafeeiro conilon na pré-florada e granação, no Espírito Santo. Coffee Science, v. 11, p. 544-554, 2016.
RAMALHO, J. C.; CAMPOS, P. S.; TEIXEIRA, M.; NUNES, M. A. Nitrogen dependent changes in antioxidant systems and in fatty acid composition of chloroplast membranes from Coffea arabica L. plants submitted to high irradiance. Plant Science, v. 135, n. 2, p. 115-124, 1998.
RAMALHO, J. C.; PAIS, I. P.; LEITÃO, A. E.; GUERRA, M.; REBOREDO, F. H.; MÁGUAS, C. M.; CARVALHO, M. I.; SCOTTI-CAMPOS, P.; RIBEIRO-BARROS, A. A.; LIDON, F.C.; DAMATTA, F. M. Can elevated air [CO2] Conditions mitigate the predicted warming impact on the quality of coffee bean? Frontiers in Plant Science, v. 9, p. 287, 2018.
RODRIGUES, W. P.; MARTINS, M. Q.; FORTUNATO, A. S.; RODRIGUES, A. P.; SEMEDO, J. N.; SIMÕES-COSTA, M. C.; PAIS, I. P.; LEITÃO, A. E.; COLWELL, F.; GOULAO, L.; MÁGUAS, C.; MAIA, R.; PARTELLI, F. L.; CAMPOSTRINI, E.; SCOTTI-CAMPOS, P.; RIBEIRO-BARROS, A. I.; LIDON, F. C.; DAMATTA, F. M.; RAMALHO, J. C. Long-term elevated air [CO2] strengthens photosynthetic functioning and mitigates the impact of supra-optimal temperatures in tropical Coffea arabica and C. canephora species. Global Change Biology, v. 22, p. 415–431, 2016a.
RODRIGUES, W. P.; MACHADO-FILHO, J. A.; FIGUEIREDO, F. A. M. M. A.; FERRAZ, M. T.; SILVA, J. R.; FERREIRA, L. S.; BEZERRA, L. S.; ABREU, D. P.; BERNADO, W. P.; CESPOM, L.; FERNANDES, E. S.; GLENN, D. M.; RAMALHO, J. C.; CAMPOSTRINI, E. Whole-canopy gas exchange in Coffea sp. is affected by supra-optimal temperature and light distribution within the canopy: the insights from an improved multi-chamber system. Scientia Horticulturae, v. 211, p. 194–202, 2016b.
RODRIGUES, W. P.; SILVA, J. R.; FERREIRA, L. S.; MACHADO-FILHO, J. A.; FIGUEIREDO, F. A. M. M. A.; FERRAZ, M. T.; BERNADO, W. P.; BEZERRA, L. S.; ABREU, D. P.; CESPOM, L.; FERNANDES, E. S.; RAMALHO, J. C.; CAMPOSTRINI, E. (2018) Stomatal and photochemical limitations of photosynthesis in coffee (Coffea spp.) plants subjected to elevated temperatures. Crop and Pasture Science, v. 69, p. 317-325, 2018.
SANTINATO, R.; FERNANDES, A. L. T.; FERNANDES, D. R. Irrigação na cultura do café. 1 ed. Campinas: Arbore, 1996, 146p.
SILVA, F.C. Manual de análises químicas de solos, plantas e fertilizantes. 2 ed. Rio de Janeiro: Embrapa Solos, 2009. 627p.
TETENS, V.O. Über einige meteorologische Begriffe. Zeitschrift Geophysic, v. 6, p. 297-309, 1930.