Liane Pereira de Meneses
Bachelor degree in Biomedical Sciences
Evaluation of sub-, supercritical fluids as solvents
for extraction and impregnation of
polyhydroxyalkanoates
Dissertation for the degree of Master in Biotechnology
Supervisor: Doctor Alexandre Babo de Almeida Paiva,
LAQV-REQUIMTE, FCT-UNL
Co-supervisor: Doctor Maria Filomena Andrade de Freitas,
UCIBIO-REQUIMTE, FCT-UNL
Jury President: Professor Carlos Alberto Gomes Salgueiro Examiner: Doctor Joana Oliveira Pais Vogal: Doctor Alexandre Babo de Almeida Paiva
iii
Liane Pereira de Meneses
Bachelor degree in Biomedical Sciences
Evaluation of sub-, supercritical fluids as solvents for
extraction and impregnation of polyhydroxyalkanoates
Dissertation for the Degree of Master in Biotechnology
Supervisor: Doctor Alexandre Babo de Almeida Paiva, LAQV-REQUIMTE, FCT-UNL Co-supervisor: Doctor Maria Filomena de Andrade Freitas, UCIBIO-REQUIMTE, FCT-UNL
JURY
President: Professor Carlos Alberto Gomes Salgueiro Examiner: Doctor Joana Oliveira Pais
Vogal: Doctor Alexandre Babo de Almeida Paiva
v Evaluation of sub-, supercritical fluids as solvents for extraction and impregnation of
polyhydroxyalkanoates
Copyright © Liane Pereira de Meneses, Faculdade de Ciências e Tecnologia, Universidade Nova de Lisboa
vii
ix
Agradecimentos
Primeiro que tudo agradeço à Professora Susana Barreiros e à Professora Maria Ascensão Reis por me terem recebido nos seus laboratórios e me darem a oportunidade de crescer como profissional ao longo deste ano.
Aos meus orientadores, Alexandre Paiva e Filomena Freitas agradeço toda a paciência que tiveram comigo, tudo aquilo que me ensinaram e todo o entusiasmo que sempre mostraram e que me encorajou a levar este trabalho adiante. Obrigada por acreditarem em mim e no meu trabalho. O vosso apoio foi fundamental para terminar esta etapa.
Agradeço ao Dr. Christian Grandfils pela realização de parte da caracterização dos polímeros estudados neste trabalho, à Professora Alexandra Fernandes por me ter recebido no seu laboratório e à Dr.ª Catarina Rodrigues pela ajuda na realização dos testes de viabilidade celular.
Francisca, Bruno, Rita, Diana e João muito obrigada por me ensinarem os truques e desenrasques para uma vida no laboratório, pelas palavras de conforto ao fim de um dia desesperante e pelo vosso carinho e amizade!
Sara e Mário, este ano foi fantástico graças a vocês os dois. A vossa amizade foi, sem dúvida, uma mais valia nos dias mais cinzentos. Rita, Juliana, Eliana, Vânia obrigada pelos momentos de sanidade mental no meio desta loucura. Maria, Marta, Lisandra, Filipe obrigada por me mostrarem que o longe é perto e que para isso basta querer. Às sete pessoas maravilhosas que Aveiro deixou no meu caminho e no meu coração, obrigada por ao longo deste ano continuarem a trazer gargalhadas aos meus dias! A vida é mais fácil quando temos amigos e todos vocês são a prova disso.
À minha mãe e ao meu pai, pilares daquilo que sou hoje, agradeço o amor, o carinho e a força que sempre me deram para seguir os meus sonhos sem nunca baixar os braços. Obrigada é pouco para tudo o que fizeram e, constantemente, fazem por mim.
Não posso deixar de agradecer à família que sempre me apoiou mesmo sabendo que “esta vai
xi
Abstract
Polyhydroxyalkanoates (PHA) are a class of biobased and biodegradable polymers with potential application on different areas, depending on their composition and specific properties that range from thermoplastics to elastomers. However, PHA development is still limited by several factors, including its extraction procedures that rely on organic solvents, such as chloroform. On the other hand, it is important to develop applications of the polymers that further increase their commercial value.
This work included two parts: (1) the use of hot compressed water (HCW) as an eco-friendly solvent for the pre-treatment of mixed microbial culture (MMC) biomass for the extraction of poly-(3-hydroxybutyrate-co-3-hydroxyvalerate) (P(3HB-co-3HV)); (2) production of
medium-chain-length PHA (mcl-PHA) and its impregnation with ibuprofen using supercritical carbon dioxide
(sc-CO2).
The results showed that using HCW at 150 °C, with a water flow rate of 10 mL/min during 30 min, it was possible to increase the polymer content of the samples from 66% to 77%. To further purify the obtained samples, a combination of HCW with digestion of the cellular residues with hypochlorite was experimented. With the combination of the two methods it was possible to decrease the hypochlorite concentration five times than when using only the hypochlorite step, while obtaining a higher purity of 82%. The main problem of applying the HCW step was the decrease of the molecular weight (Mw) from 3.0x10⁵ to 0.3x10⁵ g/mol and the increase of the
polydispersity index.
Bioreactor fermentation of Pseudomonas chlororaphis was performed to obtain mcl-PHA, using
glycerol as carbon source. Besides PHA, two other products were obtained, namely, an exopolysaccharide (EPS) and phenazine. The mcl-PHA had a crystallinity of 13%, melting
temperature (Tm) of 44.6 °C, glass transition temperature (Tg) of -50.4 °C and a Mw of 1.3x10⁵
g/mol, which are in accordance to what is said in literature.
sc-CO2 was used to impregnate ibuprofen in the mcl-PHA. The maximum impregnation yield
obtained was 93.3 mg/g (at 200 bar for 3 h at 40 °C). The controlled release tests showed that the ibuprofen is released from the mcl-PHA with a controlled profile.
Keywords
Polyhydroxyalkanoates; Hot Compressed Water; Purification; Pseudomonas chlororaphis;
xiii
Resumo
Os polihidroxialcanoatos (PHA) pertencem ao grupo dos polímeros biodegradáveis de origem biológica com aplicação nas mais diversas áreas de acordo com a sua composição e características específicas que variam desde termoplásticos a elastómeros. Contudo, o desenvolvimento dos PHA continua limitado por diversos fatores incluindo os processos para a sua extração que utilizam solventes orgânicos, como é o caso do clorofórmio. É também importante desenvolver aplicações para os polímeros que aumentem o seu valor comercial.
Este trabalho incluiu duas partes: (1) a aplicação de água subcrítica como solvente verde no pré-tratamento de biomassa de culturas mistas para a extração de poli-(3-hidroxibutirato-co
-3-hidroxivalerato) (P(3HB-co-3HV)); (2) a produção de um PHA de cadeia média (mcl-PHA) e sua
impregnação com ibuprofeno usando dióxido de carbono supercrítico (sc-CO2).
Os resultados obtidos mostraram que utilizando água subcrítica a 150 °C com um caudal de água de 10 mL/min, durante 30 min foi possível aumentar o conteúdo em PHA da amostra de 66% para 77%. De forma a tentar obter um polímero puro combinou-se o método da água subcrítica com uma extração com hipoclorito. A combinação dos dois métodos permitiu usar cinco vezes menos hipoclorito do que quando se usa apenas a extração com hipoclorito, obtendo um polímero com 82% de pureza. A maior desvantagem da combinação dos dois métodos foi a diminuição que provocam no peso molecular do polímero, de 3.0x10⁵ para 0.3x10⁵ g/mol e a
diminuição do índice de polidispersão.
Fez-se uma fermentação em biorreator de Pseudomonas chlororaphis a partir de glicerol para
obter mcl-PHA. Para além do PHA obteve-se outros dois produtos, sendo eles exopolissacarídeo
(EPS) e fenazinas. O mcl-PHA apresenta cristalinidade de 13 %, temperatura de fusão de 44.6
°C, temperatura de transição vítrea de -50.4 °C e um peso molecular de 1.3x10⁵ g/mol, valores
que estão de acordo com o que está descrito na literatura.
Usou-se sc-CO2 para impregnar ibuprofeno no mcl-PHA atingindo-se um rendimento máximo de
impregnação de 93.3 mg/g (a 200 bar durante 3 h a 40 °C). Os testes de libertação controlada permitiram verificar que a libertação do ibuprofeno do mcl-PHA apresenta um perfil característico
de libertação controlada.
Palavras chave
Polihidroxialcanoatos; Água Subcrítica; Purificação; Pseudomonas chlororaphis; Dióxido de
xv
Contents
1 INTRODUCTION AND MOTIVATION ... 1
1.1 PLASTICS ... 3
1.2 BIOPLASTICS ... 4
1.3 POLYHYDROXYALKANOATES ... 6
1.3.1 Short-chain-length PHA ... 8
1.3.2 Medium-chain-length PHA ... 8
1.4 EXTRACTION METHODS ... 9
1.5 SUPERCRITICAL FLUIDS ... 11
1.5.1 Sub and supercritical Water ... 12
1.5.2 Supercritical Carbon Dioxide ... 13
1.6 MOTIVATION ... 14
2 P(3HB-CO-3HV) EXTRACTION USING HOT COMPRESSED WATER AS PRE-TREATMENT ... 15
2.1 INTRODUCTION ... 17
2.2 MATERIALS AND METHODS ... 19
2.2.1 PHA production ... 19
2.2.2 PHA extraction ... 19
2.2.3 PHA treatment with HCW ... 20
2.2.4 PHA purification with hypochlorite ... 21
2.2.5 PHA Characterisation ... 22
2.3 RESULTS AND DISCUSSION ... 23
2.3.1 PHA characterisation ... 23
2.3.2 PHA treatment with HCW ... 25
2.3.3 Extraction of PHA from HCW treated biomass using hypochlorite ... 28
2.4 CONCLUSIONS AND FUTURE WORK ... 30
3 BIOREACTOR PRODUCTION AND PRODUCTS CHARACTERISATION... 31
3.1 INTRODUCTION ... 33
3.2 MATERIALS AND METHODS ... 35
3.2.1 Bacterial strain and cultivation media ... 35
3.2.2 Inocula preparation ... 35
3.2.3 Fed-batch bioreactor fermentation ... 35
3.2.4 Analytical techniques ... 36
3.2.5 Calculus ... 38
3.2.6 PHA Extraction and purification... 38
3.2.7 PHA Characterisation ... 38
3.3 RESULTS AND DISCUSSION ... 40
3.3.1 Bioreactor cultivation of P. chlororaphis ... 40
3.3.2 Optimisation of bioreactor cultivation conditions of P. chlororaphis ... 45
3.3.3 Characterisation of PHA accumulated by P. chlororaphis ... 47
3.3.4 Characterisation of the EPS produced by P. chlororaphis ... 50
3.4 CONCLUSIONS AND FUTURE WORK ... 51
4 MCL-PHA IMPREGNATION WITH IBUPROFEN USING SC-CO2 ... 53
4.1 INTRODUCTION ... 55
4.2 MATERIALS AND METHODS ... 57
4.2.1 PHA extraction ... 57
4.2.2 Evaluation of PHA cytotoxicity... 57
4.2.3 Ibuprofen preparation ... 57
4.2.4 Supercritical Fluid Impregnation ... 58
4.2.5 PBS preparation ... 58
xvi
4.3 RESULTS AND DISCUSSION ... 59
4.3.1 Evaluation of mcl-PHA cytotoxicity ... 59
4.3.2 Impregnation of mcl-PHA with sc-CO2 ... 61
4.3.3 Ibuprofen Controlled Release Tests ... 62
4.4 CONCLUSIONS AND FUTURE WORK ... 63
5 REFERENCES ... 65
xvii
List of figures
Figure 1.1 – Evolution of World (■+■) and Europe (■) plastics production over the last 10 years. The entire bar represents world production and the lighter part represents only the European production. Data from Europe is related to EU 28 State Members plus Norway and Switzerland. Adpated from Plastics Europe, 2016. ... 3
Figure 1.2 – Representation of the different families of plastics either conventional plastics and bioplastics. The green shadow shows biobased plastics, the blue shadow shows biodegradable and the part where they overlap shows the biobased and biodegradable plastics. Retrieved from European Bioplastics, 2013. ... 4
Figure 1.3 – Global production capacity of bioplastics in 2016. Retrieved from European Bioplastics, 2016. ... 5
Figure 1.4 – (A) Bacterial cell with PHA granules (Madkour et al., 2013). (B) General PHA structure where R represents the side chain of the monomer and n represents the number of carbon atoms on the main chain (Anjum et al., 2016). ... 6
Figure 1.5– Phase diagram of a pure substance. Retrieved from Duarte et al., 2009. ... 11
Figure 1.6 – Phase diagram of water as function of pressure (atm) and temperature (°C). Triple point (tp), boiling point (bp) and critical point are pointed out and subcritical region is indicated (Asl and Khajenoori, 2013). ... 12
Figure 2.1- Properties of water at high pressure (25 MPa) and high temperature. The properties shown are: Dielectric constant (ɛ), Density (ρ) and Ionic Product (IP) (Kruse and Dinjus, 2007).
... 17
Figure 2.2 – Schematic representation of the HCW apparatus. PI represents the pressure indicators and TI represents the temperature indicators. ... 20
Figure 2.3 – Heating profile of the HCW system (line) of an extraction with final temperature of 150 °C and biomass loss in the reactor during the different heating phases (bars represent the biomass that remained in the reactor). ... 25
Figure 2.4 - Pictures of the P(3HB-co-3HV) obtained after the HCW hydrolysis of biomass. A –
HCW 150 °C; B – HCW 165 °C; C – HCW 180 °C. ... 27
Figure 3.1 –Cultivation profile of P. chlororaphis during the first experiment. (A) CDW (■) and
glycerol concentration (●); (B) production of PHA (x) and EPS (♦). ... 40
Figure 3.2 – Visualisation of the P. chlororaphis cells under the optical microscope (100x) at 48 h
of cultivation, under phase contrast (A) and with fluorescence (B) after Nile Blue staining. ... 41
Figure 3.3 – Pictures of the bioreactor with P. chlororaphis culture: (A) was taken after the
inoculation and (B) was taken after 24 hours. ... 43
Figure 3.4 - Phenazines production profile (▲) along with the P. chlororaphis growth (■) during
the cultivation time of the first reactor performed. ... 44
Figure 3.5 - Cultivation profile of P. chlororaphis during the second experiment. (A) CDW (■) and
xviii Figure 3.6 – X-ray diffractogram of two samples of the mcl-PHA produced by P. chlororaphis from
glycerol. The blue line corresponds to the purified sample and the yellow line corresponds to the unpurified sample. ... 49
Figure 3.7 – Chromatogram of the EPS produced by P. chlororaphis from glycerol. ... 50
Figure 4.1 – Schematic representation of the apparatus used for the impregnation assays. Retrieved from Martins et al., 2014. ... 58
Figure 4.2 – Pictures of both samples of mcl-PHA used for cell viability assays. (A) is the
unpurified sample and (B) is the purified sample. ... 59
Figure 4.3 –Cell viability of (A) Fibroblasts grown on DMEM and of (B) A2780 grown on RPMI in the presence of PHA with low concentrations of pigment (■) and PHA with high concentrations of pigment (■). ... 60
Figure 4.4 – Picture of the mcl-PHA recovered after an impregnation test performed at 200 bar
and 40 °C during 3 h. ... 61
Figure 4.5 – Ibuprofen release (mg) from mcl-PHA on medium simulating physiologic conditions
(PBS) over 24h. mcl-PHA was impregnated at two different pressures: 150 bar (■) and 200 bar
xix
List of tables
Table 1.1 – Major monomers in bacterial PHA (with n=1). Retrieved from Anjum et al., 2016. ... 7
Table 1.2 – Comparison between the physical properties of different scl-PHA and conventional
plastics (Anjum et al., 2016; Verlinden et al., 2007). ... 8
Table 1.3 – Comparison of costs, recovery yields, PHA purity and impact on PHA between some of the most common extraction processes. ... 10
Table 1.4 - Critical conditions of different solvents. Adapted from Mchugh and Krukonis, 1994. ... 11
Table 1.5 – Comparison between density (kg/m3), viscosity (cP) and diffusivity (mm2/s) of Gas,
SCF and Liquid. Retrieved from Nahar and Sarker, 2005. ... 13
Table 2.1 – Bleach concentrations used to extract PHA from samples previously treated with HCW. ... 21
Table 2.2 – Characterisation of the P(3HV-co-3HB) produced from waste apple pulp and extracted
from the original biomass by Soxhlet extraction with chloroform and with hypochlorite compared to examples from literature. The characterisation includes 3HV content of the PHA, thermal properties and molecular mass distribution (n.a. – not available). ... 24
Table 2.3 – Different conditions of time and temperature extraction with HCW performed and respective percentages of solubilised biomass and polymer content. The values of polymer content were calculated after Soxhlet extraction with chloroform. ... 26
Table 2.4 – Thermal properties, degree of crystallinity of the P(3HB-co-3HV) samples by
hypochlorite extraction of HCW treated biomass at 150 °C. The control sample was obtained by hypochlorite extraction of the untreated biomass. ... 29
Table 3.1 - Kinetic and stoichiometric parameters for both reactors performed in this study compared to examples of PHA production by other P. chlororaphis strains found in the literature.
(n.a. – not available; values with * where estimated based on the values given in the literature). ... 42
Table 3.2 – Monomeric composition of the mcl-PHA produced by P. chlororaphis from glycerol
and of other mcl-PHA produced by different bacterial strains found in literature. ... 47
Table 3.3 - Thermal properties, degree of crystallinity, Mw and PDI of the mcl-PHA produced by P. chlororaphis from glycerol and of other mcl-PHA produced by different bacterial strains found
xxi
List of abbreviations
3HD 3-hydroxydecanoate
3HDd 3-hydroxydodecanoate
3HHx 3-hydroxyhexanoate
3HO 3-hydroxyoctanoate
3HV 3-hydroxyvalerate
3HTd 3-hydroxytetradecanoate
CDW Cell Dry Weight
DSC Differential Scanning Calorimetry
EPS Exopolysaccharide
GC Gas Chromatography
HCW Hot Compressed Water
HPLC High Performance Liquid Chromatography
mcl-PHA Medium-Chain-Length Polyhydroxyalkanoates
Mn Average Molecular Number
MMC Mixed Microbial Culture
Mw Average Molecular Weight
NPCM Non-PHA Cell Mass
OD Optical Density
P(3HB) Poly-(3-hydroxybutyrate)
P(3HB-co-3HV) Poly-(3-hydroxybutyrate-co-3-hydrovalerate)
pc Critical Pressure
PDI Polydispersity Index
PE Polyethylene
PHA Polyhydroxyalkanoates
PP Polypropylene
QS Quorum Sensing
rpm Rotation Per Minute
sc-CO2 Supercritical Carbon Dioxide
SCF Supercritical Fluid
scl-PHA Short-Chain-Length Polyhydroxyalkanoates
SCW Supercritical Water
Tc Critical Temperature
xxii
Tg Glass Transition Temperature
TGA Thermogravimetric Analysis
Tm Melting Temperature
Xc Degree of Crystallinity
1
Chapter 1
____________________________________________________________________________Introduction and Motivation
3
1.1 Plastics
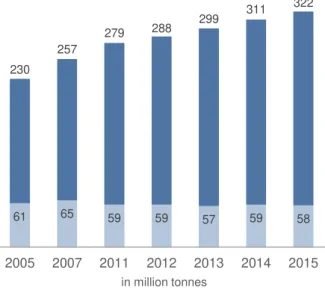
Plastics are present in almost everything we do in our daily routine. From home appliances to automobiles, everything is made of plastic. Plastics are widely used because they can be manipulated to whatever shape and strength wanted. Conventional plastics are produced as a by-product of the oil industry. Considering the European use of oil for its different applications, only 4 to 6% are directed to plastic materials production. Looking at Figure 1.1 it can be seen that from 2005 to 2015, the world plastic production has gradually increased, but at an European level the amount of plastics produced has been stable for several years (European Bioplastics, 2016).
Figure 1.1 – Evolution of World (
■
+■
) and Europe (■
) plastics production over the last 10 years. The entire bar represents world production and the lighter part represents only the European production. Data from Europe is related to EU 28 State Members plus Norway and Switzerland . Adpated from Plastics Europe, 2016.The main problem with plastics is their degradability, or on this case the lack of it. Plastics became one of the main pollutants on Earth, and they affect both land and seas. Back in 1960, plastics represented less than 0.5% of municipal solid waste on the United States; by 2010, this number had risen to 12.4% and only 8.2% of these plastics were recovered (Philp et al., 2013). About 40% of the produced plastics are disposed in landfills and as they are not biodegradable they accumulate in those areas. In addition to the plastics in landfills, there is a great percentage that is discarded into the marine environment, accumulating and comprising marine life (Reddy et al., 2003).
61 65 59 59 57 59 58
230 257
279 288 299
311 322
2005 2007 2011 2012 2013 2014 2015
4
1.2 Bioplastics
With the problems associated to conventional plastics, work was put on to develop new materials
with the appealing characteristics of plastics’ – Bioplastics.
Bioplastics can either be (1) biobased, when the product is derived from biomass (corn, sugarcane or cellulose); (2) biodegradable, when the plastic is degradable in the environment in a sustainable time frame; or (3) both, when the plastic fits in both categories (European Bioplastics, 2013). Examples of each of the groups of bioplastics can be seen in Figure 1.2. The category of biobased and biodegradable plastics includes polylactic acid (PLA), starch blends and polyhydroxyalkanoates (PHA). PHA have many interesting characteristics that can even compete in the market with some oil derived plastics, such as polyethylene (PE) and polypropylene (PP), since they resemble those plastics in their physical properties.
Figure 1.2 – Representation of the different families of plastics either conventional plastics and bioplastics. The green shadow shows biobased plastics, the blue shadow shows biodegradable and the part where they overlap shows the biobased and biodegradable plastics. Retrieved from European Bioplastics, 2013.
The increase on bioplastics’ production would mean increasing resource efficiency by reusing
5
Figure 1.3 – Global production capacity of bioplastics in 2016. Retrieved from European Bioplastics, 2016.
6
1.3 Polyhydroxyalkanoates
By definition, PHA are polyesters of various hydroxyalkanoates (Reddy et al., 2003) that can be either produced by plants or bacteria in single or mixed cultures (Salehizadeh and Van Loosdrecht, 2004). The use of plants is uncommon because they can only take low PHA production yields, since higher yields limit their growth (Verlinden et al., 2007). However, bacteria can accumulate up to 90% of their dry weigh in PHA, by naturally storing carbon and energy by means of PHA accumulation in intracellular granules under conditions of excess of carbon with limitation of other nutrients (nitrogen, phosphorous or oxygen) (Reddy et al., 2003; Verlinden et al., 2007).
(A) (B)
Figure 1.4 – (A) Bacterial cell with PHA granules (Madkour et al., 2013). (B) General PHA structure where R represents the side chain of the monomer and n represents the number of carbon atoms on the main chain (Anjum et al., 2016).
Structurally, PHA can be divided into two groups according to the number of carbon atoms in the chain: short-chain-length (scl-PHA) or medium-chain-length (mcl-PHA) (Anjum et al., 2016; Koller
et al., 2013; Madkour et al., 2013). The general structure of PHA is represented in Figure 1.4. They can be classified as homopolymers, when composed by one monomer, or heteropolymers when composed by two or more monomers (Anjum et al., 2016). Some examples of heteropolymers are the copolymers poly-(3-hydroxybutyrate-co-3-hydroxyvalerate) (P(3HB-co
-3HV)), poly-(3-hydroxyhexanoate-co-3-hydroxyoctanoate) (P(3HHx-co-3HO)),
poly-(3-hydroxybutyrate-co-3-hydroxyhexanoate) (P(3HB-co-3HHx)) or poly-(3-hydroxybutyrate-co
-3-hydroxyvalerate-co-3-hydroxyhexanoate) (P(3HB-co-3HV-co-3HHx)) (Anjum et al., 2016). The
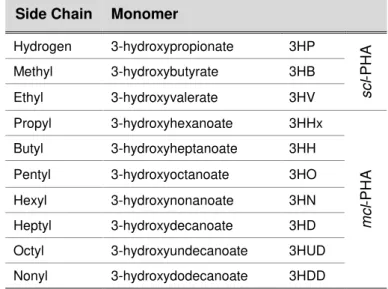
produced monomers depend on the bacterial strain, the carbon source and PHA synthases substrate specificity (Anjum et al., 2016; Reddy et al., 2003). The major PHA monomers produced in bacteria are listed in Table 1.1.
PHA production can be performed by either single or mixed microbial cultures (MMC). The choice between them relies on diverse factors since there are advantages and disadvantages associated to which one. Single microbial cultures usually have better productivity and higher PHA content (about 80% of cellular dry weight (Salehizadeh and Van Loosdrecht, 2004)), and the outcome is a simple, well-defined polymer, since there is only one type of bacteria producing it. Single cultures can produce an enormous variety of PHA ranging from scl-PHA to mcl-PHA (Cruz et al.,
7 On the contrary open MMC, such as activated sludge, make the process economically more attractive since they are easier to control, do not require the need to work under sterile conditions and improve the use of carbon rich wastes like agro-industrial wastes (Agustín Martinez et al., 2015; Salehizadeh and Van Loosdrecht, 2004; Samorì et al., 2015). MMC usually accumulate lower PHA contents (less than 20%) and to increase the bacterial PHA content there is a cellular growth phase followed by a PHA accumulation phase. PHA production by MMC is usually a two or three-stage process and this represents a disadvantage when compared to single cultures on which the whole process is performed in one reactor. A major disadvantage of using MMC is that these only allow to produce scl-PHA, namely P(3HB), P(3HB-co-3HV) and sometimes the
polymers can have the incorporation of 3-hydroxyhexanoate (3HHx) in smaller fraction (around 1%) (Salehizadeh and Van Loosdrecht, 2004; Serafim et al., 2008; Verlinden et al., 2007).
Table 1.1 – Major monomers in bacterial PHA (with n=1). Retrieved from Anjum et al., 2016.
Side Chain Monomer
Hydrogen 3-hydroxypropionate 3HP
scl
-P
HA
Methyl 3-hydroxybutyrate 3HB
Ethyl 3-hydroxyvalerate 3HV
Propyl 3-hydroxyhexanoate 3HHx
mc
l
-P
H
A
Butyl 3-hydroxyheptanoate 3HH
Pentyl 3-hydroxyoctanoate 3HO
Hexyl 3-hydroxynonanoate 3HN
Heptyl 3-hydroxydecanoate 3HD
Octyl 3-hydroxyundecanoate 3HUD
Nonyl 3-hydroxydodecanoate 3HDD
In MMC, cells are exposed to carbon rich media where they grow until the desired cellular concentration is achieved. In this type of culture, PHA production is induced by an intracellular limitation: when the cells are exposed to a growth medium with low nutrient concentrations they alter their physiology. When the carbon concentration increases, the cells are obligated to alter their physiology once more and since it is easier to adapt to PHA production than to growth, the
cells start to synthetize PHA. This process of fermentation is called “feast and famine” (Verlinden
et al., 2007). Substrates for the first step in PHA synthesis can be obtained from a variety of sources, such as wastewaters, fruits, oil rich effluents and apple pomace. These substrates are rich in complex biomolecules that require degradation into smaller biodegradable organic compounds that the acidogenic and acetogenic bacteria can then utilise in their metabolism to generate volatile fatty acids (VFA), that are the precursors to PHA formation (Reddy et al., 2003).
Production with single cultures, as it has been referred, is performed under sterile conditions. Bacterial strains such as Cupriavidus necator or Pseudomonas aeruginosa cannot grow and
8 PHA production is induced by limitation of one nutrient (most commonly, nitrogen or phosphorus) on the medium and the carbon source remains in excess. This limitation directs the cellular metabolism for PHA production. However, some bacterial strains, i.e. Pseudomonas putida, can
synthetize PHA during exponential growth phase at high rates (Sun et al., 2007).
1.3.1 Short-chain-length PHA
scl-PHA are comprised of monomers with three to five carbon atoms and their main
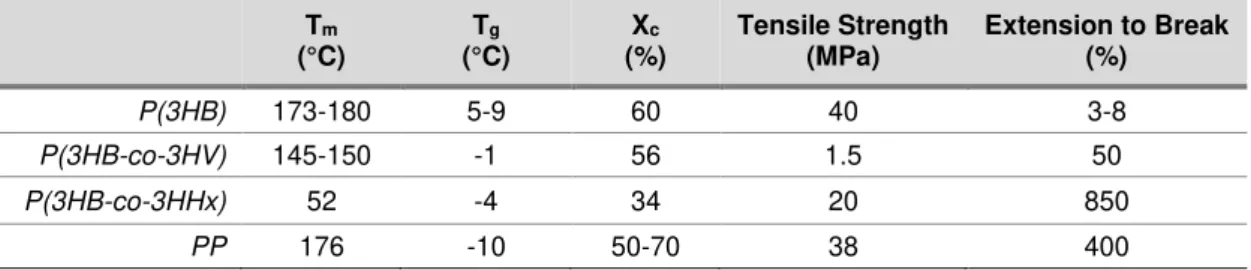
characteristics are their stiffness and brittleness (Anjum et al., 2016; Koller et al., 2013), characteristics mainly found in thermoplastics, being competitors to PE and PP (Muhr et al., 2013). Table 1.2 shows a comparison between PP and some PHA. This group of plastics usually shows high melting temperature (Tm) and degree of crystallinity (Xc), 60-80% (Anjum et al., 2016;
Koller et al., 2013). Their glass transition temperature (Tg) is also high, around 0 °C, and they
have high molar masses (between 5x10⁴ and 1x10⁶ g/mol) (Koller et al., 2013).They can be
produced by a variety of microbial strains including C. necator, P. hydrogenovora, Comamonas acidovorans, among others (Anjum et al., 2016).
The homopolymer P(3HB) has a crystalline structure, and is extremely stiff and brittle. These properties can be altered by the incorporation of another monomer with P(3HB), producing a copolymer. One example is the P(3HB-co-3HV) copolymer, which shows lower Xc and Tm than
P(3HB), is less stiff and has different mechanical properties (such as higher elongation to break and flexibility). The specific characteristics of the copolymer depend on the percentage of 3-hydroxyvalerate (3HV) incorporated into the polymer (Anjum et al., 2016).
Table 1.2 – Comparison between the physical properties of different scl-PHA and conventional
plastics (Anjum et al., 2016; Verlinden et al., 2007).
Tm (°C) Tg (°C) Xc (%) Tensile Strength (MPa)
Extension to Break (%)
P(3HB) 173-180 5-9 60 40 3-8
P(3HB-co-3HV) 145-150 -1 56 1.5 50
P(3HB-co-3HHx) 52 -4 34 20 850
PP 176 -10 50-70 38 400
1.3.2 Medium-chain-length PHA
mcl-PHA is a sub-class of PHA with monomers comprised of six to fourteen carbon atoms (Koller
et al., 2013). This type of plastics have low Tm, around 60 °C, low Tg, around -40 °C, and have
very low Xc, between 25 and 40% (Anjum et al., 2016; Koller et al., 2013). The main difference
between them and scl-PHA is the lower degree of crystallinity that makes them much more elastic
and flexible materials and provide them a larger variety of applications (Anjum et al., 2016; Reddy et al., 2003), such as glues, rubbers or adhesives (Muhr et al., 2013). P. putida was the first mcl
-PHA producer strain to be discovered and has been widely investigated. Other Pseudomonas
strains such as P. aeruginosa, P. resinovorans or P. fluorescens are also known to be mcl-PHA
9
1.4 Extraction methods
One of the main problems in the industrial implementation of PHA relies in its biosynthesis since PHA are accumulated in intracellular granules which makes it difficult to separate them from non-PHA cell mass (NPCM) or residual biomass composed by polypeptides, phospholipids, DNA, RNA and peptidoglycans (Koller et al., 2013). Different approaches on how to separate PHA from NPCM have been developed but they all rely on the same factors: (1) producer microbial strain, (2) type and intracellular amount of PHA, (3) biopolymer final application and (4) impact on PHA molar mass (Koller et al., 2013).
Prior to extraction, biomass can be submitted to pre-treatments to weaken the cellular structures and facilitate PHA extraction and purification. These strategies can involve heat, solvents or even mechanical processes, and have to be applied accordingly to the strain characteristics (Koller et al., 2013; Madkour et al., 2013).
The most used method for PHA extraction is extraction by solvent. A variety of organic solvents have been used for PHA recovery, especially for scl-PHA, such as chloroform,
1,2-dichloroethane, methylene chloride and even cyclic carbon esters. Some attempts to use nonhalogenated solvents, such as acetone, have also been tried and showed potential when applied to mcl-PHA since they have enough solubility in this group of solvents. Solvent extraction
relies on the fact that only the polymer and the lipids of the NPCM can be dissolved in the organic solvent. In order to get a purified polymer both the lipids and the solvent have to be separated from the polymer so there is a second step. This purification step involves the use of an anti-solvent that can be ethanol, methanol or water, for all PHA types, or hexane, ether or acetone for
scl-PHA (Koller et al., 2013; Madkour et al., 2013). This method has shown to provide pure
polymers with low impact on PHA molar mass (Koller et al., 2013). The biggest problems with solvent extraction and subsequently PHA precipitation are the use of organic solvents such as chloroform for the extraction and the amount of solvent that is needed. For the extraction, at laboratory scale this problem is overcome by using a closed system like a Soxhlet apparatus, but for the precipitation step the anti-solvent volume must be ten times the PHA solution volume. As for the industrial scale this method is not feasible and alternative strategies have been developed trying to aim that purpose (Koller et al., 2013; Madkour et al., 2013).
10 Strategies such as the application of supercritical fluids, namely supercritical carbon dioxide (sc-CO2), air classification, dissolved-air flotation, cell fragility and spontaneous PHA release from the
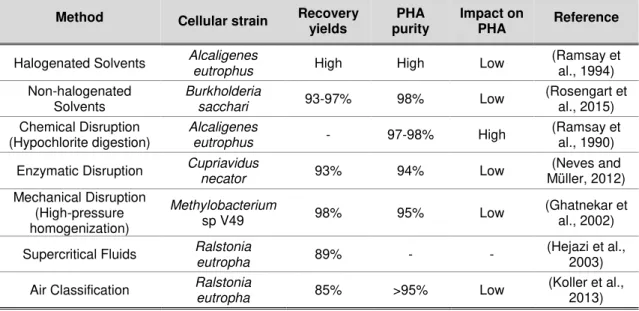
cells by recombinant strains have also been developed but they all show drawbacks either being their costs, yield or degree of purity of PHA obtained (Koller et al., 2013; Madkour et al., 2013). Table 1.3 shows a comparison between the extraction methods mentioned above.
Table 1.3 – Comparison of costs, recovery yields, PHA purity and impact on PHA between some of the most common extraction processes.
Method Cellular strain Recovery yields
PHA purity
Impact on
PHA Reference
Halogenated Solvents Alcaligenes eutrophus High High Low (Ramsay et al., 1994)
Non-halogenated
Solvents Burkholderia sacchari 93-97% 98% Low
(Rosengart et al., 2015) Chemical Disruption
(Hypochlorite digestion) Alcaligenes eutrophus - 97-98% High
(Ramsay et al., 1990)
Enzymatic Disruption Cupriavidus
necator 93% 94% Low
(Neves and Müller, 2012) Mechanical Disruption
(High-pressure homogenization)
Methylobacterium
sp V49 98% 95% Low (Ghatnekar et al., 2002)
Supercritical Fluids Ralstonia
eutropha 89% - -
(Hejazi et al., 2003)
11
1.5 Supercritical Fluids
Since the 1970s that supercritical fluids (SCF) have been gaining a lot of attention for their environmental friendly characteristics that allow them to replace organic solvents in many different applications such has natural products extraction and fractionation, impregnation, particle formation, biomass gasification or supercritical water oxidation (Brunner, 2010; Nahar and Sarker, 2005).
Figure 1.5– Phase diagram of a pure substance. Retrieved from Duarte et al., 2009.
As it can be seen in the phase diagram of a pure substance (represented in Figure 1.5), up until the critical point, the substance can be defined either as a solid, a liquid or a gas, but above its critical point phase separation becomes indistinguishable. Above the characteristic temperature and pressure of this point, the substance enters the supercritical region where it becomes a homogeneous fluid (Duarte et al., 2009; Nahar and Sarker, 2005). A SCF shows low viscosity, like a gas, high density, like a liquid, and almost non-existent surface tension. These properties provide interesting transport properties in condensed phases (Brunner, 2010; Nahar and Sarker, 2005). The critical temperatures (Tc) and critical pressures (pc) of different solvents are shown in
Table 1.4. As it can be seen, the Tc of liquids and gases can be very different and this is an
important aspect to consider when choosing a solvent to be used as supercritical fluid.
Table 1.4 - Critical conditions of different solvents. Adapted from Mchugh and Krukonis, 1994.
Tc, °C pc, bar
Carbon Dioxide 31 74
Ethane 32 49
Propane 97 43
Isopropanol 235 48
Ammonia 133 113
Water 374 221
One of the most used SCF is sc-CO2 that has been used to replace organic solvents such as n
12 has also been a target to be used as SCF but the critical point of water is at high temperature and pressure so water has been mostly used as a subcritical fluid (Asl and Khajenoori, 2013).
1.5.1 Sub and supercritical Water
Water is considered a green solvent since it is part of our surroundings and it is an harmless solvent (Kruse and Dinjus, 2007). For these reasons, water has been a target to be used as solvent for many purposes. Like any SCF, supercritical water (SCW) is defined as water at temperature and pressure conditions above its critical point (Tc=374 °C, pc=221 bar). SCW acts
as non-polar solvent being miscible with organic solvents and incapable of keeping salts soluble. This fluid has low viscosity and high diffusivity rate. Since SCW is a highly reactive fluid it is mainly used for supercritical water oxidation (SCWO), for the destruction of persistent wastes, like the ones present in wastewaters or sludges. The SCW technology has some disadvantages associated, like the high corrosive potential of the fluid itself, the salt deposition, and also the high energy requirement (Bermejo and Cocero, 2006; Brunner, 2009a). Due to these problems, water is also used as a subcritical fluid because in that region it also shows interesting properties and can be used in many applications.
Figure 1.6 – Phase diagram of water as function of pressure (atm) and temperature (°C). Triple point (tp), boiling point (bp) and critical point are pointed out and subcritical region is indicated (Asl and Khajenoori, 2013).
Subcritical Water or Hot Compressed Water (HCW) is defined as water at high temperatures (above 100 °C) and high pressure that keeps its liquid form. In HCW the ionic product increases up to three orders of magnitude (from Kw=10-14 mol2L-2 at 25 °C to Kw≈10-11 mol2L-2 at 300 °C)
13 requirements but the solvent properties of water are dependent of pressure and temperature (Möller et al., 2011). HCW has been used to a variety of applications such as wheat straw hydrolysis for production of added value products such as glucose and xylose (Abdelmoez et al., 2014) and extraction of antioxidants from grape pomace (Aliakbarian et al., 2012; Pedras et al., 2017).
1.5.2 Supercritical Carbon Dioxide
Carbon dioxide has been used as a SCF for many applications. There are many advantages in using this fluid as a substitute for other solvents in processes like extraction or purification of substances. As shown in Table 1.4 the critical point of CO2 is established at relative ambient
temperature (Tc = 31 °C) and at a pressure that is not extremely high (pc = 74 bar). Besides having
an easy to achieve critical point, CO2 has other associated advantages since it is widely available
and not expensive, it is non-toxic, non-flammable and non-corrosive. CO2 is also considered a
safe solvent considering that its separation and recovery from the products is much easier when compared to organic solvents, for instance. Control of the pressure is enough to recover the CO2
that can be recirculated and reutilized therefore not contributing to the greenhouse gas emissions (Duarte et al., 2009; Nahar and Sarker, 2005).
sc-CO2 has high density, like a liquid, and low viscosity, like a gas as it shown in Table 1.5. These
properties combined turn this SCF into a quite effective and selective solvent. The ability to solubilize compounds is related to the density of sc-CO2 and this characteristic can be adjusted
by changing the temperature and pressure without falling out the critical region. Another way to improve the solvating power of sc-CO2 is by adding modifiers to the SCF, for example methanol
that increases de polarity of the extraction media(Nahar and Sarker, 2005).
Table 1.5 – Comparison between density (kg/m3), viscosity (cP) and diffusivity (mm2/s) of Gas, SCF and Liquid. Retrieved from Nahar and Sarker, 2005.
Density (kg/m3)
Viscosity (cP)
Diffusivity (mm2/s)
Gas 1 0.01 1 – 10
SCF 100 – 800 0.05 – 0.1 0.001 – 0.1
Liquid 1000 0.5 – 1.0 0.001
As reviewed by Brunner, 2010, sc-CO2 can be used in many different industrial applications such
as extraction of essential and edible oils like sesame oil. It is also applied to treatment of cork used for wine bottle stoppers or the treatment of spent rubber tires so that waste rubber granules can be reutilized. Besides its applications in extraction and purification, sc-CO2 is also applied in
14
1.6 Motivation
With growing environmental concern and diminishing mineral oil resources, green alternatives to well established processes have started to be developed. One of the strategies is the production of bioplastics such as PHA. These biologically synthetized thermoplastics have very similar properties to the ones found in mineral oil based plastics, such as PP or PE (Madkour et al., 2013; Reddy et al., 2003). PHA can be synthesized by a variety of bacteria and substrates and are biocompatible, biodegradable and non-toxic plastics (Madkour et al., 2013; Reddy et al., 2003).
Despite the improvements in the technology, the application of PHA in industrial scale is still limited due to high production costs (Madkour et al., 2013). One of the steps that still represents a problem in PHA industrial production is the recovery and purification process. The PHA are accumulated intracellularly, and every method to extract them ends up releasing cellular compounds that get mixed with the biopolymer, making the purification step more challenging (Madkour et al., 2013). Most strategies used for PHA purification involve the use of large amounts of organic solvents and high energy requirements (Koller et al., 2013; Madkour et al., 2013; Samorì et al., 2015).
Depending on their type and specific characteristics, PHA can have different applications. Their biocompatible and biodegradable characteristics allow PHA to be used in medical applications, such as sutures, stents, patches or even controlled release systems (Verlinden et al., 2007).
This work encompassed two main goals. The first goal was to develop a method for scl-PHA
15
Chapter 2
____________________________________________________________________________P(3HB-co-3HV) extraction using Hot Compressed Water
as Pre-treatment
2 P(3HB-
co
-3HV) extraction using Hot Compressed Water as
17
2.1 Introduction
Over the past two decades, a lot of attention has been given to PHA and intensive work has been developed to produce it as a viable competitor to mineral oil-based plastics. Production processes have been optimised and the costs of production have already decreased significantly. However, the downstream processes for separation and purification of the polymers from the cells still represents a problem since PHA extraction methods rely mostly on organic solvents with hazardous characteristics. Moreover, cellular disruption methods use solvents that are hard to remove from the obtained polymer thus resulting in polymers with low purity levels. Efforts have been made to develop greener methods for PHA extraction with high yields and purity, as the ones that can be achieve with the use of organic solvents. Some attempts to use supercritical fluids, namely sc-CO2, have been tried but did not reach the desired PHA yield or purity (Hejazi
et al., 2003).
It has been explained that to release PHA from the surrounding biomass the cells have to rupture since PHA is produced as intracellular granules. Microbial cell membranes are mostly comprised by phospholipids and proteins. PHA granules membrane also consists of lipids and proteins (Koller et al., 2013). With the knowledge that HCW is a hydrolysis catalyst, it can be used to hydrolyse these compounds from the PHA surrounding biomass, hence being a green solvent for
PHA extraction. The membrane’s proteins can be hydrolysed into oligomers and amino acids,
their building blocks (Brunner, 2009b). Phospholipids can also be hydrolysed, but depending on where the hydrolysis takes place they can be split into different compounds. One example is the phospholipids hydrolysis into free fatty acids and lysophospholipid or hydrolysis to diacylglycerol (DAG) and organic phosphate (Anthonsen et al., 1999; Shah et al., 2017). The optimisation of the HCW hydrolysis conditions is extremely important because PHA are also hydrolysable since the monomers are linked together through ester bonds (Verlinden et al., 2007). It is important to find the conditions of pressure, temperature and water flow rate that are able to hydrolyse and extract the cellular membrane without affecting polymer.
18 Figure 2.1 shows how the properties of water at high pressure change. In the temperature range between 130 and 200 °C, water has its density slightly decreased when compared to water at ambient pressure and temperature (around 900 mg/L). The dielectric constant of HCW is also lower and sets its value around 40, which is the reason for water to be turned into a medium able to dissolve some organic compounds. In the range of temperatures described, the ionic product of water is higher than for water at ambient conditions, -12 instead of -14 (Kruse and Dinjus, 2007).
This work focused on the extraction of the copolymer P(3HB-co-3HV) from MMC dried cells using
19
2.2 Materials and Methods
2.2.1
PHA production
Biomass with accumulated PHA used for this work was provided by BioEng group and produced in collaboration with Sumol+Compal (Portugal). PHA was produced from waste apple pulp by a MMC (activated sludge) in a three-stage process. The first step was the conversion of the carbon source (waste apple pulp) into organic acids and ethanol, which took place in a 100 L upflow anaerobic sludge blanket (UASB) reactor. Then, in the second step, the obtained acids were feed to the mixed culture in a Feast and Famine mode, providing a way to select the PHA accumulating species from the non-accumulating ones. This process took place in a 100 L sequencing batch reactor (SBR). Then, the selected bacteria were transferred to a 10 L stirred tank reactor (STR) for the PHA accumulation stage, where they received pulse feeding of the fermented waste fruit pulp and converted it to PHA. At the end of the run, to prevent PHA degradation, the biomass was acidified to pH between 1 and 2 and stored at 4 °C.
Previously acidified biomass was neutralised with 170 mL/L sodium hydroxide (NaOH, 5 M). Following neutralisation, the biomass was centrifuged (8000 rpm, 10 minutes, 20 °C; Sigma 4-16KS). The supernatant was discarded, while the pellets were washed with deionised water and centrifuged again under the same conditions. The pellets were collected, frozen and lyophilised for 48 hours at -50 °C and 0.8 mBar. The dried biomass was then stored in closed plastics bags at -20 °C and used for PHA content quantification and for HCW extraction assays.
2.2.2 PHA extraction
2.2.2.1 Soxhlet extraction with chloroform
PHA was extracted from 5 g of dried biomass using Soxhlet extraction with 250 mL of chloroform, at 85 °C for 24 h. After the extraction, the polymer solution was left in a fume hood overnight for evaporation of part of the chloroform. The polymer was then precipitated by mixing in cold ethanol (10 times the chloroform volume) that was continually stirred. The precipitated polymer was decanted and dried in the oven at 40 °C until constant weight.
To quantify the percentage of polymer extracted from biomass, Equation 2.1 was used. In this equation m_PHA corresponds to the mass of polymer recovered after soxhlet extraction and m_sample corresponds to the mass of dried cells or extraction residue used for the extraction.
%PHA =m_sample ×100m_PHA (Equation 2.1)
2.2.2.2 Extraction with hypochlorite
20 To calculate the purity of the samples obtained from the purification with hypochlorite, Equation 2.2 was used. In this equation %PHA is the polymer content of the sample used, m_initial the initial mass used for the purification and m_final the mass of PHA obtained after the purification.
%purity = %PHA × m_initialm_final ×100 (Equation 2.2)
2.2.3 PHA treatment with HCW
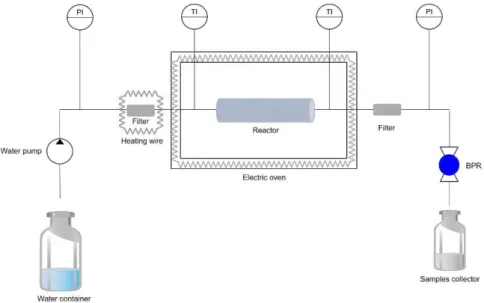
The dried biomass, treated as described in section 2.2.1, was subjected to HCW hydrolysis. The apparatus used is shown in Figure 2.2. Water is pumped into the reactor at a pre-defined flow rate through a high-pressure tube. Before entering the reactor, water passes through a heating section consisted of a ¼ inch (outer diameter) stainless steel tube heated by a heating cord. Afterwards water passes through a porous filter (100 µm) before entering the reactor. The pressure of the entire system is maintained by a Back Pressure Regulator (BPR).
The reactor is a stainless steel 51 cm long cylinder, with an external diameter of 5 cm and an internal diameter of 2.6 cm. It was filled with biomass between two layers of glass spheres and placed inside an electric oven that controls reaction temperature. To start the process the water pump was turned on and the system was pressurized. When the pressure reached 80 bar the heating cord and the oven were turned on. Along the experiment the temperature of water exiting the reactor increased at a constant rate until the desired maximum temperature was reached. At this point the system was let at constant temperature for 30 – 60 min. Water exiting the system was collected in fractions when specific temperatures were reached. After that period the apparatus was turned off and let to cool down, then the reactor was disassembled and its content (residue) was collect and dried in an oven at 60 °C for 24 h.
The tested final temperatures were 130 °C, 140 °C, 150 °C, 165 °C, 180 °C and 200 °C. At all tests the water flow rate was kept at 10 mL/min and the pressure was set for 80 bar.
21 The percentage of biomass solubilised by HCW was calculated by Equation 2.3, where m_initial stands for the initial mass placed inside the reactor and m_final stands for the mass of the residue recovered from the reactor after the hydrolysis treatment.
%Solubilised Biomass = m_initial − m_finalm_initial ×100 (Equation 2.3)
The polymer content in the biomass subjected to the different tested HCW hydrolysis conditions was quantified by soxhlet extraction with chloroform and purification as described in section 2.2.2.1., except for the fact that after precipitation in cold ethanol, the mixture was left in the freezer (-20 ºC) overnight for complete polymer precipitation. The purified polymers were recovered by centrifugation (8000 rpm, 15 minutes, 4 °C; Sigma 4-16KS) and dried in an oven at 40 °C until constant weight.
2.2.4 PHA purification with hypochlorite
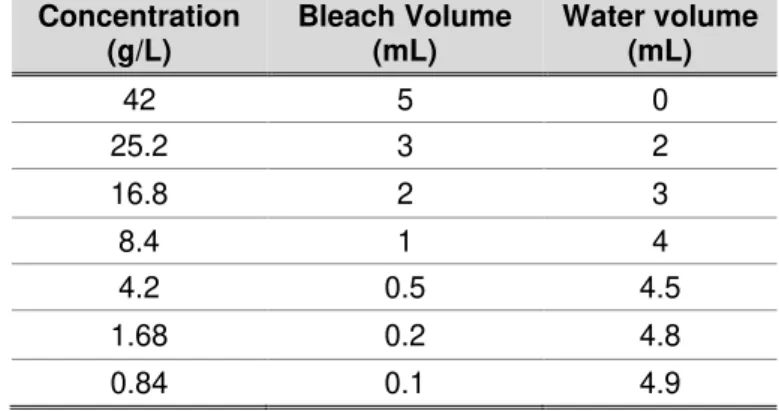
The HCW hydrolysis at 150 °C (30 minutes) was selected as pre-treatment to evaluate its efficiency in improving PHA extraction using hypochlorite. The HCW treated samples (0.200 g, dried residue) were mixed with 5 mL of hypochlorite in different concentrations (Table 2.1) and extracted as described in section 2.2.2.2.
Table 2.1 – Bleach concentrations used to extract PHA from samples previously treated with HCW.
Concentration (g/L)
Bleach Volume (mL)
Water volume (mL)
42 5 0
25.2 3 2
16.8 2 3
8.4 1 4
4.2 0.5 4.5
1.68 0.2 4.8
22
2.2.5 PHA Characterisation
2.2.5.1
Composition
To determine the polymer’s composition, gas chromatography (GC) analysis was performed with
a method similar to the one described by Cruz et al., 2015. Samples consisted of 4-5 mg of HCW treated biomass (previously crushed with a tube mill) or 2 mg of purified polymer extracted with chloroform. Hydrolysis was performed with 1 mL 20% (v/v) sulphuric acid in methanol solution and 1 mL heptadecane in chloroform (1 g/L), at 100 °C for 3.5 hours. After the hydrolysis, 1 mL deionised water was added. After separation of the organic and aqueous phases, the organic phase, with the resulting methyl esters, was transferred to vials and analysed in a chromatograph 430-GC Bruker equipped with a Restek column (Crossbond, Stalbilwax). Analysis was performed at a constant 14.5 psi pressure, using Helium as carrier gas. The calibration curve was made with copolymer of P(3-HB-co-3-HV) (Sigma-aldrich, 88 mol% 3HB, 12 mol% 3HV) dissolved in
chloroform with heptadecane (1 g/L) in concentrations ranging from 0.053 to 6.750 g/L. Heptadecane acted as intern standard.
2.2.5.2
Molecular mass distribution
To determine the polymer average molecular weight (Mw), molecular number (Mn) and polydispersity index (PDI), Size Exclusion Chromatography (SEC) was performed. For this analysis 15 mg polymer samples were dissolved in 15 mL of chloroform for 18 hours at room temperature. The samples were then filtrated with glass fibre filters (47 mm, PALL). The analysis was performed in a Waters Millenium system with chloroform as eluent with a rate of 1 mL/min. This analysis was performed by Doctor Christian Grandfils in CEIB, Université de Liège, Belgium.
2.2.5.3 Thermal Properties Determination
To determine Tg, Differential Scanning Calorimetry (DSC) analysis was performed using a
differential scanning calorimeter DSC 131 (Setaram, France). The samples were placed in aluminium crucibles and analysed in the temperature range between -90 and 120 °C, with heating and cooling speeds of 10 °C/min.
To determine the Tm and degradation temperature (Tdeg), Thermogravimetric Analysis (TGA) with
DSC above ambient temperature was performed using a thermogravimetric equipment Labsys EVO (Setaram, France). Samples were placed in aluminium crucibles and analysed in the temperature range between 25 and 500 °C, at 10 °C/min.
For both analyses 0.0100 g samples of polymer were used.
2.2.5.4
Degree of crystallinity Determination
The crystallographic structural analysis was carried out by X-ray diffraction (XRD) using Benchtop X-ray Diffractometer RIGAKU, model MiniFlex II system with Cu X-ray tube with radiation over
the 2θ range of 10-90 °C at a scan rate of 1 deg/min.
23
2.3 Results and Discussion
2.3.1 PHA characterisation
Biomass was produced by a MMC from waste apple pulp in three-stage process, including anaerobic digestion of the waste apple pulp, selection of PHA accumulator bacteria and, finally, a PHA accumulating stage. The stoichiometric parameters for this production are not available since the production process was not included in this work. The dried biomass was used for PHA extraction using different methods such as soxhlet extraction with chloroform and hypochlorite extraction. Soxhlet extraction with chloroform was used as a standard method to quantify the PHA content in the biomass and obtain the polymer without altering its properties. With this extraction 66% of polymer were recovered and this value was considered as the polymer content of the cells.
The PHA sample extracted with chloroform was characterised in terms of its composition, molecular mass distribution, thermal properties and degree of crystallinity. The results are shown in Table 2.2. By GC analysis, it was possible to determine that the polymer was a HB/HV co-polymer with a 3HV content of 17%. The chromatogram obtained from GC analysis is shown in Appendix 1 (Figure A.1). Similar 3HV contents (between 14 and 19%) were reported in literature (Albuquerque et al., 2011; Duque et al., 2014; Martínez-Abad et al., 2016; Reddy et al., 2009). It is known that 3HV content has impact on polymer thermal properties and on its degree of crystallinity (Anjum et al., 2016). In Table 2.2 it is possible to see that even for a small range of 3HV content (15 to 19%), Tm can change between 147 and 168 °C. The Mw of this PHA is in the
same order of magnitude of values described for PHA produced by MMC from real feedstocks (2.15x10⁵ and 6.46x10⁵ by Albuquerque et al., 2011). The PDI is low (1.27), indicating that even
though the polymer was produced by a MMC, there is almost uniform length of the polymer’s
chains (Duque et al., 2014). The crystallinity degree of the polymer was not calculated, however the diffractogram obtained is similar to examples found in literature for P(3HB-co-3HV) (Cha et
al., 2016; Galego et al., 2000). The diffractogram is shown in Appendix 2 (Figure A.2) and the high peaks indicated that a part of the polymer has a crystalline structure.
The sample extracted with hypochlorite was only characterised in terms of its 3HV content and molecular mass distribution. The 3HV content was not affected by hypochlorite, so it is the same for both extractions performed (17% 3HV). Extracting PHA with methods based on hypochlorite
digestion is known to have impact on the PHA’s Mw, there are even examples on which the PHA
Mw was reduced by 50% (Berger et al., 1989). The Mw of polymer sample extracted with hypochlorite (3.17x10⁵ g/mol) was similar to that of the polymer extracted with chloroform
(3.03x10⁵ g/mol). This indicates that the extraction with hypochlorite did not affect the Mw of
P(3HB-co-3HV), as it would be expected. The PDI was not affected and is the same as the
obtained for the polymer extracted with chloroform (1.27).
24
Table 2.2 – Characterisation of the P(3HV-co-3HB) produced from waste apple pulp and extracted
from the original biomass by Soxhlet extraction with chloroform and with hypochlorite compared to examples from literature. The characterisation includes 3HV content of the PHA, thermal properties and molecular mass distribution (n.a. – not available).
Extraction method
HV content (%)
Tm (°C)
Tdeg (°C)
Mw (x105, g/mol)
PDI Reference
Soxhlet with
chloroform 17.0 151.7 282.9 3.03 1.27 This study
Hypochlorite
digestion 17.0 - - 3.17 1.27 This study
Chloroform 19.0 168.2 277.8 2.5 1.3 (Duque et al., 2014)
Chloroform 15.0 147 247 6.45 2.3 (Albuquerque et al., 2011)
Hypochlorite
digestion 18.3 171.0 n.a. 3.6 1.7 (Martínez-Abad et al., 2016) Hypochlorite
25
2.3.2 PHA treatment with HCW
HCW was used as hydrolysis medium and catalyst for the purification of P(3HB-co-3HV) through
the simultaneous hydrolysis and extraction of the remaining cell material. For the HCW assays biomass was treated as described before.
Figure 2.3 – Heating profile of the HCW system (line) of an extraction with final temperature of 150 °C and biomass loss in the reactor during the different heating phases (bars represent the biomass that remained in the reactor).
Figure 2.3 represents the heating profile of an assay with final temperature of 150 °C. The process of heating the equipment, and consequently water, to the desired temperature was slow. At first water passed through the biomass at room temperature (18 to 20 °C) for few minutes to confirm that there were no leaks on the system. At that point the system was pressurized and the heating process began. The heating rate on the first hour of this assay was 1.34 °C/min, and the system was heated from room temperature to 100 °C. Afterwards the system was heated from 100 °C to the final specific temperature at a rate of 0.74 °C/min.
Table 2.3 shows the conditions of temperature and time of extraction of all the hydrolysis performed. For all the experiments, the water flow rate was kept constant, at 10 mL/min. The efficiency of the hydrolysis was measured by the percentage of biomass solubilised and by the polymer content on the biomass that remained in the reactor. The assay at 200 °C was completely destructive so there are no results for this temperature.
The polymer content on the original biomass was 66%, so the extractions at 150 °C and 165 °C seem to have the highest improvement in polymer content, being 77% and 75%, respectively. At 165 °C the solubilised biomass was 23% which is higher than for the extraction at 150 °C (12%). However, at 165 ºC the polymer content of the sample was only 75%, indicating that a part of the PHA was probably degraded by HCW. The results obtained for the hydrolysis at 150 °C indicate that at this temperature the best results were obtained for the extraction of the cellular material without polymer loss.
10,0 10,5 11,0 11,5 12,0 0 20 40 60 80 100 120 140 160
0,00 0,50 1,00 1,50 2,00 2,50 3,00
26 After concluding that 150 °C was the best temperature to perform the HCW treatment, the reaction time was increased from 30 min to 60 min. However, the increase on the solubilised biomass was not significant (from 12% to 13%).
Table 2.3 – Different conditions of time and temperature extraction with HCW performed and respective percentages of solubilised biomass and polymer content. The values of polymer content were calculated after Soxhlet extraction with chloroform.
T (°C) Time (min) Solubilised Biomass (%) Polymer content (%) HV content (%) Tm (°C) Tdeg (°C) Mw (x105, g/mol)
PDI
Original
P(3HB-co-HV) - - 17.0 151.7 282.9 3.03 1.27
130
30
16 57 17.0 150.1 277.9 1.15 5.09
140 11 69 - - - 0.50 7.97
150 12 77 17.0 147.1 294.7 0.50 6.01
165 23 75 16.0 140.6 294.1 0.23 7.35
180 25 51 15.0 127.2 290.9 0.07 3.9
200 98 - - - -
150 60 13 77 16.0 143.9 292.6 - -
As it has been referred to quantify the polymer remaining on the sample of biomass treated with HCW, the PHA was extracted by soxhlet extraction with chloroform and purified. Pictures of polymer samples extracted at three different temperatures (150 °C, 165 °C and 180 °C) are shown in Figure 2.4 and it is visible that the polymer suffered some alterations. The purified samples
were than used to study the polymer’s thermal properties, degree of crystallinity and molecular
mass distribution (Table 2.3). The characteristics of the original polymer, obtained from biomass without any treatment are also shown in Table 2.3.
As the HCW temperature increased Tm tended to decrease. For the extraction at 150 °C, 60 min,
the Tm was lower than for the extraction of 30 min, indicating that even though there was no loss
of polymer during the hydrolysis its properties are different. Tdeg also changed, however at 150
°C, 30 min, it was higher than the original polymer’s. The main difference between the original
polymer and the samples obtained from biomass treated with HCW was in the Mw. P(3HB-co
-3HV)’s Mw was highly affected by HCW conditions, being reduced about three times at 130 °C,
one order of magnitude at 140 °C, 150 °C and 165 °C, and two orders of magnitude at 180 °C. The PDI value increased comparatively to the original polymer for all the HCW temperatures
tested. PHA’s Mw is related to its mechanical and thermal properties, having high Mw is what
27 Although with HCW at 150 °C there was no evident loss of PHA, the Mw values obtained show that P(3HB-co-3HV) was affected by HCW. The Mw decrease is evident at all the temperatures
tested and is worse for higher temperatures. The PHA monomers are linked together by ester bonds (Verlinden et al., 2007), therefore HCW should be able to hydrolyse the polymer. It was expected to find conditions that would hydrolyse the cell material without affecting the polymer, however, that was not possible and all the conditions tested the polymer some extent of the polymer was broken into smaller and heterogenous fractions.
Figure 2.4 - Pictures of the P(3HB-co-3HV) obtained after the HCW hydrolysis of biomass. A – HCW
150 °C; B – HCW 165 °C; C – HCW 180 °C.
28
2.3.3 Extraction of PHA from HCW treated biomass using hypochlorite
Since it was not possible to extract and purify the P(3HB-co-3HV) only with HCW treatment, it
was proposed to use HCW as a pre-treatment. HCW is effective in breaking and degrading cellular compounds hence leaving the polymer more accessible for extraction. With this knowledge, it was expected that it would be possible to separate the cell remains from the PHA by dissolving them in a solvent. The solvents tried for this purification were water, ethanol (25%), acetone and hypochlorite. Only the hypochlorite was effective in dissolving the cell remains to a point that it was possible to recover the PHA in a pellet form. Examples of the purification of P(3HB) and P(3HB-co-3HV) using hypochlorite have been described by Ramsay et al., 1990,
Martinez-Abad et al., 2015, among others.
The purification was performed on the biomass treated with HCW at 150 °C, with a polymer content of 77%. As control, one sample of original biomass was also purified with this method, using the highest concentration of hypochlorite (42 g/L). Table 2.4 shows the solubilised biomass for each hypochlorite concentration and the respective polymer purity. It is possible to see that the control sample had a solubilisation yield higher than all the other samples, however, with lower polymer content. This may have happened because in the HCW treated samples the cell components were already partially hydrolysed and some of them had already been extracted. Therefore, the lower solubilisation yield only reflects the lower content of extractable material.
On the samples pre-treated with HCW, the highest polymer purity (84% ± 1%) was achieved for the highest hypochlorite concentration (42 g/L). However, for the three following concentrations (25.2, 16.8 and 8.4 g/L) the same polymer purity was achieved (82%). This indicates that on biomass treated with HCW it is possible to use five times less hypochlorite concentration to purify the P(3HB-co-3HV) from the surrounding cell debris.
The purity degrees achieved in this work (80 to 84%) are still lower than the ones described in literature (90 to 97%). Martinez-Abad et al., 2015, described the purification of the P(3HB-co