Ana Rita Guerra Silva Rodrigues Pinto
Mestre em Engenharia Química e Bioquímica
LIGNOCELLULOSIC RESIDUES VALORIZATION
USING A COMBINED APPROACH OF SUB-,
SUPERCRITICAL FLUIDS AND BIOTECHNOLOGY
Dissertação para obtenção do Grau de Doutor em Sistemas de Bioengenharia
Orientador:
Dr. Alexandre Paiva, Investigador Post-doc REQUIMTE da Faculdade de
Ciências e Tecnologia da Universidade Nova de Lisboa
Co-orientador:
Prof. Doutora Susana Barreiros, Professora Associada com Agregação da
Faculdade de Ciência e Tecnologia da Universidade Nova de Lisboa
Co-orientador:
Prof. Doutora Madalena Oom, Professora Associada do Instituto Superior
de Ciências da Saúde Egas Moniz
LIGNOCELLULOSIC RESIDUES VALORIZATION
USING A COMBINED APPROACH OF SUB-,
SUPERCRITICAL FLUIDS AND BIOTECHNOLOGY
“Copyright”
Ana Rita Guerra Silva Rodrigues Pinto
Faculdade de Ciências e Tecnologia
Universidade Nova de Lisboa
“Se, no princípio, a ideia não é absurda, então não há esperança para ela.”
Agradecimentos
(Aqueles que me conhecem bem, sabem que os agradecimentos não vão ser pequeninos... Mas tem que ser. Ensinaram-me que os melhores trabalhos só se fazem com boas equipas e, este, não foi exceção. Embora apenas com o meu nome, foi toda esta equipa que o desenvolveu sem a qual nunca teria sido capaz de apresentar este trabalho.)
O meu primeiro agradecimento vai, claro, para o meu orientador, Dr. Alexandre Paiva com um
“Muito Obrigada” muito grande e muito sentido. Há quase 8 anos atrás, entrei neste laboratório e
desde aí que apostaste em mim. O entusiasmo e a vontade de ir mais além era enorme, os projetos não pararam de aparecer desde o simples plano de reestruturação do laboratório, as obras para a nossa
“casa dos bichos” que não deixou, infelizmente, o estatuto de “casota”, até ao nosso GRANDE
“White Petrol”. E foi aí que me conquistaste, ao ponto de apostar tudo contigo num doutoramento que
sempre disse que só o faria se fosse contigo na linha da frente, como meu orientador. Arriscámos e vencemos. Hoje, muita água correu, mas (embora por circunstâncias da vida, não tenha sido a primeira a defender), tenho muito orgulho em ter sido a tua primeira aluna de doutoramento e ter também apostado no meu futuro para que o teu também crescesse. Tarde sim, mas aqui tens o fruto dessa aposta. Muito obrigada por todas as oportunidades que me deste, por toda a dedicação que tiveste para que eu desenvolvesse e crescesse no mundo da investigação e também por momentos em fomos apenas amigos, com muitas palhaçadas e por me teres feito rir (ao ponto de quase morrer no laboratório com um cereja entalada na garganta). Desejo, do fundo do coração, que continues a vingar no mundo da investigação e que assim permaneças por muitos e longos anos porque és a alma deste laboratório que nunca poderá acabar.
Um agradecimento sincero também para a minha co-orientadora Prof. Susana Barreiros por me ter aceite no seu laboratório, pela aposta e pela liberdade que sempre me deu para crescer ao meu ritmo. Muito obrigada por todo o conhecimento que me transmitiu não só a nível de investigação mas também como exemplo de eficiência, profissionalismo, respeito e objectividade.
À Prof. Madalena Oom, minha co-orientadora, principalmente por me ter aceite como sua aluna de doutoramento já depois do seu início, abraçando comigo este desafio, mesmo misturando mundos tão diferentes. Muito obrigada professora por tudo o que me ensinou e por me ter obrigado e ensinado a “reduzir”, a ser mais clara, objectiva e sucinta! Muito obrigada pela sua dedicação e por ter estado sempre disponível para me ajudar!
Aos professores Pedro Simões, Álvaro Fonseca, José Teixeira e Marco Gomes por todo o contributo, dedicação e apoio em campos distintos deste trabalho, sem o qual não teria sido possível terminar.
Ao Pedro Vidinha.... Porque és grande, muito grande e o teu entusiasmo contagiou-me desde o início e o qual me fez MUITA falta quando saíste.... Levo as recordações do teu entusiasmo, da tua energia, da tua “loucura”... Tudo contigo era possível e, hoje sei, não se faz investigação sem uma ponta dessa
“loucura”! Muito obrigada por teres sempre acreditado em mim, por todas as vezes que me levantaste
a moral quando eu quase desesperava, encontravas sempre um caminho novo, davas-me sempre energia para continuar e para voltar a acreditar... Nunca mais foi o mesmo desde que saíste... Mas fiquei com teu exemplo e sei que vais vencer porque é completamente impossível que não o faças!
Às “minhas” alunas de mestrado Kat e Luiza... Um dos maiores “Obrigada” vai para vocês, por todo
frente neste projeto. Um especial à Kat, com quem cresci muito, que também me ensinou muito, que
“partiu muita pedra” comigo, que sempre esteve do meu lado e com quem adorei trabalhar! Fomos
uma dupla fantástica e tenho a certeza que, se pudéssemos, teríamos ido muito longe!
À Cláudia e ao Fábio que mais que colegas foram meus amigos, que me ajudaram muito e se dedicaram ao desenvolvimento deste projeto. Muito obrigada por toda a paciência, por me terem recebido de braços abertos, por tudo o que me ensinaram sempre cheios de boa vontade!
A todos os meus colegas do laboratório 427 que foi para mim o melhor laboratório da FCT e arredores com a Tanusca, a Dianinha, a Sílvia, a Rita, a Vera, a Carmen, o Mário, o Gustavo, o Ricardo, a Margherita, a Sónia, a Mariana, a Francisca, o Zézito. Estou muito agradecida por ter feito parte desta equipa, por toda a ajuda que todos me deram, por ter aprendido muito com todos vocês, por me ter rido e ter feito parte desse ambiente incrível que se vivia no 427. Às “minhas” Tanusca e Dianinha, por que muito mais que colegas, somos amigas e cuja ligação sei que nunca vai desaparecer mesmo com tantos kms de distância. Ao meu Gang da Tupperware, com a Ana Pina e a Leonor, obrigada por serem minhas amigas, por todo o apoio, por todos os momentos juntas e por me terem feito rir TANTO!
À “MINHA” Madalena, a minha outra parte, aquela que me equilibra. Foste das melhores partes do meu doutoramento. Contigo fiz este caminho, superei frustrações, estávamos e estamos sempre juntas, para o que der e vier. Tantos cigarros naquela varanda, umas vezes tão felizes por grandes feitos, outras vezes tão tristes e desorientadas.... E aí, estávamos uma à para outra, num dia a puxar uma, outro dia a puxar a outra.... Sempre e para sempre, JUNTAS!
Um agradecimento ENORME e ESPECIAL aos meus sogros, um dos maiores pilares e referências que tenho na vida. São um exemplo para mim de sucesso, esforço e dedicação. Nem sei como agradecer toda a ajuda, todo o apoio sem o qual teria sido IMPOSSÍVEL acabar este trabalho. Obrigada por tudo o que me ensinam, por fazerem de mim uma pessoa melhor, por toda a força que me deram para que não desistisse, para que continuasse sempre em frente e para vencer os meus pensamentos “negativos”!
Um agradecimento muito mais do que especial aos meus Pais, por TUDO! Por me terem sempre dado força, por acreditarem sempre em mim, por me terem dado sempre todas as ferramentas para crescer, para ir mais além, pela preocupação e pela dedicação. A ti Pai, um ainda maior. Porque, como sempre, dás-me sempre a mão nos momentos mais difíceis da minha vida. Estás lá sempre, do meu lado! Muito obrigada pela ajuda e liberdade que me deste quando mais precisei, pela oportunidade que me deste de crescer e ao mesmo tempo de concretizar este trabalho. És o maior exemplo que tenho e o MELHOR PAI que se pode ter na vida!
Por fim, o maior, mais especial, mais intenso agradecimento de todos. Aos homens da minha vida, ao meu marido e ao meu filho, os amores da minha VIDA! Porque vocês serão sempre TUDO para mim. Ao meu marido, um muito obrigada por seres quem és, todo apoio que me dás, por todas as palavras e força que me dás quando estou desesperada, por acreditares sempre em mim, por fazeres de mim uma pessoa melhor, por segurares tantas pontas para que eu possa seguir em frente, por estares sempre ao meu lado para o que der e vier, por toda a tua contribuição para que sejamos um família com “F” grande, por tudo o que te sacrificas por nós. És, e serás sempre, o AMOR da minha VIDA!
Resumo
O trabalho apresentado nesta tese propõe o desenvolvimento de um processo integrado que combine fluidos sub-, supercríticos e biotecnologia de forma a criar uma cadeia de valorização para resíduos lenhocelulósicos. A água sub-crítica é avaliada como um meio alternativo e viável para proceder, simultaneamente, a reacções de extracção de compostos de alto valor acrescentado directamente disponíveis nos resíduos lenhocelulósicos como, por exemplo, compostos fenólicos assim como para reacções de hidrólise dos principais componentes estruturais, celulose, hemicelulose e lenhina. Foram estudados diferentes resíduos lenhocelulósicos tais como o resíduo de papel reciclado, as massas vínicas e o bagaço de maçã. Relativamente à reacção de hidrólise, o principal objectivo foi a obtenção de soluções aquosas ricas em açúcares que poderão, posteriormente, ser utilizadas como fonte alternativa de carbono para o crescimento de leveduras oleaginousas que são, por sua vez, capazes de acumular lípidos e carotenóides. Como estágio final do processo proposto, uma fonte alternativa de óleo foi aplicada para a produção de biodiesel através de um processo integrado e em contínuo que combina as tecnologias de dióxido de carbono supercrítico e enzimas. Desta forma, a cadeia de valorização proposta será capaz de gerar, a partir de resíduos lenhocelulósicos, três compostos de alto valor acrescentado: lípidos, carotenóides e biodiesel, combinando pela primeira vez, vários solventes alternativos, bioengenharia e biotecnologia.
O residuo de papel reciclado foi utilizado como um residuo lenhocelulósico modelo para avaliar o potencial da água-subcrítica na hidrólise da celulose, hemicelulose e lenhina. Foram estudados dois modos de operação distintos: batch e semi-contínuo. Após uma detalhada análise de todo o processo incluindo a avaliação de diferentes parâmetros operacionais, a recuperação dos produtos finais e o desenvolvimento de balanços de massa detalhados, foi possível provar que o modelo em semi-contínuo provou ser o desenho de processo mais adequado com uma maior recuperação de compostos solúveis, maioritariamente monossacáridos, evitando ao mesmo tempo a formação de compostos de degradação.
As massas vinicas foram utilizadas para avaliar o potencial de utilização de um tratamento com água-subcrítica onde simultaneamente se extrai compostos fenólicos disponíveis ao mesmo tempo que se hidroliza os seus principais componentes de forma a obter uma solução aquosa rica em açúcares. A água-subcritica provou ter o potencial para ser usada tanto como solvente para extracção de compostos de alto valor acrescentado assim como reagente para reacções de hidrólise.
directamente por microorganismos como a levedura Rhodotorula babjevae. Esta levedura atingiu
DO’s 2 a 5 vezes maiores que aquelas obtidas durante a utilização de misturas de açúcares modelo
demonstrando assim, pela primeira vez, que os resíduos agrícolas quando tratados com água-subcritica, originam uma fonte de carbono adequada para o crescimento de leveduras.
Foram testadas cinco leveduras oleaginosas para demonstrar o potencial da utilização do bagaço de maçã como fonte de carbono não só para efectuar o crescimento das leveduras mas também para a produção de lípidos e carotenóides. Foram observados resultados muito positivos tanto para o crescimento como para a acumulação de lípidos e carotenóides sem efectuar qualquer optimização dos parâmetros de crescimento das leveduras.
Foi utilizada uma fonte de óleo alternativa, o óleo usado, como matéria-prima para a produção de um combustível alternativo, o biodiesel, através da sua aplicação num processo integrado em contínuo utilizando dióxido de carbono supercrítico e um reactor de leito fixo enzimático. A prova de conceito foi efectuada através da recuperação de um produto final com uma pureza superior a 96 % em metil estéres de ácidos gordos através da utilização de um processo baseado na tecnologia de dióxido de carbono supercrítico, seja o material de partida um óleo virgem ou um óleo usado.
Abstract
An integrated processed combined sub-, supercritical fluids and biotechnology was proposed to create a valorization chain for the lignocellulosic residues. Hot compressed water was evaluated as an alternative medium to perform the simultaneous extraction of added value compounds directly available in the lignocellulosic residues such as phenolic compounds as well as the hydrolysis of the main structural components, cellulose, hemicellulose and lignin. Different lignocellulosic residues such as recycled paper mill sludge, grape pomace and apple pomace were studied. The main goal of the hydrolysis was to obtained aqueous solutions rich in sugars which can be further used as alternative carbon source to oleaginous yeasts growth which are capable of accumulating lipids and carotenoids. As final stage of this proposed process, the use of alternative oil sources was evaluated by using an integrated continuous process, which combined supercritical carbon dioxide and enzymes. Therefore, this valorization chain will be able to generate form lignocellulosic residue, three added value compounds: lipids, carotenoids and biodiesel by combining for the first time several alternative solvents, bioengineering and biotechnology.
Recycled paper mill sludge (RPS) was used as lignocellulosic residue model to evaluate the potential of using HCW to perform the hydrolysis of the three main components, cellulose, hemicellulose and lignin. Two different operational modes were tested: batch and semi-continuous flow reactors. From a detailed process analysis including the evaluation of different operational parameters, target products recovery and the devolvement of detailed mass balances, the semi-continuous model proved to be the most fitted process design, with a higher recovery of water soluble compounds, mainly monosaccharides, avoiding at the same time the formation of degradation compounds.
Grape pomace was used to evaluate the potential of using a HCW treatment, which simultaneous extracts the phenolic compounds directly available in the residue as well as the hydrolysis of its main structures in order to obtain a solution rich in sugars. HCW proved to have the potential to be used as a solvent for the extraction of added-value compounds as well as a reactant for the hydrolysis. The extraction of antioxidants using HCW presented yields which are 10 times higher than those using conventional solvents. Additionally, HCW hydrolysis allows fast recovery of up to 60% of structural carbohydrates of grape pomace mainly in the form of oligosaccharides, which can be further digested by enzymes or used directly by microorganisms such as Rhodotorula babjevae yeast. This yeast exhibited an OD 2 to 5 fold higher than obtained with model mixtures, demonstrating, for the first time, that HCW-treated agricultural residues affords suitable carbon source for the growth of non-Saccharomyces yeast.
Alternative oil sources, such as waste cooking oil, was used as raw material to produce an alternative biofuel- biodiesel applying a combined integrated continuous process using SC-CO2 and a continuous enzymatic flow reactor. It was made the proof of concept by achieving a product with >96 % of FAME using a ScCO2-based process as described, whether the starting material is virgin or waste cooking sunflower oil.
Table of Contents
Acknowledgements………... ix
Resumo………. …. xi
Abstract………. xiii
List of Figures……… xxi
List of Tables………. xxvii
Abbreviations,
symbols and constants………
..
xxixCHAPTER1: Introduction……….. 1
1.1.Biorefinary concept- The role of Bioengineering Systems……… 3
1.2. Lignocellulosic materials: Structure and characterization……….. 5
1.2.1. Cellulose………... 5
1.2.2. Hemicellulose………... 7
1.2.3. Lignin……….... 11
1.3.Biomass valorization: Added value by-products ………. 14
1.3.1. Carbohydrate applications………... 14
1.3.2. Phenolic compounds………... 15
1.4.Lignocellulosic residues ……….... 18
1.4.1. Paper industry: Recycled paper mill sludge……… 19
1.4.2. Wine making industry: Red grape pomace……… 24
1.4.3. Cider industry: Apple pomace……….... 28
1.5.Biomass conversion conventional methods ………. 31
1.6.Hot compressed water………... 33
1.7.1. Cellulose hydrolysis ……… 40
1.7.2. Hemicellulose hydrolysis ……… 45
1.7.3. Lignin hydrolysis……….. 48
1.7.4. Degradation reactions of monosaccharides……… 50
1.8.Added value products extraction using hot compressed water extraction……… 55
1.9.Oleaginous yeast………... 57
1.9.1. Lipid accumulation in oleaginous yeast………... 60
1.9.2. Carotenoids: synthesis and properties………. 62
1.10. Biodiesel production from alternative oil sources……… 64
1.11. Thesis outline………. 67
CHAPTER 2: Materials and Methods……… 71
2.1. Materials………... 73
2.2. Lignocellulosic residues characterization……… 73
2.3. Hot compressed water treatment apparatus………. 74
2.3.1. Hot compressed water (HCW) treatment apparatus using a semi-continuous flow reactor………. 74
2.3.2. Hot compressed water hydrolysis of RPS- Batch experimental setup….. 78
2.4. Liquors characterization after HCW treatment……… 79
2.5. Monosaccharide analysis by HPLC……….. 81
2.6. Residues treatment after HCW treatment analysis……….. 81
2.7. Phenolics compounds extraction ……… 81
2.7.1. Phenolics compounds extraction from GP using organic solvents………. 81
2.7.2. Phenolic compounds quantification by HPLC analysis………. 82
2.8.1. Pre-inoculum………. 83
2.8.2. Yeast growth using microplates and red grape pomace hydrolysates as carbon source……….. 84
2.8.3. Yeasts growth using apple pomace hydrolysates as carbon source……… 84
2.8.4. Lipid analysis ………... 85
2.8.5. Carotenoids extraction and HPLC analysis……….. 85
CHAPTER 3: Paper mill sludge HCW hydrolysis ………... 87
3.1. Introduction……….. 89
3.2. Materials and Methods………. 90
3.3. Experimental results and discussion……… 91
3.3.1. Semi-continuous water flow rate optimization ……….. 92
3.3.2. Samples pH variation during semi-continuous hydrolysis of RPS………... 93
3.3.3. Process conversion in batch and semi-continuous systems……… 95
3.3.4. Process yield in batch and semi-continuous systems………. 97
3.3.5. RPS pre-treatment……… 98
3.3.6. Monosaccharide recovery and degradation compounds formation in batch and semi-continuous mode……… 100
3.3.7. Global mass balances……… 104
3.3.8. Dynamic mass balance………. 119
3.3.8.1.Products production along time……… 119
3.3.8.2.Severity factor ………. 125
3.4. Conclusions………... 127
CHAPTER 4: Grape pomace valorization through HCW treatment………. 129
Chapter 4.1.: Grape pomace phenolic compounds extraction using HCW……… 131
4.1.2 Materials and Methods………. 133
4.1.3. Results and discussion……….. 134
4.1.3.1.Total phenolic compounds in red GP……….. 134
4.1.3.2.Extraction of phenolic compounds in red GP using organic solvents……….. 136
4.1.3.3. Extraction of phenolic compounds in red GP using HCW………. 140
4.1.4 Conclusions………... 143
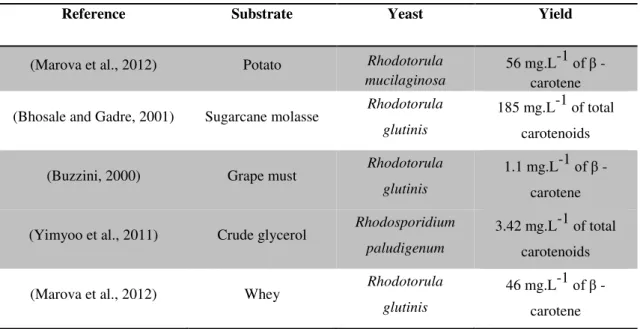
Chapter 4.2.: Grape pomace as alternative carbon source for carotenoid-producing oleaginous yeast after HCW treatment……….. 145
4.2.1. Introduction……… 146
4.2.2 Materials and Methods……… 147
4.2.3 Results and discussion……….. 150
4.2.3.1. HCW treatment of GP………. 150
4.2.3.2 GP hydrolysate as carbon source for yeast growth……… 154
4.2.4 Conclusions………... 157
CHAPTER 5: Oleaginous yeast potential to assimilate alternative carbon sources produced from apple pomace HCW treatment………. 159
5.1. Introduction………... 161
5.2. Materials and Methods……… 162
5.2.1. Apple pomace hydrolysis using HCW………. 162
5.2.2. Liquors analysis ………... 163
5.2.3. Yeast growth with AP hydrolysates………. 163
5.2.4. Yeast growth and lipid accumulation using optimized AP extract………. 163
5.2.5. Lipids analysis………... 164
5.3.Results and discussion………... 164
5.3.1. The temperature effect on AP HCW hydrolysis……….. 164
5.3.2. Apple pomace liquors as carbon source for oleaginous yeast growth…… 170
5.3.3. Apple pomace hydrolysates potential for lipid accumulation by yeasts… 174 5.3.4. HCW treatment of AP at selected temperatures to obtain hydrolysates for Rhodotorula mucilaginosa growth……… 179
5.3.5. Apple pomace HCW hydrolysis temperature optimization for Rhodotorula mucilaginosa optimal growth and lipid accumulation……….. 182
5.3.6. Lipid accumulation by Rhodotorula mucilaginosa using AP hydrolysate at 130 ºC as single carbon source –Scale up………. 186
5.3.7. Rhodotorula mucilaginosa carotenoids production ……… 189
5.4.Conclusions……… 191
CHAPTER 6: Continuous enzymatic production of biodiesel from virgin and waste sunflower oil in supercritical carbon dioxide………. 193
6.1. Introduction………. 195
6.2. Materials and Methods………... 196
6.2.1. Materials……… 196
6.2.2. High-pressure apparatus……….. 197
6.2.3. Analytical methods……….. 198
6.3. Results and discussion………. 198
6.3.1. Transesterification of virgin oil………. 198
6.3.2. Reaction product fractionation………. 201
6.3.3. Transesterification of WCO………. 204
6.4. Conclusions……….. 206
7.1. General conclusions……… 208
7.2. Future work……… 209
List of Figures
Figure 1.1: Flowchart model of biobased products from biomass feedstock’s (Kamm, B.;
Gruber, P.R.; Kamm, 2008)………. 4
Figure 1.2: Lignocellulosic biomass: (A) Cellulose, hemicellulose and lignin as major constituents of cell wall (Tomme, P.; Warren, R. A. J.; Gilkes, 1995); (B) Lignocellulosic structure (Wu et al., 2008)……….. 5
Figure 1.3: Cellulose molecular structure (Mohan et al., 2006)……….. 5
Figure 1.4: Cellulose structure and inter- and intra-chain hydrogen bonding pattern……. 6
Figure 1.5: Main constituents of hemicelluloses (Hansen and Plackett, 2008)………….. 7
Figure 1.6: Structure of a heteroxylan hemicellulose - softwood arabinoglucuronoxylan (Shimizu, 2001)………... 9
Figure 1.7: Glucomannan strucuture (Shimizu, 2001)……… 10
Figure 1.8: Xyloglucan structure………. 10
Figure 1.9: Arabinogalactan structure………. 11
Figure 1.10: (A) Structures of the monomeric phenylpropane precursors of lignin. (B) Corresponding methoxylated forms of phenylpropane precursors of lignin……… 12
Figure 1.11: Partial structure of hardwood lignin (Mohan et al., 2006)……….. 13
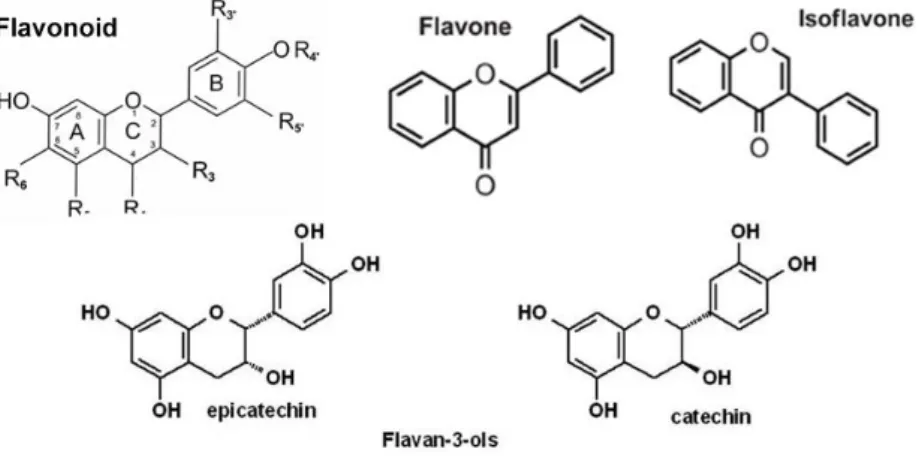
Figure 1.12: Different flavonoids structures (Rice-Evans et al., 1997)………... 16
Figure 1.13: Structures of hydroxybenzoic acids (A) and hydroxycinnamic acids (B) (Moreno-Arribas, M.V.; Polo, 2009)……….. 17
Figure 1.14: Resveratrol different structures (Burns et al., 2002)………... 17 17 Figure 1.15: Worldwide paper production industry distribution in 2013 (PPI PULP & PAPER……….. 19
Figure 1.16: PMS generation flowchart (Likon and Trebše, 2005)………. 20
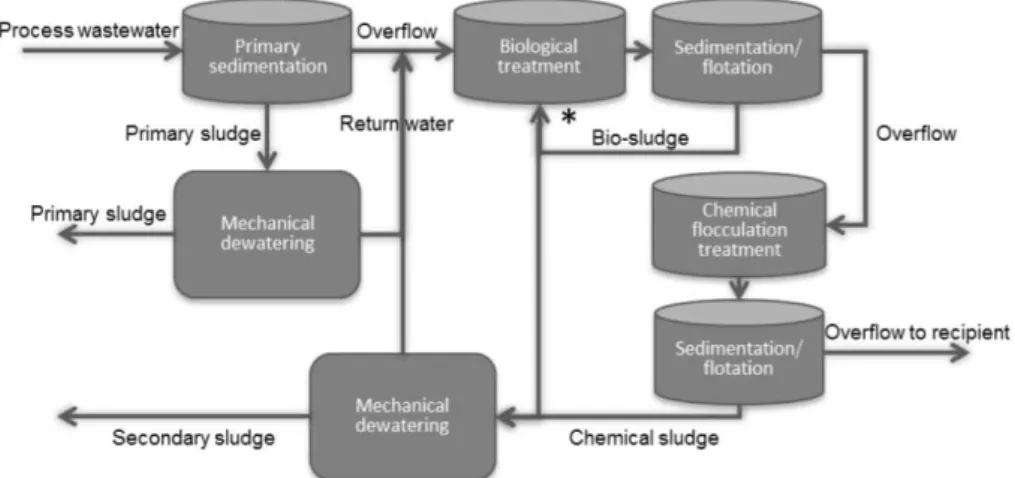
Figure 1.17: Schematic flow chart for wastewater treatment during paper production (Hagelqvist, 2013)……… 21
Figure 1.18: Recycled paper mill sludge (Abdullah et al., 2015)……… 22
Figure 1.19: Red grape pomace……… 25
Figure 1.20: Cider industry distribution worldwide (AICV, 2014)………. 28
Figure 1.21: Apple pomace………. 29
Figure 1.22: Water phase diagram and sub-critical region identification (Möller et al., 2011)……… 34
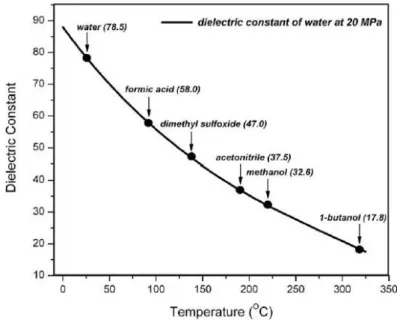
Figure 1.24: Temperature effect on water ionization constant (Sub-critical water as a
green solvent, 2015, Shitu)……….. 36
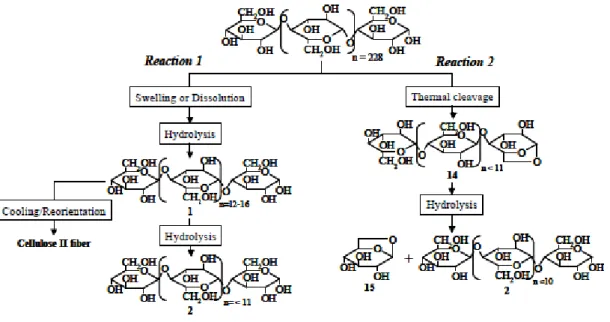
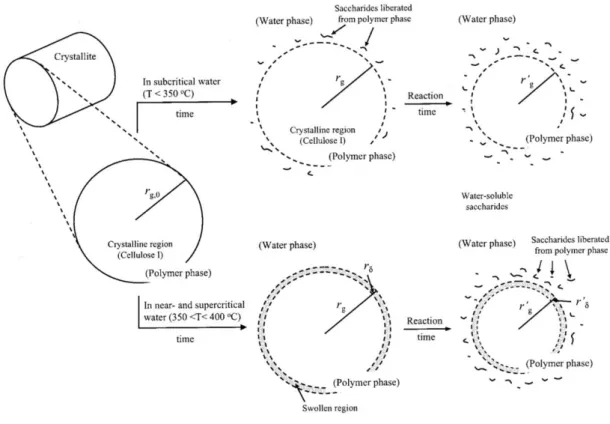
Figure 1.25: Cellulose hydrolysis main reaction pathway (Sasaki et al., 1998)…………. 41 Figure 1.26: Reaction mechanism proposed for cellulose decomposition of microcrystalline cellulose in sub- and supercritical water. Addapted from (Matsumura et al., 2006a; Sasaki et al., 2003; Wu et al., 2008)……….. 42 Figure 1..27: Summarized reaction pathways during cellobiose decomposition in HCW (Kabyemela et al., 1998; Sasaki et al., 2002a; Yu et al., 2013)………... 42 Figure 1.28: Reaction mechanism proposed for the conversion of microcrystalline cellulose at subcritical and supercritical conditions, rg- internal radius. (Sasaki et al.,
2004)……… 44
Figure 1.29: Cellule-water system phase behavior observation (Matsumura et al.,
2006a)………. 45
Figure 1.30: Main reaction pathways of hemicellulose hydrolysis (Cardenas-toro et al.,
2014)……… 45
Figure 1.31: Hydrothermal xylan decomposition pathway in sub-critical water
(Pinkowska et al., 2011)………. 47
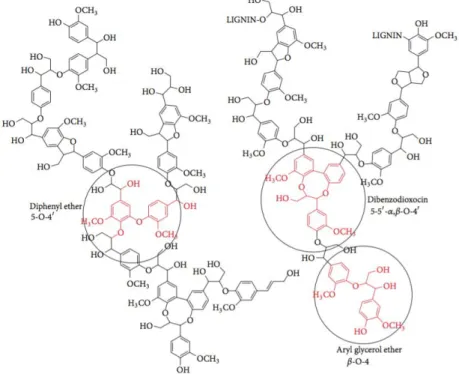
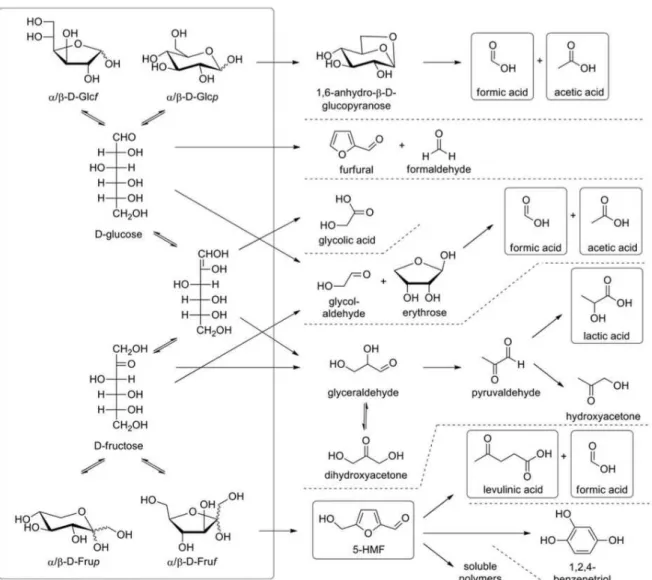
Figure 1.32: Common lignin chemical structure with ether linkages between hydrophenylpropane units (Wang et al., 2013)……… 49 Figure 1.33: Main reaction pathways of glucose and fructose in subcritical water.
(Möller et al., 2011)……… 52
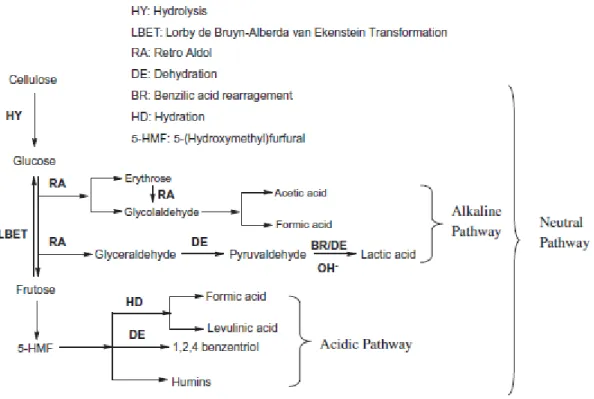
Figure 1.34: General pathways for cellulose hydrothermal decomposition according to acidic, alkaline or neutral conditions (Yin and Tan, 2012)………. 54 Figure 1.35: Main reaction pathway for D-xylose degradation (Sasaki, M.;Hayakawa,
T.; Arai, K.; Adschiri, 2003)……….. 55
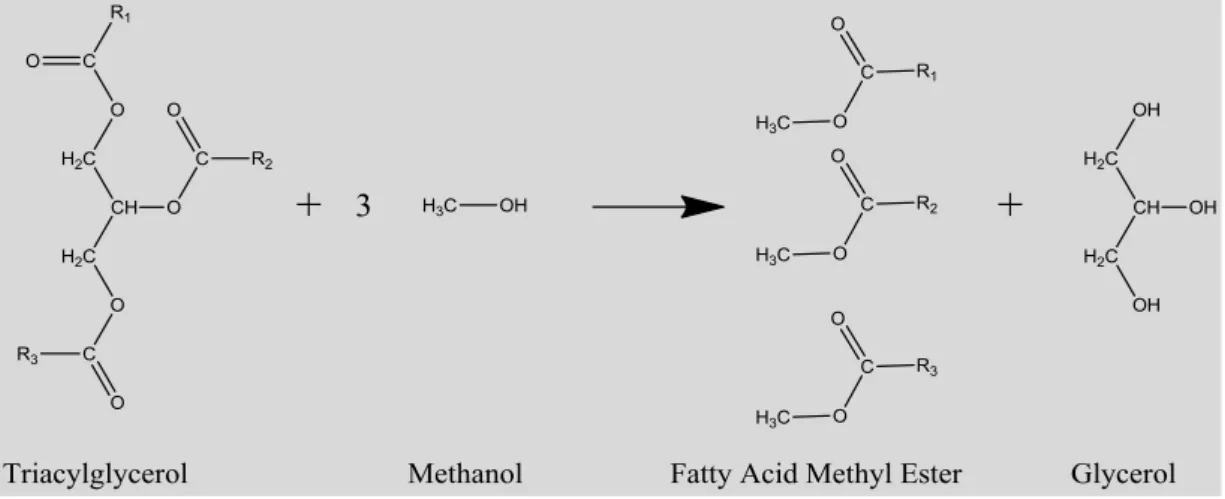
Figure 1.36: Optical microscope picture of Yarrowia lipolytica. (Beopoulos et al., 2008). 58 Figure 1.37: Schematic representation of a lipid body (Martin, S.; Parton, 2006). ………. 59 Figure 1.38: Schematic of the transesterification of triacylglycerols with methanol to produce fatty acid methyl esters (FAME - biodiesel)………. 65 Figure 1.39: Diagram for the proposed integrated bioenginnering system for lignocellulosic residues valorization chain……….. 68
Figure 2.1: Hot compressed water process flow diagram……… 76
100 bar and 5 ml/min……… Figure 3.3: pH variation during HCW hydrolysis experiments of RPS performed at 250
ºC, 200 ºC and 150 ºC……….. 94
Figure 3.4: Batch and semi-continuous process conversions expressed as g of hydrolysed material per 100 g RPS at 100 bar, 5 ml/min and 1h of reaction time………. 96 Figure 3.5: Batch and continuous process yields at 100 bar, 5 ml/min and 1h of reaction
time……….. 98
Figure 3.6: RPS pre-treatment operational advantages for the semi-continuous system
operated at 250ºC………. 99
Figure 3.7: WSC’s compounds and temperature profile using original and milled RPS…. 100
Figure 3.8: Monosaccharides recovery and degradation compounds formation in semi-continuous (A) and batch (B) systems per g of RPS treated……… 101 Figure 3.9: HCW hydrolysis in semi-continuous system at 100 bar and 5 ml/min: global
mass balance diagram……….. 107
Figure 3.10: HCW hydrolysis in batch system at 100 bar: global mass balance
diagram………. 108
Figure 3.11: WSC’s profile content from semi-continuous system experiments
performed at 100 bar and 5 ml/min………. 111
Figure 3.12: Ashes mass balance for the experiment performed at 250 ºC, 100 bar and 5 ml/min in the semi-continuous system………. 114 Figure 3.13: WSC’s profile content from batch system experiments performed at 100
bar………. 116
Figure 3.14: Severity factor as a function of WSC’s recovery in both operational modes.. 126
Figure 4.1: TPC obtained from Folin-Ciocalteu method performed for each temperature applied in HCW treatment at 100 bar and 5 ml/min……… 135 Figure 4.2: Gallic acid extraction profile along HCW treatment time……… 141 Figure 4.3: Chlorogenic acid extraction profile along HCW treatment time……….. 141 Figure 4.4: p-Coumaric acid extraction profile along HCW treatment time……… 141 Figure 4.5: Caffeic acid extraction profile along HCW treatment time……….. 141 Figure 4.6: Resveratrol extraction profile along HCW treatment time……… 141 Figure 4.7: Ferulic acid extraction profile along HCW treatment time………... 141 Figure 4.8: Hydrolysis of GP at different temperatures and 100 bar………... 151 Figure 4.9: Fraction of carbohydrates in the hydrolysate as a function of the temperature
of hydrolysis, at 100 bar……….. 152
Figure 5.1: Liquors recovery during hydrolysis assay. ……….. 164 Figure 5.2: Effect of hydrolysis's temperature on the recovery of water soluble
compounds from AP……… 166
Figure 5.3: Effect of hydrolysis's temperature on the recovery of Total carbohydrates and oligosaccharides recovery from AP……….. 167 Figure 5.4: Effect of hydrolysis’s temperature on the recovery of monosaccharides from
AP. ……….. 167
Figure 5.5: Effect of hydrolysis's temperature on the formation of degradation
compounds from AP……… 169
Figure 5.6: Effect of hydrolysis's temperature on the formation of phenolic compounds
from AP……… 170
Figure 5.7: AP hydrolysates blend obtained from 11 different hydrolysis temperatures
(A) and after homogenization (B)……… 171
Figure 5.8: Growth curves for the five oleaginous yeasts strains on YNB and AP hydrolysates blend obtained between 50-250ºC. ………. 172 Figure 5.9: Comparison of yeast growth on AP hydrolysates………. 174 Figure 5.10: Growth curves of five oleaginous yeasts strains using apple pomace hydrolysates for lipid accumulation……… 176 Figure 5.11: Comparison between growth curves from five yeasts using apple pomace hydrolysates for lipid accumulation……… 177 Figure 5.12: Lipid droplets in Rhodotorula glutini……….... 178 Figure 5.13: Lipid droplets in Rhodotorula mucilaginosa………... 178 Figure 5.14: Lipid droplets in Rhodotorula babjevae………. 178 Figure 5.15: Lipid droplets in Rhodotorula toruloides……… 178 Figure 5.16: Lipids droplets in Yarrowia lipolytica………. 179
Figure 5.17: WSC’s recovery for the 4 different temperatures……… 180
Figure 5.24: Lipid droplets observed in Rhodotorula mucilaginosa after growth on apple pomace hydrolysate obtained at 150 ºC………... 185 Figure 5.25: Lipid droplets observed in Rhodotorula mucilaginosa after growth on apple pomace hydrolysate obtained at 170 ºC……….. 185 Figure 5.26: Lipid droplets observed in Rhodotorula mucilaginosa after growth on apple pomace hydrolysate obtained at 190 ºC……….. 185 Figure 5.27: Rhodotorula mucilaginosa growth curve in the presence of apple pomace hydrolysate obtained at 130 ºC and glucose (scale-up)……… 187 Figure 5.28: Lipid droplets in Rhodotorula mucilaginosa after grown on apple pomace
hydrolysate obtained at 130 ºC……… 188
Figure 5.29: Lipid droplets in Rhodotorula mucilaginosa after grown on glucose (control
assay)……… 188
Figure 5.30: Biomass obtained for carotenoids quantification. A- Control assay on glucose, B- Cells grown on apple pomace hydrolysate……… 189 Figure 6.1: Experimental apparatus………. 197 Figure 6.2: Effect of temperature on FAME yield………... 199 Figure 6.3: Effect of residence time on FAME yield……….. 200 Figure 6.4: Effect of the oil to methanol molar ratio on FAME yield………. 201 Figure 6.5: Effect of the temperature of operation of the first separator, kept at P = 12
MPa, on the recovery of FAME……….. 202
Figure 6.6: Effect of the pressure of operation of the first separator, kept at T = 60 ºC, on
the recovery of FAME………. 203
List of Tables
Table 1.1: Paper sludge elementary analysis produced from different sources (value of
wastepaper for comparison)……….. 23
Table 1.2: Average chemical composition of red grape pomace (Dwyer et al., 2014;
Teixeira et al., 2014)………. 26
Table 1.3: Grape pomace skins average chemical composition (Dwyer et al., 2014)……….. 27
Table 1.4: Average chemical composition of apple pomace (Sato et al., 2010)………... 30
Table 1.5: Water physical and chemical properties at different conditions (Möller et al.,
2011; Wu et al., 2008)……….. 37
Table 1.6: Oleaginous yeasts species for single-cell oil production using lignocellulosic
residues………. 59
Table 1.7: Using agro-industrial wastes as substrates to yeast carotenoid production………. 64
Table 2.1: Yeast strains………. 83
Table 3.1: RPS chemical characterization……… 91
Table 3.2: Degradation compounds formation in semi-continuous and batch systems……… 102
Table 3.3: Oligosaccharide formation and monosaccharide recovery in semi-continuous
process after 60 min of reaction, 100 bar and water flow rate of 5 ml/min……….. 103
Table 3.4: Oligosaccharides formation and monomers recovery in batch process after 60
min of reaction time and at 100 bar and 5 ml/min……… 103
Table 3.5: Characterization of WSC’s obtained in semi-continuous and batch systems……. 105
Table 3.6: Lignin mass balance for the experiments performed at 100 bar and 5 ml/min in
the semi-continuous system………. 112
Table 3.7: Lignin mass balance for the experiments performed at 100 bar and 5 ml/min in
batch system……….. 118
Table 3.8: WSC’s obtained during 60 min of reaction time for all the temperatures in study.
Experiments performed at 100 bar……… 120
Table 3.9: Oligosaccharides obtained during 60 min of reaction time for all the
temperatures in study. Experiments performed at 100 bar……… 121
Table 3.10: Glucose obtained during 60 min of reaction time for all the temperatures in
study. Experiments performed at 100 bar………. 122
Table 3.11: Xylose obtained during 60 min of reaction time for all the temperatures in
Table 3.12: Soluble lignin obtained during 60 min of reaction time for all the temperatures
in study. Experiments performed at 100 bar………. 124
Table 3.13: Severity factor calculations for the operational conditions in study for both
operational systems………... 125
Table 4.1: Degradation kinetics parameters for phenolic compounds in subcritical water
(Khuwijitjaru et al., 2014)………. 136
Table 4.2: Phenolic compounds contents of several grape pomaces from different red
grapes varieties………. 137
Table 4.3: Phenolic compounds contents obtained from GP pomace extracted using several organic solvents as well as the comparison with the highest content verified when using
HCW………. 138
Table 4.7: Phenolics compounds recovery during HCW treatment for 35 minutes………….. 142
Table 4.5: Composition of GP powder………. 150
Table 4.6: Effect of the carbon source on the growth rate () and optical density (OD) at 72
h for yeast strains………... 155
Table 5.1: Chemical composition of apple pomace (Sato et al., 2010)………. 162
Table 5.2: Carbon sources assimilation profile for the five oleaginous yeasts strains
(w-weak; d-delayed growth) (PYCC databank)(Leandro et al., 2009)……….. 171
Table 5.3: Oligosaccharides and monosaccharides content in the liquors obtained at 4
different temperatures……… 181
Table 5.4: Total carotenoids and β-carotene production by Rhodotorula mucilaginosa……. 190
Abbreviations, symbols and constants
5- HMF – 5- Hydroxymethylfurfural
AP - Apple Pomace
CO2– Carbon dioxide
DP – Degree of polymerization
DW – Dried weight
et al.- et alli; and others
FAME - Fatty-Acids Methyl Esters
FFA - Free Fatty Acids
Fru – Frutose
g – gram
GAE – Gallic acid equivalent
Glu - Glucose
GC - Gas Chromatography
GP - Grape pomace
HCW – Hot compressed water
i.e. – id est; in other words
K - degree Kelvin
LBET - Lobry de Bruyn-Alberda van Ekenstein transformation
LB – Lipid body
min - minute
mM – millimolar
Pc - critical pressure
ppm - parts per million
RPS – Reclycled Paper Mill Sludge
R2 - coefficient of determination
Ro – severity factor
s - second
scCO2 - supercritical carbon dioxide
SCF - supercritical fluid
T- temperature
t – time
Tb - base temperature
Tc – critical temperature
Ti - operational temperature
TAG – triacylglycerols
UV/Vis - Ultraviolet/Visible
Xyl - Xylose
YNB- Yeast Nitrogen Base
YMA- Yeast malt agar
ºC - degree Celsius
Introduction
1.1.Biorefinary concept- The role of Bioengineering Systems
Sustainability can be seen as a dynamic process with the final goal of achieving a basic supply for
world’s population needs and stabilization by reducing hunger and poverty while adequate living
standards are maintained while preserving Earth’s ecosystem (Kates and Parris, 2003). Most
predictions indicate that oil production peak will be reached in the early twenty-first century resulting in a decrease of oil production at the same time world oil demand will continue to increase. According to the U.S. Energy Information Administration (EIA), emerging economies outside the OECD (Organization for Economic Cooperation and Development) will increase world energy consumption ca. 50% between 2009 and 2035 accounting for 84% of growth in world energy use. Developed OECD nations are expected to account for only 14% (Virmond et al., 2013). Additionally to the oil crisis, according with Meadows et al. with the report “The Limits of Growth” to current days, food consumption will reach a maximum at 2020 along with an increase of the world population to 8600 million people in 2040 at the same time that a sharp decrease of natural sources availability will occur (Arai et al., 2009). These projections will have a strong impact on world’s sustainability forcing industries to seek sustainable and alternative sources for energy and food production (Clarck, J.H;Deswarte, F.E.I.;Farmer, 2009).
During the last recent years, the world has been taking substantial steps into the transition to a biobased economy. The decrease in the availability of fossil fuels, serious problems arising from climate change, policy and economical world crises are steering the world economy into a scenario where material wastes are minimized, new bioproducts are replacing their fossil equivalents, greenhouse gas (GHG) emissions are reduced forcing the society to acquire environmental friendly habits and new live styles. The use of biomass for fuels production could represent a carbon-neutral or near to carbon-neutral lifecycle if the non-renewable inputs during biomass treatment such us fertilizers consumption, harvest and transportation of large amounts to distant locations would be reduced or eliminated (Wu et al., 2005). An economy based on innovative and cost-efficient use of biomass for the production of biobased products and bioenergy should be driven by well-developed, integrated biorefinary systems (Jong and Jungmeier, 2015). According with EIA, biorefining is “the
sustainable processing of biomass into a spectrum of marketable products and energy” (Ruiz et al.,
2013). Three biorefinary systems are currently being developed: (1) the “Whole Crop Biorefinary”,
using cereals or maize as raw material, (2) “Green Biorefinary”, using “nature-wet” biomasses, such
as green grass or immature cereal and (3) the “Lignocellulose Feedstock Biorefinary”, using “nature
-dry” raw material, such as cellulose-containing biomass and wastes (Biorefinary – Systems).
variety of biobased products that can be obtained by biomass feedstock’s (Kamm, B.; Gruber, P.R.; Kamm, 2008).
Figure 1.1: Flowchart model of biobased products from biomass feedstock’s (Kamm, B.; Gruber, P.R.; Kamm, 2008)
1.2.Lignocellulosic materials: Structure and characterization
Plant cell walls are mostly composed by carbohydrate polymers (cellulose, hemicellulose) and an aromatic polymer (lignin). These polymers represent the major constituents of the cell walls in plant cells and are organized into a lignocellulosic structure represented in figure 1.2.
In addition to the main components, natural lignocellulosic materials contain also a small amount of pectin, nitrogenous compounds and minerals. For instance, the element content of wood is about 50 % carbon, 6 % hydrogen, 44 % oxygen, and 0.05–0.4 % nitrogen (Chen, 2014). Detailed information about each one of the main components is described in the next section.
1.2.1.Cellulose
Cellulose has an annual estimated production of 50 billion tones being the most abundant polymer on earth (Wu et al., 2008).It is consisted by carbon (44.44 %), hydrogen (6.17 %) and oxygen (49.39 %). The chemical formula of cellulose is (C6H10O5)n with n is called the degree of polymerization (DP), determined by the number of monomers that compose each cellulose chain ranging from hundreds to thousands or even higher (Chen, 2014).
Figure 1.3: Cellulose molecular structure (Mohan et al., 2006).
A B
As the main component of lignocellulosic wastes, cellulose is a skeletal polysaccharide consisting of a linear chain of several D-glucose units linked by β-1,4- glycoside linkages (Figure 1.3)(Mohan et al., 2006). Glucose chains, also called elemental fibrils are set in parallel and aligned side-by-side in a specific crystalline arrangement forming a beam called the microfibrils. Microfibrils are, in turn, bundled together to form cellulose fibers through covalent bonds, hydrogen bonds and Van der Waals forces (Tomme, P.; Warren, R. A. J.; Gilkes, 1995). Microfibrils are thus composed of elementary fibrils that are further associated with noncellulosic polymers. Each cellulose microfibril has approximately 36 glucose chains (Festucci-Buselli et al., 2007). The degree of polymerization of cellulose chains is around 2,000-25,000 glucose residues (Delmer, 1999) and the fibril contains approximately 60–80 cellulose molecules (Chen, 2014).
Figure 1.4: Cellulose structure and inter- and intra-chain hydrogen bonding pattern. Dashed lines: inter-chain hydrogen bonding; Dotted lines: intra-chain hydrogen bonding (Structure, organization, and functions of cellulose synthase complexes
in higher plants.)
The basic repeating unit of cellulose is cellobiose, the β-(1-4)-linked disaccharide of D-glucopyranose. The multiple hydroxyl groups on the glucose present in one chain of the cellulose structure form hydrogen bonds with oxygen atoms on the same or with a neighbor chain, holding the chains firmly together side-by-side and forming microfibrils with high tensile strength. Two different ending groups are found in each cellulose chain edge. A non-reducing group is present where a closed ring structure is found and a reducing group with both an aliphatic structure and a carbonyl group is found at the other end of the chains (Figure 1.4) (Festucci-Buselli et al., 2007).
wood to as high as 15.000 for cotton (Bobleter, 1994). The rigid structure and extensive hydrogen bond network are responsible for its crystalline structure causing a low-surface area for contact. This makes cellulose hard to be degraded and insoluble in water as well as most organic solvents. Cellulose can be found in different degrees of crystallinity from highly ordered crystalline regions to amorphous ones or with lower order. The degree of crystallinity also varies according with cellulose nature and pre-treatment. For instance, cotton is 70% crystalline and more ordered than wood while regenerated cellulose can achieve a crystallinity of 40% (Wu et al., 2008). Cellulose crystallinity of 90 -100% are found in plant-based fibres such as corn stover or wheat straw and 60–70% in wood based fibres were determined. (Thygesen et al., 2005) . It was reported a cellulose degree of crystallinity in grape skin of 66.1.% for the Touriga Nacional variety (Mendes et al., 2013) whereas for pine wood, depending on weather exposure and the applications of coatings, de degree of crystallinity of cellulose can vary from 22.1 to 63.1% (Lionetto et al., 2012).
Cellulose reactivity depends on its physical and chemical structure. Indeed, crystalline regions tend to react slowly and are chemically more resistant than amorphous regions (Delmer, 1999).
1.2.2.Hemicellulose
Hemicellulose is another main component in plant fiber materials. In association with cellulose in cell wall, hemicellulose is a branched amorphous polysaccharide consisted of several polymerized pentoses (mainly xylose and arabinose) and hexoses (galactose, glucose and mannose) as well as
4-O-methyl glucuronic acid and galacturonic acid residues linked together by β-1,4- and occasionally β
-1,3- glycosidic cobonds (Figure 1.5)(Chen, 2014; Mohan et al., 2006).
Figure 1.5: Main constituents of hemicelluloses (Hansen and Plackett, 2008).
noncrystalline structures, therefore it can be easily hydrolyzed by dilute acid, base and myriad hemicellulose enzymes to monomeric sugars and other valuable chemicals (Dutta et al., 2012).
It is generally believed that hemicelluloses main components are xyloglycans (xylans), mannoglycans (mannans), xyloglucans and arabinogalactans (Ebringerová, A.; Hromádková, Z.; Heinze, 2005). These main components present structural variations differing in side-chain types, polysaccharides distribution, localization and/or glycoside linkages distribution in the macromolecular backbone (Hansen and Plackett, 2008). Further detailed information about each one of the main structures of hemicellulose will be presented in the next sections.
Xylans
Xylan-type polysaccharides are the main hemicellulose components constituting about 20–30% of hardwoods biomass and herbaceous plants. In some plant materials such as grasses and cereals xylans can occur up to 50% (Ebringerová and Heinze, 2000). Therefore, xylans are highly available in vast amounts as by-products from forestry, food, agriculture, wood, and pulp and paper industries (Ebringerova et al., 2005). Among hemicelluloses, xylan was the most abundant component in Vitis vinifera L. red grape pomace stalks (ca. 12%) (Prozil et al., 2012).
In most cases, xylans are heteropolymers with a homopolymeric backbone chain of 1.4-linked β-D- xylopyranose units with short carbohydrate side chains on the 2- or 3-position. These side chains comprise D-glucuronic acid or its 4-O-methyl ether, L-arabinose and/or various oligosaccharides, composed of D-xylose, L-arabinose, D- or L-galactose and D-glucose (Hansen and Plackett, 2008). Depending on xylans primary structure, these can be further divided into two main classes:
homoxylans with a backbone consisted only by D-xylopyranose units linked by β- (1 → 3) or mixed
β-(1 → 3, 1 → 4)-glycosidic linkages and heteroxylans that are polysaccharides with a backbone
composed of 1,4-linked β-D-xylosyl residues where some of these xylosyl residues are substituted with 4-O-methyl α-D-glucuronic and occasionally with α-D-glucuronic acid at position 2, in case of
hardwoods or, as in case of grasses, the xylan backbone is predominantly substituted with α
-L-arabinofuranosyl residues in position 2 or 3. (Mazumder, K.; Peña, M.J; O’Neill, M.A; York, 2012). Heteroxylans with substituents of α-D-glucuronic acid or 4-O-methyl-α-D-glucopyranosyl uronic acid
residues are called glucuronoxylans and heteroxylans with α –Larabinofuranose residues are called
complex heteroxylans such as fucogalactoxyloglucans and arabinoxylans as well as pectic arabinans and galactans, glucomannans, and 1,3 linked glucans (Voragen et al., 1986).
Softwood arabinoglucuronoxylan has a backbone of β-(1→4) linked xylopyranose units (Figure 1.6)
with single-unit side chains of 4-O-methyl-D-glucuronic acid units attached by α-(1→2) bonds, on average one unit per 5-6 xylose units, and L-arabinose units attached by α-(1→3) bonds, on average one unit per 5-12 xylose units.
Figure 1.6: Structure of a heteroxylan hemicellulose - softwood arabinoglucuronoxylan (Shimizu, 2001).
Mannans
Mannans are the major constituents of the hemicellulose fraction in softwoods and show wide spread distribution in plant tissues (Moreira and Filho, 2008). It also represents a major part of hemicelluloses in grape pomace together with galactans (Mendes et al., 2013). The mannan-type polysaccharides of higher plants can be divided in four subfamilies: linear mannan, glucomannan, galactomannan, and galactoglucomanan (De et al., 2001). Each of these polysaccharides present a β -1,4-linked backbone containing mannose or a combination of glucose and mannose residues.
Additionally, the mannan backbone can be substituted with side chains of α-1,6-linked galactose
residues (Liepman et al., 2007).
Linear mannans are homopolysaccharides composed of linear main chains of 1,4-linked β -D-mannopyranosyl residues and contain less than 5% of galactose and they are the major structural units in woods and in seeds of many plants, such as ivory nuts and green coffee beans (Aspinall, 1959). In
galactomannans, the backbone is made up exclusively of β-(1→4)- linked D-mannopyranose residues
in linear chains with side chains of single1,6-linked α-D-galactopyranosyl groups attached along the
chain whereas in glucomannans, the backbone has both β-(1→ 4)-linked D-mannopyranose and β
-(1→ 4)-linked D-glucopyranose residues in the main chain. Both types of mannoglycans have varying
Differences in the distribution of D-galactosyl units along the mannan structure are found in galactomannans from different sources (Moreira and Filho, 2008).
Figure 1.7: Glucomannan strucuture (Shimizu, 2001).
Galactoglucomannans are a more complex hemicellulose mannan-type consisting of a mannose
backbone composed of β-(1-4) linked D-mannopyranosyl units combined with a lower number of β(1
-4) linked D-glucopyranosyl units. Branched to the mannopyranosyl units, there are side groups of single (1-6)-linked α-galactopyranosyl units. In softwood, the galactoglucomannans are O-acetylated at C-2 and C-3 of the mannosyl units (Lundqvist et al., 2002).
Xyloglucans
Xyloglucan is known mainly as a polysaccharide in the primary cell wall of higher plants with the same backbone as cellulose with β-(1-4)-linked D-glucose units but with side chains attached at the hydroxyl group of C6. The side chains consist either of single xylose units or of galactose, arabinose or fucose units (12)-linked to xylose. In softwood, xyloglucan is only a minor compound (Sjostrom;E., 1993).
Arabinogalactanns
Arabinogalactan has a backbone of β-(1→3)-linked D-galactopyranose units and is highly branched at C6 (Figure 1.9). The side chains are composed of β-(1→6)-linked D-galactose units, D-galactose and L-arabinose units or single L-arabinose units and single D-glucuronic acid units. Arabinose is present in furanose and pyranose forms in an approximate ratio of 1:2. (Sjostrom;E., 1993). Most of softwoods contain only small amounts of arabinogalactan amounting to less than 1% by weight of wood (Shimizu, 2001).
Figure 1.9: Arabinogalactan structure.
1.2.3.Lignin
Lignin is the most abundant aromatic natural polymer and confers a rigid structure, impermeability and resistance against microbial attack and oxidative stress on plants (Goldstein, 1981). It presents a complex hydrophobic, nonlinear, highly branched and randomly linked polyphenolic structure consisted by three main monomeric phenylpropane units, also called as monolignols or monomer alcohols precursors (Figure 1.10A) which are linked by ether bonds. (McCarthy, 2000). p-Coumaryl, coniferyl and synapyl alcohols differ structurally from each other by the number of methoxyl groups present on their aromatic ring; they possess zero, one and two methoxyl groups, respectively (Goujon et al., 2003). The proportions of these basic structures vary greatly in different families of plants (Campbell and Sederoff, 1996).
Figure 1.10: (A) Structures of the monomeric phenylpropane precursors of lignin. (B) Corresponding methoxylated forms of phenylpropane precursors of lignin.
Lignin represent 4 - 35% of most biomass composition, 16 - 25% in hardwoods and 23 -35% in softwoods (Bridgewater, 2004). Lignin in softwood is mainly consisted by guaiacyl lignin type containing less sinapyl units whereas syringyl lignins are often found in hardwoods. (Brebu and Vasile, 2010). Softwood lignin generally contains a higher amount of carbon (≈60-65%) than
hardwood lignin (≈56-60% carbon) since hardwood contains more methoxy groups which leads to a
higher oxygen content (Fengel, D.; Wegener, 1984).
The structure of lignin cannot be represented exclusively using simple monomeric units but rather as building blocks to larger and complex molecules such as dimeric and tetrameric ones where certain linkages and some of the general interunit linkages were already identified. (Palmer, 1983). Lignin units are linked by different bond types within the same lignin macromolecule, however, the most
frequent is the β-O-4 ether bond, which is the target of most degradation techniques (Glazer A. W.,
1995).
Unlike cellulose and hemicellulose which are uniform chain structures made up of repeating sugar units, polymerization of lignin (i.e., polymerization of the monomers) was originally thought to occur through three-dimensional random coupling reactions (Fengel, D.; Wegener, 1984). However, further studies using computer-assisted structural would later suggest that a helical conformation was more energetically favored over random structures (Faulon et al., 1994). It was proposed by Fengel et al. a mechanism for lignin polymerization where dimeric structures would be first formed followed by end-wise polymerization to yield branched aromatic polymers (Fengel and Wegener, 1984) These dimeric structures are suggested to combine to form molecules with DP lower than 20, which then combine to form larger molecules that eventually make up the lignin macromolecule (Wayman and Obiaga, 1974).
A
A structural lignin model is presented in Figure 1.11 and it only describes a hypothetical structure
inferred from the research developed in nearly two decades. Lignin is an amorphous polymer network
whose main units are linked to each other by the irregular coupling of ether and carbon-carbon bonds.
Therefore, different biomass natures or even lignin that was isolated from the same raw material but
using different delignification methods, would lead to a final product with different functional groups
composition. Therefore, due to lignin complexity and high heterogeneity, it is extremely complicated
to define a lignin model which truly defines its main structure.
Due to its complex composition and structure, lignin thermal decomposition occurs over a broad temperature range from 200 ºC to 500 ºC since different oxygen functional groups from its structure have different thermal stability, thus, their scission will occur at different temperatures (Brebu and Vasile, 2010; Saeed, A.; Fatechi, P.; Ni, 2014; Wahyudiono et al., 2013).
1.3.Biomass valorization: Added value by-products
Biomass can be categorized in four main groups: agriculture, forest, municipal solid wastes and others which includes fast-growing plants, short-rotation crops, herbage plants and ocean biomass (Cuiping et al., 2004). Main biomass component proportions (cellulose, hemicellulose and lignin) varies largely depending on the type, source and species of the biomass (Pauly and Keegstra, 2008). (Pérez et al., 2002). However, typical biomass, wood and grass plants contains approximately 40-50% of cellulose, 20-30% of hemicellulose, 20-28% of lignin and small percentages of other compounds such as mineral (potassium, sodium, calcium, etc.) and organic extractives such fats, proteins, phenolics, pectines, resins, essential oils, among others (Wu et al., 2008).
Regulatory agencies are increasingly stringent in the application of environmental laws and regulations considering the pollution of agricultural waste streams and the application of toxic solvents during processing in such a way that, nowadays, it has become a public concern. Therefore, there is an urgent need to identify alternative processes capable to treat waste materials properly and at the same time recover valuable products such as phenolic compounds, water soluble sugars, bio-fuels, organic acids and chemicals with valuable applications in pharmaceutical, cosmetics, food industries (Deng et al., 2012; Mussato et al., 2012; Rodrigues et al., 2006).
1.3.1.Carbohydrate applications
The development of a green alternative method for the production of soluble sugars from agricultural residues has captured the interest of many researchers.
Considering bioprocesses, it is generally accepted that the carbon-source represents an average of 30% of the total production cost. For instance, the cost of a standard medium containing 3% (w/v) of glucose is about 50 €/m3 (Ratledge, C.;Kristiansen, 2006). Considering a production at an industrial scale, it is imperative to reduce this cost to turn the process economically feasible. By using several cheap and readily available agro-residues as an alternative source for carbon, several bio-based products could be produced at a large scale using environmental friendly and competitive bioprocesses (Yang, S; Enshasy, H.E.; Thongchul, 2013).
Ethanol is produced from several agricultural products such as sugarcane, corn, wheat, sugar beet and cassava, by using their rich polysaccharide structure which, after hydrolysis, will supply, totally or partially, the carbon requirements for the fermentation process (Carbohydrates from Biomass: Sources and Transformation by Microbial Enzymes).
1.3.2. Phenolic compounds
Typically, agro-residues generated during handling and processing of fruits, vegetables or forest resources still contains significant amounts of the original plant components such as fruit skins, fruit seeds, flowers, leaves, stems, barks, and roots. These agro-residues represent alternative sources for several added value natural compounds such as phenolics compounds (Martins et al., 2011; Tahir, 2015). Phenolic compounds are plants secondary metabolites synthesized during plant development as well as in response to different external factors such as stress conditions and UV radiation (Fontana et al., 2013). Its structure comprise an aromatic ring, with one or more hydroxyl substituents and present in a wide range of structures, from a simple skeleton of phenolic acids such as flavonols and catechins and more condensed structures such as tannins with molecular weights of 500 up to 20,000 for proanthocyandins (Balasundram et al., 2006). Most phenolic compounds occur naturally in conjugation with mono- and polysaccharides, linked to one or more phenolic groups or even as functional derivatives, such as esters and methyl esters (Harborne, 1989).
Phenolic compounds are divided into two major classes: flavonoids, which are the largest group of plant phenolics and non-flavonoids in which phenolic acids are the most studied group (Pandey and Rizvi, 2009).
Figure 1.12: Different flavonoids structures. Flavonoids basic structure consists of 2 aromatic rings (A and B rings) linked by a 3-carbon chain that forms an oxygenated heterocyclic ring (C ring) (Rice-Evans et al., 1997).
The variations in the phenyl B ring results in the major flavonoid classes:
- Flavonols such as quercetin and kaempferol are mainly found in plants with bright colours, e.g., berries and broccoli (Welch et al., 2008);
- Flavanols or flavan-3-ols including single structures called catechins and multiple-unit structures (dimers, trimers or polymers) such as colorless proanthocyanidins and colorful anthocyanidins (Chai et al., 2015);
- Flavones and isoflavones whose difference is related with the phenyl group location. Isoflavones are mostly found in soy products and the phenyl B ring is located in the 3 position on the C ring (Tsao, 2010);
- Flavanones, mostly found in fresh fruits and their hand-squeezed or industrially processed juices (Gattuso et al., 2007);
Flavones and flavonols are the most widely occurring and structurally diverse flavonoids (Balasundram et al., 2006).
Non-flavonoids includes phenolic acids (C6-C1 skeleton comprising a phenolic ring and an organic carboxylic acid function) such hydroxybenzoic and hydroxycinnamic acids, stilbenoids (hydroxylated derivatives of stilbenes with a C6-C2-C6 structure) such as resveratrol and lignans (consisted of two phenylpropanoid moieties connected via their C8-side chain carbons) (Umezawa, 2003).
Figure 1.13: Structures of hydroxybenzoic acids (A) and hydroxycinnamic acids (B) (Moreno-Arribas, M.V.; Polo, 2009).
Resveratrol is a stilbenoid and a phytoalexin produced naturally by several plants in response to injury or pathogen attack and it is mostly found in grape skins and seeds, especially in red ones, as well as in peanuts, berries and rhubarb. Also known by 3,5,4’-hydroxystilbene, resveratrol can be found in cis or trans configurations as well as glucosylated (Figure 1.14). Trans isomeric form is the most studied and commonly found in plants (Burns et al., 2002).
Figure 1.14: Resveratrol different structures (Burns et al., 2002).
on the prevention or delaying of hearth diseases, ischemic and chemically induced injuries, pathological inflammation and viral infections (Asou et al., 2002).
A wide range of therapeutic properties have been associated to phenolic compounds such as anti-allergenic, anti-inflammatory, anti-microbial, anti-oxidant as reducing agents, inhibiting and delaying lipid oxidation, anti-thrombotic, cardioprotective and vasodilatory effects (Castro-vazquez et al., 2016). It was already demonstrated the relation between the consumption of phenolic compounds and health benefits as well as their emerging role in the prevention of cancer and cardiovascular diseases (Garcia-Salas, 2010). Several studies have been performed about the mechanism of food polyphenols for cancer prevention where it was shown that chemo preventive polyphenols may interrupt or reverse the carcinogenesis process by acting on intracellular signaling molecules network (Link et al., 2010). However, these possible health benefits derived from phenolic compounds would depend on their absorption and metabolism which is directly determined by their structure, conjugation with other phenolics, degree of glycosylation, molecular size and solubility (Balasundram et al., 2006).
1.4. Lignocellulosic residues
The management of wastes, in particular of industrial waste, in an economically and environmentally acceptable routine, is one of the most critical issues facing modern industry, mainly due to the increased difficulties in properly locating disposal places and obeying the extremely stringent environmental quality requirements imposed by legislation. According to modern industrial trends, an eco symbiosis economic efficiency is the key factor for planning modern technological processes, which includes decreasing the waste streams during production and the use of produced waste as by-products or raw materials with higher added values.
recycled paper mill sludge from paper industry, red grape pomace from wine industry and apple pomace from cider industry.
1.4.1. Paper industry: Recycled paper mill sludge
Paper industry is a strategic industry in many countries. However, the production of paper consumes high quantities of energy, chemicals and wood pulp. Consequently, it produces high gases emission levels which are harmful for the environment mainly as CO2 due to energy consumption as well as high amounts of solid wastes, which include wastewater treatment sludges. According to Buswell et al., 1 ton of low-ash paper mill sludge in landfill releases into the environment approximately 2.69 tons of CO2 and 0.24 ton of CH4 (Buswell and Mueller, 1952). In terms of volume, most solids and liquids are originated from the treatment of effluents, although waste derived from primary wood treatment is also produced in large quantities (Likon and Trebše, 2005).
The world’s total paper production was 403 million tons in 2013 and is expected to increase 77 % by
2020 (Likon and Trebše, 2005). Asia, which accounts for 45% with 182 million tonnes of paper produced, is the largest paper producer. Europe with a production of 106 million tonnes and North America with 85 million tonnes, are also significant producers.
Figure 1.15: Worldwide paper production industry distribution in 2013 (PPI PULP & PAPER).
In terms of market value, global paper industry is expected to reach approximately US $256 billion in 2017 and over 66 % of paper production will be recycled (Hetemäki, 2013) The industry is expected to face certain challenges derived by media extension for digital formats, stricter environmental regulation, volatility in raw material prices, and energy inputs. However, increasing literacy rate, recycling, population and economic growth are anticipated to boost the industry. Moreover, new technologies have been launching new challenges with the increasing demand for specialty papers in
Asia
45%
Europe 27% North America
21%
Latin America 5%