THE IMPACT OF FINANCIAL CRISIS ON PORTUGUESE FIRMS’
CAPITAL STRUCTURE
Jéssica Andreia Rocha Lemos
Dissertation submitted as partial requirement for the conferral of Master of Science in Finance
Supervisor:
Prof. Dr. Luís Laureano, Auxiliary Professor, ISCTE-IUL Business School, Department of Finance
Abstract
This study aims to verify the impacts of financial crises in the capital structure for Portuguese companies. The purpose is to study different firm-specific determinants of a sample of general PSI1 Portuguese listed firms at the Euronext Lisbon stock exchange, during the recent crises that endured from 2011 until 2013 and test the impacts on short and long-term debt.
In order to test the changes/impacts on Portuguese firms’ capital structure, the most important theories around capital structure decisions, Modigliani & Miller, Trade-off, Pecking Order and the Agency theory, will be presented.
Among the many determinants that are considered to influence capital structure decisions, size, profitability, tangibility, growth, liquidity and non-debt tax shield, were chosen to test their impacts on Portuguese company. The sample used considers the period from 2005 to 2015 for 33 Portuguese listed firms. A regression analysis will be used to infer about the effects on long-term and short-term debt when the determinants change.
Results obtained support both trade-off and pecking order theories. Short-term debt ratios reported a tendency of increase during the financial crisis while long-term debt registered a decrease.
Keywords: Capital structure, Trade-off theory, International Monetary Fund, Financial Crisis
JEL: G01, G32
Resumo
Este estudo visa verificar quais os impactos das crises financeiras na estrutura de capital das empresas portuguesas. Tem como objetivo estudar determinantes específicas da estrutura de capital das empresas portuguesas do PSI2 geral cotadas em bolsa, durante o período da recente crise financeira, que durou desde 2011 até 2013.
Por forma a testar as mudanças/impactos na estrutura de capital das empresas portuguesas, algumas das principais teorias à volta do tema da decisão da estrutura de capital, tais como, Modigliani & Miller, Trade-off, Pecking Order e Agency Theory, vão ser apresentadas.
De entre as muitas variáveis que são consideradas como afetadoras da estrutura de capital de uma empresa, tamanho, lucrabilidade, tangibilidade dos ativos, crescimento, liquidez e o escudo fiscal da não dívida, foram selecionados para testar os seus impactos nas empresas portuguesas.
A amostra de tempo considerada reuniu informação do período de 2005 até 2015 para 33 das empresas portuguesas cotadas em bolsa. Foi utilizada a regressão linear para testar os impactos que as alterações nas determinantes consideradas como variáveis dependentes têm nas dívidas de curto e longo prazos.
Os resultados obtidos suportam tanto a teoria de Trade-off e Pecking Order. Os rácios para a dívida de curto prazo aumentaram durante o período da crise financeira enquanto o rácio da dívida de longo prazo diminuiu.
Palavras-chave: Estrutura de capital, Teoria de Trade-off, Fundo Monetário Internacional, Crise Financeira
JEL: G01, G32
Acknowledgments
It would not be possible to start presenting the contents of this thesis without, first of all, expressing my gratitude for the persons and institutions that made this study possible. I am grateful for their help and support during this long journey.
This study would not be possible without the help and technical expertise provided by my supervisor, Professor Luís Laureano, for believing in this study and for being always available to provide feedback and give advice, despite my absence sometimes.
I would like to express my gratitude for PwC and Brisa that always showed flexibility and understanding towards a student/worker and my necessities and commitment with this work.
I am in debt towards my colleagues in INDEG-ISCTE. We have started this journey together and, despite all the different lives and realities, you all always encouraged me to finish this project and taught me the true meaning of a group.
I am grateful to my friends that supported me and cheer me up during the difficult times regarding the process of writing this study and that never doubted of my capacities to finish it.
Finally, this thesis is dedicated to my family, specially my parents, and Virgílio. My family for teaching me to believe in myself and in what I am capable of and to always be the best version possible of me. To Virgílio for believing in me, helping me to believe in me and to never give up on a challenge.
Contents
List of Tables ... v
List of Figures ... vi
1. Introduction ... 1
2. Review of literature... 5
2.1. Modigliani & Miller Theory ... 5
2.2. Trade-Off Theory ... 6
2.3. Pecking Order Theory ... 8
1.4. The Agency Theory ... 9
1.5. Firm’s life cycle and financing needs ... 9
1.6. Empirical studies analysis ... 11
1.7. Portuguese Case ... 14
1.8. Firms’ Capital Structure Determinants ... 17
1.8.1. Growth ... 17
1.8.2. Liquidity ... 18
1.8.3. Profitability ... 18
1.8.4. Size ... 19
1.8.5. Tangibility ... 19
1.8.6. Non-debt tax shield ... 20
3. Methodology and Data ... 21
3.1. Research Methods ... 21
3.2. Variables... 21
3.3. Data and Sample... 24
3.4. Descriptive Statistics ... 25
3.5. Empirical Model ... 34
3.6. Methodology of Analysis ... 35
4. Results ... 38
4.1. VIF Test and Pearson Correlation Matrix ... 38
4.2. Regression Results ... 39
5. Conclusions ... 45
6. References ... 48
List of Tables
Table 1. Comparison of Agency Models Based on Manager vs Shareholders ... 7
Table 2. Preferred sources of financing to Managers ... 8
Table 3. Dependent Variables ... 23
Table 4. Independent Variables ... 24
Table 5. Industry Sector Classification ... 25
Table 6. Firms’ Capital Structure – Average Liabilities in % (2005-2015) ... 27
Table 7. Firms’ Capital Structure – Average Liabilities and Equity (2005-2015) ... 28
Table 8. Firms’ average value for Non-Current Assets (2005-2015) ... 31
Table 9. Average Non-Current Assets, Non-Current Liabilities and Equity – Results (2005-2015) .... 33
Table 10. Panel Data Regression on Short-term debt ... 40
List of Figures
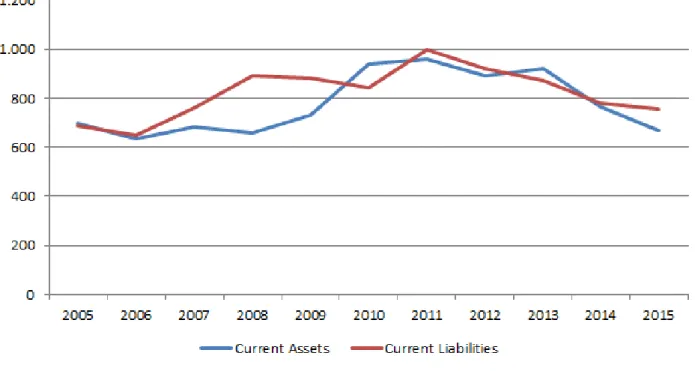
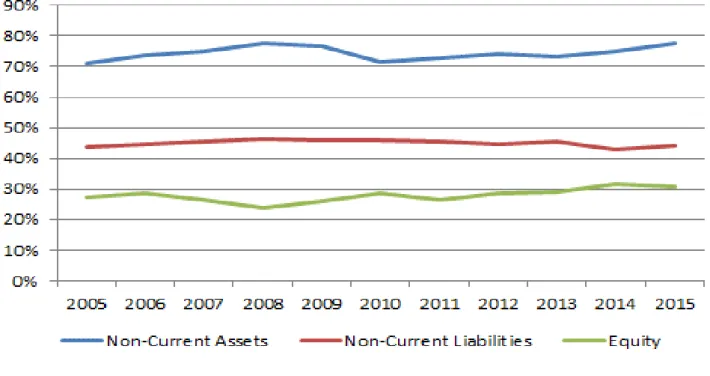
Figure 1. Firm’s life cycle and financing transactions ... 10 Figure 2. Europe: 2013 GDP Growth Forecasts ... 16 Figure 3. Evolution of average Current and Non-Current Liabilities (2005-2015) ... 28 Figure 4. Evolution of average Equity, Current and Non-Current Liabilities as % of Total Assets (2005-2015)... 29 Figure 5. Evolution of average Current Liabilities and Current Assets (2005-2015) ... 30 Figure 6. Evolution of average Non-Current Assets, Equity and Non-Current Liabilities as % of Total Assets (2005-2015) ... 32 Figure 7 . Evolution of average Revenues (2005-2015) ... 34
1. Introduction
The main goal for most corporations is to achieve profit. One variable considered when companies are defining their strategies in order to achieve profit is their own capital structure. However, the process involving the decisions regarding capital structure options, take in consideration variables and factors, internal and external, which have a major impact on financial decisions. The most suitable capital structure for a firm is a question that offers a lot of debate around it.
From time to time, companies have to figure out what to do in terms of their capital structure: raise their equity, debt, a combination of both or also search for other outstanding securities, to increase funding. The decision between equity and debt is influenced by a lot of intern variables, specific aspects of the firm, and external factors, socio-economic factors. Equity is every money invested from the shareholders of a firm and usually is considered to be a long-term investment since it does not generate an obligation of repayment in the future; debt, in this case could be short-term or long-term, is the money that is invested in a firm by external parties, outside investors, has a payment obligation and has an interest rate and time of maturity. Each decision comes with its own set of consequences but the decision itself has a lot to take in consideration to. Regarding the different structure of each firm around the world, the choice is more often to separate management from ownership. Therefore, managers should work to make shareholders confident about their controlling of the firm, resulting in maximizing the shareholders’ wealth and firms’ profit. However, this principle is not always followed by managers, as some prefer to follow their own interests instead of shareholders’. Regarding this, there have been numerous studies and theories around capital structure decisions.
Firstly, Modigliani & Miller (1958) explained their theory about capital structure and investment. This study was the basis for the beginning of the discussion around the determinants that mostly affect the capital structure of firms. There is no agreement on the best capital structure as Myers (2001: 81) says: “There is no universal theory of the debt-equity choice, and no reason to expect one”. There are a range of theories that try to answer to this dilemma, the main two being the Trade-Off Theory and the Pecking Order Theory, but none of them is more certain than the other.
Finance experts have recognized through the years the determinants that affect capital structure and the current problem is to evaluate what impact they cause in the firm’s value. During times of crises, for instance, there are voices that defend that more regulation to the financial sectors will bring more confidence to the markets and, consequently, for investors. Nevertheless, a strict regulation will impact the financial sector in terms of liquidity and therefore the markets and their investors.
Additionally, the discussion around capital structure evolved from the firm to the environment, the economy they belong to.
Following the mentioned before, a firm’s capital structure can be influenced by internal and external factors. Among external factors we have the macroeconomic environment (Lane & Milesi, 2000).
According to Alves & Francisco (2015), since the beginning of the century, three major crises occurred: the dot.com bubble, subprime crisis and European sovereign crisis. Per Alves & Francisco (2015), the dot.com bubble occurred simply inside the USA and resulted from the irrational behavior verified in investors; the subprime crisis, the major crisis among the three mentioned before, achieving global scale, resulted from the deregulation of financial markets, financial innovation, defaults in the supervisory systems, speculation stimulated by monetary policies and the poorly designed management compensation schemes; the European sovereign crisis was the result of expansionary fiscal policies implemented in countries with low economic growth levels.
The financial crisis that hit Europe in 2008 and lead to a request for an IMF assistance program for Portugal back in 2011, could show how the macroeconomic environment, that during this financial crisis was severely affected, can impact the capital structure for Portuguese firms, particularly the listed ones, as the crisis had major impact on the macroeconomic environment. Per Atici & Gursoy (2011; 72): “The latest global financial crisis began in July 2007 with the collapse of
the two hedge funds of Bear Stearns. This collapse has revealed the so-called subprime mortgage crisis in a fragile financial environment of increasing mortgage delinquencies and foreclosures in the U.S., deepened, and widened in September 2008, by the bankruptcy of Lehman Brothers.” The IMFs’
April 2014 3WEO4 report states that two distinct crises occurred in the recent period. A global crisis affecting countries and companies around the world and a European. The nature of the recent global financial crisis acted as a starting point for researching and studies towards credit supply conditions and economic growth. During 2011 and 2012, the world economy suffered a serious slowdown, and only in 2013 indicators showed signs of recovery in advanced economies with the stabilization of activity because of the politics imposed, and a picked up in emergent markets and developing countries, according to the IMF (2013).
The recent financial crisis provides an opportunity to study the impacts of the macroeconomic environment in the capital structure of companies. Studies around the US market have found that an obstruction caused by financial crisis on capital markets led companies to postpone their expansion plans during crisis due to the demand for short term debt instead of long term debt (Custódio et al.,
3 The website link is http://www.imf.org/external/pubs/ft/weo/2014/01/pdf/text.pdf 4 World Economic Outlook
2013). Also, the same effects can occur to banks, the supply, which proves that decisions taken by firms during crises could also be related with the fact that banks are more willing to offer short-term debt solutions despite long term. In fact, lending in 2008 was 38% lower than in the year before for long-term options. The drop was equal to financial services firms and non-financial firms (Ivashina & Scharfsteion, 2010).
This study tests the determinants of capital structure and the relationship they have with Portuguese firms in two separate periods of time: one before the crisis (2005 to 2007), one during the crisis (2008 to 2012). The study also focuses a period, after crisis, in which Portugal asked for IMFs’ assistance for economic matters (2013 to 2015). The sample consists of 33 non-financial PSI general Portuguese listed firms on the Euronext stock exchange, with the objective to verify the effects of financial crisis on Portuguese firm’s capital structure from 2005 to 2015 and to give an overview of the impacts of the IMF’s politics implemented during 2011 and 2013. The period chosen contains the year of 2008, when the global crisis was affecting Europe. To evaluate the effects of 2008s’ global crisis on the capital structure of non-financial Portuguese firms, six independent variables were chosen (size, profitability, tangibility, growth, liquidity and non-debt tax shield) to explain the two dependent variables of this study: short-term and long-term debt.
Some work has already been done such as the impact of the financial crisis on the determinants of capital structure (Alves & Francisco, 2014), but not linked to the specific case of the impacts in Portuguese companies related to the IMF’s politics. This study because of the mentioned before has two main questions to be answered:
Has the global financial crisis of 2008 affected Portuguese firms’ capital structure?
Has the assistance program held by the IMF throughout the years (2011 until 2015) impacted the decisions regarding firm’s capital structure?
To answer the questions formulated, this study will be divided as follows.
After the introduction, the second chapter of this study is a literature review of the main theories regarding capital structure decisions and reviews some of the empirical studies regarding capital structure determinants. Moreover, this chapter provides justification on the choice made in terms of the determinants selected among the many that several studies consider to affect a firm’s capital structure, to study and to get results around the two questions formulated before for Portuguese firms analyzed.
The third chapter presents the methodology, data used and the variables in study and gives a descriptive analysis from 2005 until 2015 of the sample selected to test. Hypotheses and regression models are also presented in this section.
The fourth chapter includes the interpretation of the results obtained by carrying out an empirical analysis based on estimation and the discussion of its findings.
In the final part of this study, chapter five, the results obtained before are considered and an understanding and analysis on them regarding the theories mentioned in the previous sections, the Trade-off and Pecking Order theory, is carried out in order to provide conclusions, limitations and recommendations for future research and also to contribute to the existing researches on the impacts of external factors to the capital structure of firms.
2.
Review of literature
Every firm must deal with the decision regarding the choice of the optimal capital structure to achieve profit. This decision and the variety of determinants affecting these decisions led to a series of studies trying to answer which determinants to choose when deciding between debt and equity, but none of them determining an optimal level of debt. Sheikh & Wang (2011) mentioned that the absence of the answer regarding the more suitable determinants to choose is explained by the different views and realities that these theories express in their focus on explaining capital structure decisions.
The literature review analysis will present a summary of the most important theories in which the determinants of the choice of capital structure are based: Modigliani & Miller, Trade-off theory, Pecking Order theory, Agency theory and other theories. This section views also some of the important aspects of the Portuguese case for the study being carried out such as work that has already been done and some important features regarding the period analyzed. Additionally, this section reviews some of the results suggested by some empirical studies in the matter of capital structure decisions and literature regarding the independent variables selected to study the impacts of the recent financial crisis of 2008 on the capital structure of Portuguese firms.
2.1. Modigliani & Miller Theory
In 1958, Modigliani & Miller started the discussion involving the capital structure of companies by publishing the M&M Theorem. They proposed that under the assertion of a perfect capital market, financing decisions are irrelevant to firms due to the fact that in a perfect capital market, there are no agency costs, taxes, financial distress and bankruptcy costs. “M&M Proposition I: In a Perfect capital market, the total value of a firm is equal to the market value of the total cash
flows generated by its assets and it’s not affected by its choice of capital structure” (Berk & Demarzo,
2013: 162).
Without taking in consideration the market imperfections, M&M concluded from their analyses that it would not be relevant for a firm in the process of deciding between raising its equity or its outstanding debt, in response to their needs. “M&M Proposition II: The cost of capital of levered
equity is equal to the cost of capital of unlevered equity plus a premium that is proportional to the market value debt-equity ratio.” (Berk & Demarzo, 2013: 162). On the other hand, the value of a firm
difference is, as said in the second proposition of M&M theorem, the market value of the debt-equity ratio.
Afterwards, the authors included the influence of taxes as a relevant variable to the decisions regarding the capital structure of a firm (Modigliani & Miller, 1963). After the findings by M&M, the research on capital structure focused on whether financial decisions became relevant if the assumptions regarding those decisions are more relaxed.
2.2. Trade-Off Theory
Due to the assumption that capital markets are perfect, M&M ignored the agency and bankruptcy costs of debt. The existence of these costs lead to a trade-off between equity and debt.
The Trade-Off Theory states that there is a certain amount of debt that maximizes the value of a company. “(…) the total value of a levered firm equals the value of the firm without leverage plus
the present value of the tax savings from debt, less the present value of financial distress costs (…)”
(Berk & Demarzo, 2013: 495). Mathematically, according to Gonçalves & Neves (2015), this theory is represented as follows:
VL = VU + Present Value 5– Present Value 6± PV (Agency costs/Benefits of Debt) (i)
VL = value of a company
VU = value of the unlevered company
Modigliani & Miller (1963) concluded that if firms take into consideration corporate taxes, debt would influence the value of the firm, that is, an increase in the value of a firms’ debt would increase the value of the firm since debt is tax-deductible.
Companies each year pay taxes after the deduction of the amount of interest expenses they had during the year to their profits. These interest costs reduce the amount of corporate tax paid by the firm and because of that, debt can be seen as a benefit to the firm but this benefit only applies to companies with profit. Firms that have a large non-debt tax shield could be less interested in benefit from debt tax advantages than others (DeAngelo & Masulis, 1980). Therefore, firms should find a
5 Interest tax shield 6 Financial distressed costs
balance in order to achieve an optimal point of leverage to prevent the firm to go bankrupt if its levels of debt became unsustainable. (Gonçalves & Neves, 2015).
Bankruptcy (which is the second factor in the formula above) costs refers to the direct costs, such as legal fees and managerial time spent in administrating these matters and indirect costs like inability for the firm to obtain credit or to issue securities (Warner, 1977). There is a relation between the amount of debt a company owns and the risk for the investor. When a firm goes bankrupt, the hypothesis for a debtholder to lose part or all the investment is very high. To account for that, they ask for a higher rate of return. The increase in the cost of capital can lead to a financial distress. Excess of debt could lead companies to a situation where they are not capable to honor their agreements with debtholders (Brealey et al., 2010; Muijs. 2015).
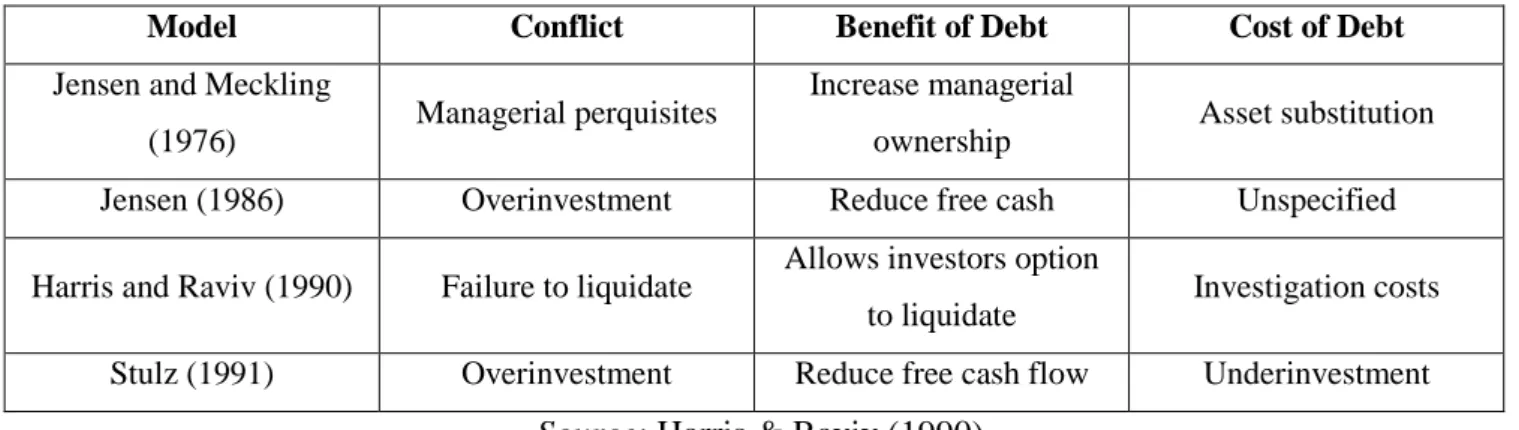
Finally, research by Jensen and Meckling (1976) identified two different types of agency conflicts/costs: conflicts between managers and shareholders and between bondholders and shareholders. Harris & Raviv (1991) gave us an explanation about the reasons for these conflicts. In Harris & Raviv (1991), as in Stulz (1990), managers always want the operating even if liquidation was preferred by investors. They disagree over operating decisions. In Stulz (1990), managers are characterized and assumed to always want invest, even though, paying out cash is better for investors. Related to manager-shareholder conflicts, they occur because of the separation of ownership, managers do not obtain the total gain of their improvements in terms of firm’s profit which means that they have an incentive to devote loss effort to manage the firm’s resources and to manage them to their own benefit (Jensen & Meckling, 1976).
Table 1. Comparison of Agency Models Based on Manager vs Shareholders
Model Conflict Benefit of Debt Cost of Debt
Jensen and Meckling
(1976) Managerial perquisites
Increase managerial
ownership Asset substitution
Jensen (1986) Overinvestment Reduce free cash Unspecified
Harris and Raviv (1990) Failure to liquidate Allows investors option
to liquidate Investigation costs Stulz (1991) Overinvestment Reduce free cash flow Underinvestment
Source: Harris & Raviv (1990)
Shareholder and bondholder conflicts arise because of the type of contracts and privileges they can get and the others cannot. For example, the rate of return for debtholders is agreed upon the interest rate, while for shareholders it is associated with the firm’s profits and thereby is much more volatile.
From the standpoint of this theory, firms should find a balance having in one side the benefits of tax shield and on the other the costs of financial distress and measure the impacts on corporate financing.
2.3. Pecking Order Theory
The Pecking Order Theory is one of the most influential theories of corporate capital structure. It is based on the acknowledgement of the problem related to asymmetric information. Per Myers and Majluf (1984), there is a tendency for firms to prefer internal sources of funds rather than external due to adverse selection and information asymmetries. Myers and Majluf (1984) stated that there are three fund sources: debt, equity and retained earnings. When the internal cash flows generated by the firm are not enough to cover the costs, debt is preferred to equity. There is no optimal debt ratio. The theory provided a comparison between three fund sources and the timing in which a firm uses one instead of other and the fact that because of the information asymmetries, for an outside investor, equity becomes riskier than debt. Insiders will use the information they know for their personal interests: they will issue equity when they perceive stocks are being higher evaluated and will go for debt when stocks are perceived as undervalued.
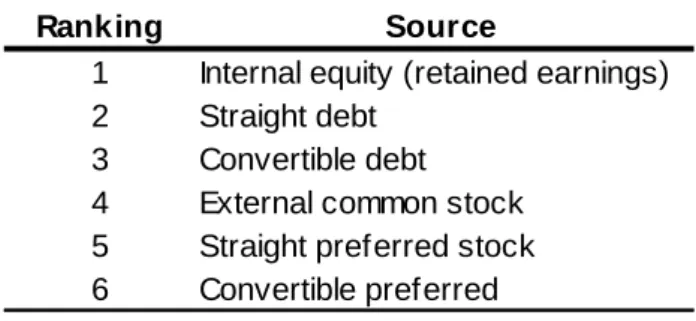
Pinegar & Wilbricht (1989) decided to do a survey in which they asked U.S. industrial firms managers what kind of financing they prefer to use. The answer would be given by ranking six different sources of financing from the most preferred to the least preferred:
Source: Pinegar & Wilbricht (1989)
The results obtained are a mirror of the value that managers give to control and flexibility, and due to asymmetric information between inside and outside information. Managers will choose the financing forms that give them more confidence and also that issue less costs to their firms.
Ranking Source
1 Internal equity (retained earnings) 2 Straight debt
3 Convertible debt 4 External common stock 5 Straight preferred stock 6 Convertible preferred
1.4. The Agency Theory
Per Reis (2011), conflicts of interest may arise from firms with higher level of debt – agency costs. These conflicts happen between shareholders and bondholders (Jensen & Meckling, 1976). In one side, shareholders have their equity in the company to value and tend to favor actions that will lead to payout of dividends. On the other side, bondholders tend to take less risky decisions to receive their interest payment without any difficulties.
Agency costs can appear as higher interest rates on debt if bondholders believe that shareholders might take actions that could be harmful to them in terms of their payments. Bondholders may add covenants to the operations to protect their earnings. These covenants affect a firms’ flexibility in terms of decisions. Following this idea, firms with a larger dimension will value less flexibility rather than smaller firms. In times of crisis, the perception of these costs could be higher since debt becomes more expensive.
Jensen (1986) says that firms can generate free cash flows very often. Over that cash flows managers can decide how to spend/invest them. He argues that as higher as cash is in managers power decision, they tend to pursue their own interests. Therefore, firms can limit the amount of cash in the hands of managers by increasing leverage.
1.5. Firms’ life cycle and financing needs
Many developing theories, studies and research have been carried out in order to understand the behavior of firms regarding capital structure decisions. According to the literature (e.g. Damodoran, 2001), firms have five life stages and in each stage the tendency for seeking for more debt or more equity vary. The figure below summarizes the five stages of the firm’s life cycle:
Source: Damodoran (2001)
Stage 1 is where startup companies stand. The early stage of life means that firms are constituted by owner’s equity and almost no bank debt. At this stage of life, firms are attracting customers and conquering market share. At stage 2, firms have already established their market share and their funding needs increase as the internal cash flows generated in stage 1 (owner’s equity and almost no bank debt) may not be sufficient to run the firm. At this stage, firms will start to get the attention of business angels and their potential investment in the firms’ capital structure. Stage 3 is the stage of high growth, expansion, and firms tend to seek for more debt to compensate the cash flows generated that, at this stage, are not enough to respond to current operations. Stage 4 is a stage of mature growth. The cash flows that firms have generated are from past investments and there is no more need to seek for future investments. Stage 5 describes firms that are not growing anymore, and are working with their own resources, without the need for further investment, since they are working with stable growth rates. Stage 6, the last stage, firms are showing a decrease in their investment returns, a decrease of their market presence and the competitors with innovating ideas/products take their market value and share.
Not all firms have these 6 stages during their existence. Many start-up firms fail, and do not survive or spend their entire existence as a small privately held business for their entire life. Another case could be of a small firm whose capital will rise externally and will go very fast but with no access
to capital markets by choice and/or need. At least some firms will succeed all the way through, to start another cycle when reaching stage 6 by launching new products and/or services, expanding to other markets, etc.
In this study the sampled firms have passed at least the first 3 stages, and have the dimension and position in the market to access all types of capital and investment being only constrained by problems in capital market itself.
1.6. Empirical studies analysis
In the introductory part of this study, some work has already been done among the study of capital structure in Portugal such as the study of the determinants of capital structure and the 2008 financial crisis, applied to Portuguese SMEs (Proença et al., 2014), and capital structure of Portuguese firms during crisis using descriptive analysis (Reis, 2011). Similar studies have been carried out for other countries such as the case of non-financial firms in the Netherlands by Khademi (2013). This section has the purpose to analyze some studies that focused on the problem of capital structure decisions and shared their findings in terms of what influenced, in each situation, the capital structure of companies.
Booth et al., (2001) applied the study of capital structure decisions to developing countries to analyze which capital structure theory is portable across countries with different institutional structures, using a sample of firms from 10 developing countries. The results obtained showed that the variables relevant to explain capital structure decisions in Europe or in the US7 are the same, even though there are several institutional differences between developed and developing countries. Results consistent with Pecking Order Theory were found since the more profitable the firm the lower is the debt ratio, supporting the existence of asymmetric information and that external financing is costly and therefore not chased by firms. Another variable that obtained a higher role in capital structure decisions according to the study was asset tangibility, affecting short-term and long-term debt differently. As Booth et al., (2001: 118) stated: “(…) Generally, the more tangible the asset mix, the
higher the long-term debt ratio, but smaller the total-debt ratio.”, meaning that as a firms’ tangibility
increases, although the long-term debt increases as well the total debt ratio falls, that is, the substitution of long-term debt for short-term debt does not occur in the same percentage.
Deesomsak et al., (2004), investigated the determinants of capital structure for firms located in the Asia Pacific region, in four different countries: Thailand, Malaysia, Singapore and Australia. To
assess the determinants of capital structure an OLS8 estimation was carried out, considering the period of time from 1993 until 2001. Since the period analyzed contained the year of 1997, the year of the Asian crisis, the study also investigated the impact of this crisis on capital structure decisions. The independent variables used were: tangibility, profitability, growth opportunity, firm size, non-debt tax shield, liquidity, earnings and volatility/risk and share price performance. The results showed a positive effect from the variable size and a negative from growth opportunities, non-debt tax shield, liquidity and share price performance on leverage. The outputs obtained also showed that the determinants of capital structure vary across the different countries of each region considered in the study. In the year of 1997, the relation between firm specific determinants varied between the period before and after crisis. Deesomak et al., (2004) concluded that the capital structure of a firm is not only the result of the characteristics of the firm, but also a reflection of corporate governance, legal institutions and economic environment in which they operate.
Muijs (2005), studied the impact of 2008 financial crisis on the relationship between firm-specific determinants of capital structure using regression analysis, considering the period from 2008 until 2012 and using a sample of 39 Dutch listed firms on the Euronext Amsterdam stock exchange. The firm-specific determinants used were: firm size, profitability, tangibility, growth and income volatility. The results indicated a preference for the Pecking Order Theory instead of the Trade-off Theory and that the relations found are affected by the crisis. For the sampled period, Muijs concluded that short-term debt is mostly influenced by a firms’ asset tangibility, while long-term debt is mostly influenced by firms’ size. In terms of the level of short-term and long-term debt, a rise was observed in the starting year of the crisis.
Reis (2011), studied the capital structure of Portuguese firms within a crisis. In order to do that, he selected the 16 largest non-financial Portuguese firms listed on the PSI-16 and gathered data from 2006 until 2010 from the financial statements, financial annual reports and market data and carried out a descriptive analysis, focusing on their levels of equity and debt within their capital structure. During 2006 until 2010, Reis (2011) observed that most firms retained most of their earnings which conducted to a preference towards the Pecking Order Theory: under the uncertainty and asymmetrical information, firms will prefer to use internal financing instead of taking external financing, paying higher interest rates and, in some circumstances, see their external financing lose value. Additionally, some evidence was found towards the Trade-off Theory in terms of the tax advantages of debt. The results show that the average tax shield for the sample of firms reached in 2008 the highest amount. 2008 was the peak of the financial crisis in Europe and in Portugal. Some
evidence was also found in terms of the amount of debt generated through the years in the sample of firms studied by Reis, which was very conservative. This could be explained by the risk of bankruptcy and financial distress that is associated with times of crises and that leads to agency costs.
Khademi (2013) runs an empirical analysis on the capital structure of a sample of 12 firms, from 4 different industrial sectors including: food producers & processors, support & services, construction and industry. They are included in the Euronext NV, in Netherlands. The analysis was carried out from 2004 to 2011, including the period of 2008s’ global financial crisis. The methodology used was panel data. The dependent variables selected were: total debt, short-term debt and long-term debt. The independent variables used were: profitability, liquidity, NTDS9, size and tangibility. Long-term debt results showed a high dependence on growth, size and tangibility before the crisis. During the crisis, long-term debt shows a high dependence on liquidity and profitability but not on growth. On the other hand, short-term debt was correlated to liquidity and profitability before the crisis and after, with liquidity, NTDS, size and tangibility. The results showed that Netherland firms used more long-term debt rather than short-term debt during the years in study. The independent variable liquidity after the period of crisis became important to explain leverage decisions.
Proença et al., (2014), investigated the determinants of capital structure for Portuguese SMEs10 in order to study the effects of the 2008 financial crisis on their capital structure. The sample considered 12.587 Portuguese SMEs and a period from 2007 until 2010. The study used three dependent variables: total debt to assets, and its ratios decomposed according to the maturity of debt, short-term debt and long-term debt. The capital structure determinants (independent variables) used by the authors were: asset structure, non-debt tax shield, size, return on assets, growth opportunities, liquidity, cash flow, legal form, size according to the categories of SMEs and a crisis period dummy. The results obtained indicated that the variables that impacted the dependent variable were mostly: liquidity, asset structure and profitability. A negative relation between debt ratios and profitability accords to the Pecking Order Theory, Portuguese SMEs prefer internal financing rather than external due to the higher risks they face and agency costs. The determinant asset structure presented different signs for the relation with debt: negative for short-term debt and positive to long-term debt. This result is consistent with the Trade-off Theory that suggests companies with more tangible assets are expected to issue more debt using the same tangible assets as collateral in case of failure. Companies with poor tangible asset structure tend to issue less debt due to this collateral factor. The results showed also a tendency for the debt ratio to decrease after the financial crisis. According to the results
9 Non-debt tax shield
obtained, Portuguese SMEs’ capital structure could be explained by both the Pecking Order and Trade-off theories.
Alves & Francisco (2015) studied the impacts on the debt-equity choice in terms of firms’ capital structure, throughout the recent financial crisis: dot.com bubble, subprime crisis and European sovereign debt crisis. At the firm-level the variables used were: tangibility, profitability, size and market-to-book. The variables selected are consistent with several studies in terms of eligibility to study debt-equity choices, such as, Titman & Wessels (1988), Rajan & Zingles (1995), among others. Data used in this study included firms from different countries, from Europe to US, therefore being in terms of selected sample very diversified. The period analyzed was from 2000 until 2011. The dependent variables analyzed were: market and book leverage and short-term and long-term debt. Alves & Francisco (2015) estimated a panel regression of debt and maturity choices. The empirical results they found showed the behavior of leverage and debt maturity choices in reaction to changes in institutional variables, considering the financial crisis presented. Results showed that, dot,com bubble was between the crisis analyzed the one impacted more significantly leverage and debt maturity choices. The dot.com bubble results associated showed a positive sign meaning that an increase in the level of debt happened during that period. The most important conclusion resulting from this study was observing the amount of leverage of firms increasing during periods of financial crisis, with long-term debt being replaced by short-long-term debt. In long-terms of economic inconsistence and uncertainty, short-term debt followed a default while long-term debt kept the antagonistic trend. Alves & Francisco (2015) also noted significant findings in the years of the European sovereign crisis within the Euro Zone, specifically an asymmetric shock with the financial distress resulting from the crisis being felt differently in the periphery and in the center of the European Union. The study showed that firms followed the government in terms of financing options. In times of crisis, firms substitute long-term debt with short-long-term debt creating the possibility of a liquidity crisis. Financial regulators should be due to this aware of a firm’s debt to prevent situations like liquidity crisis from happening in times of crisis.
1.7. Portuguese Case
Some of the most important developments that try to answer fundamental questions regarding capital structure have already been discussed in the previous sections: M&M, Trade-Off Theory and Pecking Order Theory. The assumptions formulated by these theories were the basis for the questions that this study aims to answer. The asymmetrical information has consequences that are discriminated
in the Trade-Off Theory and due to that asymmetrical information firms prefer internal financing over external financing, according to the Pecking Order Theory. In accordance with the mentioned before, profitable companies which have retained profits, are much more likely to use internal financing instead of external because profitable firms are less likely to borrow.
The discussion around the theme of capital structure decisions contributed so far with a variety of studies, each of them focusing on a specific sub theme such as: capital structure decisions on G7 countries (Rajan & Zingles, 1995); capital structure decisions on developing countries (Booth et al., 2001), capital structure decisions on developed countries (e.g. Long & Malitz, 1985; Harris & Raviv, 1991), capital structure decisions in the Portuguese corporate sector (Antão & Bonfim, 2008), among others. Comparing the capital structure of firms from different countries is sometimes hard due to, for example, due to lack of consistent accounting and market information (Rajan & Zingles, 1995). According to that, recent studies have been focusing on firms from the same country and in the factors that could affect their capital structure. This study addresses the case of Portugal, during a period of time marked by a major financial crisis and with the influence of an international organism of monetary help, the IMF.
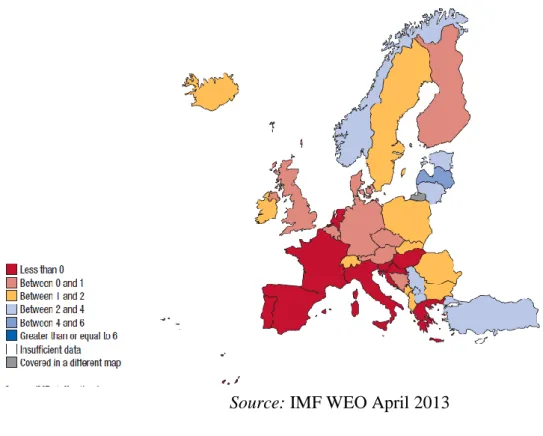
The situation verified in 2013, resulted from a series of measures that Portugal implement since 2011, with the help of the objectives established by the IMF, to balance the economy and public accounts. The growth forecast calculated for Portugal in the WEO of April 2013, showed a less than 0 percent result. European countries obtaining more optimistic results, had a forecast of about between 4 and 6 percent. See the figure bellow.
Source: IMF WEO April 2013
According to Portugal’s Letter of Intent, Memorandum of Economic and Financial Policies, and Technical Memorandum of Understanding (2013), credit conditions, particularly the credit sector conditions, remained difficult. This situation had a major contribution from the deleveraging occurring in the financial sector itself and in the private sector, the main demanders for credit. Additionally, the lack of capacity for smaller firms to pursue other types of credit through capital markets for instance, contributed for the decline in bank credit despite the improvements registered in both market sentiment and liquidity conditions.
Despite the direct measures for the macroeconomic environment, the Portuguese government monitored, with the help of BdP11, the financial sector, particularly the banks, their balance sheets and the credit offers they had for investors and applied specific measures to banks sector, for instance, new capital requirements that had to be presented to the BdP later that same year. In that same year, BdP required banks to raise their core Tier 112 capital level to 9 percent by the end of 2011 and 10 percent for the years following in order to enhance confidence in the solvency of the Portuguese banking system.
To investigate the impacts of the 2008s’ financial crisis on the Portuguese firm’s capital structure, only a sample selection of the determinants examined in the literature review will be included. For the
11 Banco de Portugal
12 A ratio used to measure bank’s financial strength
selection of such determinants, previous studies that also focused on the impact of financial crisis on the firm determinants capital structure were considered. The determinants selected and the choice regarding their selection is presented in the next section.
1.8. Firm’s Capital Structure Determinants
Since the discussion around capital structure decisions became more and more debated, several empirical studies have been carried out to study which factors affect the capital structure of firms. These factors could be: growth, liquidity, ratio of size, tangibility, asset structure, profitability and non-debt tax shield (e.g. DeAngelo & Masulis, 1980; Harris & Raviv, 1991; Jensen, 1986; Stulz, 1990; Myers, 2003; Titman & Wessels, 1988; Rajan & Zingles, 1995). Not all empirical studies considerer the same factors. The factors considered in each study usually rely on researchers’ sensibility to the environment, companies’ size, economy, and others, of the scope of study.
1.8.1. Growth
This determinant measures the growth of an investment or project made by a firm, leading to profit, and could be measured as: sales growth, asset growth, EBIT growth). It is commonly used by shareholders and investors to evaluate the company’s health. Studies considering growth as a specific determinant to measure and test capital structure of companies, do not agree on the sign this determinant has with debt. Trade-off theory states that firms with more intangible assets and better growth opportunities, tend to borrow less than firms with more tangible assets. There is a negative relation between growth level and debt. Green et al., (2001) argues that one reason for this negative relation has to do with the fact that firms do not distinguish between short-term and long-term debt and, according to Myers (1977), firms prefer internal financing rather than external because it can ignore future possibilities. Smaller firms, will not be willing take risks involving external financing options because they don’t have the dimensions (in terms of investors) a bigger firm has and by that the possibility to share the risks by more investors, as it happens in bigger firms. Hovakimian et al., (2001) states that the negative relationship must do with the fact that companies prefer to invest using their retained profits over debt, being the problem of underinvestment pointed as a reason. On the other hand, Ross (1977), states that the expected relationship is positive, as growth work as a sign for financial institutions that the company is not going to default and by than giving more favorable terms of credit.
Despite the different points of view in terms of the sign regarding growth and leverage of firms, we will test the following hypothesis:
H1a: Growth has a negative impact on firms’ short-term debt H1b: Growth has a negative impact on firms’ long-term debt
1.8.2. Liquidity
This determinant is a financial ratio that measures the capacity of a firm to guarantee their short-term responsibilities. Liquidity and firms’ debt ratio are expected to have a negative relationship. Antoniou (2008) and Mazur (2007) describe this negative relationship because of firms having more liquidity may issue less debt because they tend to use their internal financing. On the other hand, firms with higher liquidity should borrow more to fulfill their obligations. At the same time, firms with liquidity are more likely to issue debt to face with their short-term responsibilities. Due to that, we will test the following hypothesis regarding liquidity:
H2a: Liquidity has a negative impact on firms’ short-term debt H2b: Liquidity has a negative impact on firms’ long-term debt
1.8.3. Profitability
Myers & Majluf (1984) stated that more profitable firms have less interest in using external funds for financing. They will prefer since they have the possibility to finance their investments using internal earnings. Firms acquire more debt to prevent managers from spending the money generated by profits in risky investments. Schoubben & Hulle (2004) also argued that another motivation for profitable firms for not using external leverage is to maintain their profits, since external debt is costlier and to show more quality. Profitability has a direct connection to the Pecking Order Theory. The arguments present before contradict the Modigliani and Miller’s (1958) prediction because by choosing internal financing, firms are not taking advantage of the debt tax shields benefits. The most of researches/studies defend a negative relationship between profitability and debt.
Due to the points enumerated before, the following hypothesis will be tested:
H3a: Profitability has a negative impact over firms’ short-term debt H3b: Profitability has a negative impact over firms’ long-term debt
1.8.4. Size
Size is considered an important determinant of capital structure. Therefore, it is a common variable to see in many studies carried out on capital structure decisions. According to the Trade-off Theory, bigger firms tend to issue more debt because they face less costs of financial distress in its structure. Additionally, larger firms tend to have access to better credit solutions than smaller ones. Due to their dimension, credit markets see them as less risky than smaller firms. Smaller firms tend to have less debt structures compared to larger firms.
Wald (1999) calculated a positive correlation between these two variables. Titman & Wessels (1988) states also that size of companies is positively correlated with debt. Despite this positive correlation, the pecking order theory states that a negative relation could occur due to asymmetric information. Although some researchers found a negative relation between size and debt, we will test the following hypothesis distinguishing between short and long-term debt:
H4a: Size has a positive impact on firms’ long-term debt H4b: Size has a negative impact on firm’s short-term debt
1.8.5. Tangibility
Assets can be used as collateral when firms are issuing debt. Myers & Majluf (1984) stated that leverage and asset tangibility have a positive relationship. This is related to the fact that firms with tangible assets that can be used as collateral in case of failure for creditors, are expected to issue more debt or other external financing options. At the same time, using assets as collateral for an investment reduces the creditor’s risk in lending the money. In contrast, Titman & Wessle (1988) argue that this relationship is negative since some managers may use more than the optimal level they are allowed. The point of view stated lead us to the conflicts between managers and shareholders and between shareholders and bondholders. Those same conflicts would decrease if less assets firms’ value were secured. The recent financial crisis showed that fixed assets play an important role in the approval of bank financing with debt becoming more expensive.
To study tangibility’s impact on firms’ capital structure we will test the following hypothesis:
H5a: Tangible assets impact positively firms’ short-term debt H5a: Tangible assets impact positively firm’s long-term debt
1.8.6. Non-debt tax shield
The Trade-off Theory stated that firms prefer debt because of the incentive they get due to the non-debt tax shield. The interests generated by debt are deductible expenses, raising the amount of after-tax income. According to DeAngelo & Masulis (1980), the deductibility mentioned before could be the main benefit of debt. However, there are other deductible expenses. For example, depreciation expense can work as a substitute for debt tax shield. Most part of studies suggest a negative relationship between NDTS and debt, particularly long-term debt, without the literature being conclusive about the relation between NDTS and short-term debt. On the other hand, Vieira & Novo (2010) suggest a positive relation between NDTS and long-term debt and a negative relationship between NDTS and short-term debt for SMEs Portuguese companies.
Therefore, to study the impact on firms’ debt of changes on the NDTS we will follow the hypothesis under:
H6a: Non-debt tax shield is negatively correlated with short-term debt H6b: Non-debt tax shield is negatively correlated with long-term debt
Investors and individuals in general, tend to became more risk averse during times of instability such as during the time of a financial crisis. Due to all the changes that result from financial crises in the economy of a country from a macroeconomic and microeconomic point of view, a result of these changes could be to some firm-specific determinants and the capital structure of companies. Moreover, some financial crisis in Europe became so sever to countries that sometimes a request for an IMF’s assistance program and its restricted politics is the last resource for countries, in order to balance and reestablish their public accounts.
This study tries to focus on the determinants that play an important part in the capital structure of Portuguese firms.
3.
Methodology and Data
This section provides a presentation of the research, methodology and data used on the study as well as a descriptive statistical analysis regarding some important features of the sample of firms selected.
As already had been done in some other studies (Deesomsak et al., 2004; Rajan & Zingales, 1995; Muijs, 2015) that attempted to study the determinants of capital structure, a cross sectional ordinary least squares regression (OLS) is often used. Using this method, one can investigate the relation and influence that independent variables have on dependent ones.
3.1. Research Methods
This empirical study will be carried out by using panel data regression as had already been done (e.g. Rajan & Zingales, 1995). It refers to sets of multiple observations for each sampling unit (Baltagi & Giles, 1998). Panel data regression can be divided in static and dynamic. The present study will use static panel model.
Using this approach allow us to control individual heterogeneity among our sample as well as the time series for a single firm. Additionally, if combined with cross-sectional and longitudinal data, global effects can be seen, otherwise, using a simply one type of data, it would not be possible. One limitation underlined to panel data is when a sample has incomplete accounts or the non-response rate is high it can lead to non-balanced results.
3.2. Variables
Ratios are commonly used to determine the capital structure of firms. This study focused on seven different ratios, calculated for each firm and period. Regarding conclusions, the study, as mentioned before, will analyze the ratios chosen in three different time frames:
Before crisis: from 2005 to 2007; During crisis: from 2008 to 2012;
The variables used are similar to studies that focused on other countries and/or other sectors of economy. For example, Khademi (2013) focused on the capital structure of non-financial firms in the Netherlands and Sheikh & Wang (2011) focused on the determinants of capital structure in Pakistan, among others.
Dependent Variables
The dependent variables considered in this study will be long-term and short-term debt ratios. The variables are analyzed separately because they are not affected in the same way.
1) Short-term debt ratio = (ii)
2) Long-term debt ratio = (iii)
Independent Variables
As already have been used by Muijs (2015), the firm-specific determinants will be considered as the independent variables of this study. The independent variables used in this study are based in the ones used by Khademi (2013) in the study of the impact of global financial crisis on firms in Netherlands and in Muijs (2015) for Dutch listed firms. Table 4 shows the independent variables and expected sign.
1. Growth (GRWT): firms’ growth will be measured as total assets (t) – total assets (t-1) /
total assets (t-1). The values to calculate this ratio have been retrieved from the balance sheet of each firm. The relation between this ratio and debt is supposed to be negative. When a firm is growing, its needs for borrowing and loans decrease.
2. SIZE (SIZE): firm size is determined to be the natural logarithm of total assets Ln (total
assets t). The values to calculate this determinant have been retrieved from the balance sheet of each firm. The relation between this determinant and debt is supposed to be positive. A bigger firm has more opportunities to borrow money at better conditions and therefore, have major debt.
Total long-term debt t Total assets t Total short-term debt t
3. Profitability (PROF): in this study, a firm’s profitability is measured by calculating EBIT
t / total assets t. The values to calculate this ratio have been retrieved from balance and
income sheets of each firm. The relation between this ratio and debt is supposed to be negative. The more profitable a firm gets, the less need for loans and borrowing it has.
4. Tangibility (TAN): tangibility is calculated by dividing firms’ total tangible assets by its
total assets. The values to calculate this ratio have been retrieved from the balance sheet of each firm in analysis. The relation between tangibility and debt are supposed to be positive. As debt increases the tangibility of assets are more likely to be used as collateral to secure that debt.
5. Liquidity (LIQ): liquidity is calculated by dividing: current assets t / current liabilities t.
The values to calculate this ratio have been retrieved from balance sheets of each firm in analysis. The relation between liquidity and debt is supposed to be negative. If a firm’s liquidity increases its needs for external financing decreases.
6. Non-debt tax shield (NTDS): non-debt tax shield is calculated by dividing firms’ total
depreciation expense by its total assets. The values to calculate this ratio have been retrieved from the balance sheet of each firm in analysis. The relation between non-debt tax shield and debt are supposed to be negative.
Dependent Variables Calculation
Long-term debt ratio (LTD) Long-term debt / Total assets Short-term debt ratio (STD) Short-term debt / Total assets
Independent Variables Calculation Expected Relationship
Growth (GRWT) Total assets (t) – Total assets (t-1) / Total assets (t-1) - ; -
Size (SIZE) Ln (Total assets) + ; -
Profitability (PROF) EBIT / Total assets - ; -
Asset tangibility (TAN) Tangible fixed assets / Total assets + ; +
Liquidity (LIQ) Current assets / current liabilities - ; -
Non-debt tax shield (NTDS) Total Depreciation Expense / Total Assets - ; -
3.3. Data and Sample
The data for this study was gathered using Bloomberg13 and the annual financial statements of each firm of the sample (balance sheets, income statements and key stats), from 2005 until 2015. Bloomberg is an online database that provides historical and current financial statements, business newswires, and descriptive, research and statistic information on over 52,000 companies worldwide. The reason for the choice of this period is related with the purpose of this study: to analyze the impact of financial crises.
In this study, the data from 33 PSI general Portuguese listed firms will be used. Not all Portuguese firms will be included, like Muijs (2015), were excluded:
Firms operating in the financial, governmental and utilities sector. Those firms have a different nature in terms of capital structure compared to firms related to the industry sector and are subjected to specific regulation and legislation that affect their choices in terms of capital structure;
Firms with vital information missing for a certain year in analysis, in order to have a balanced sample to study.
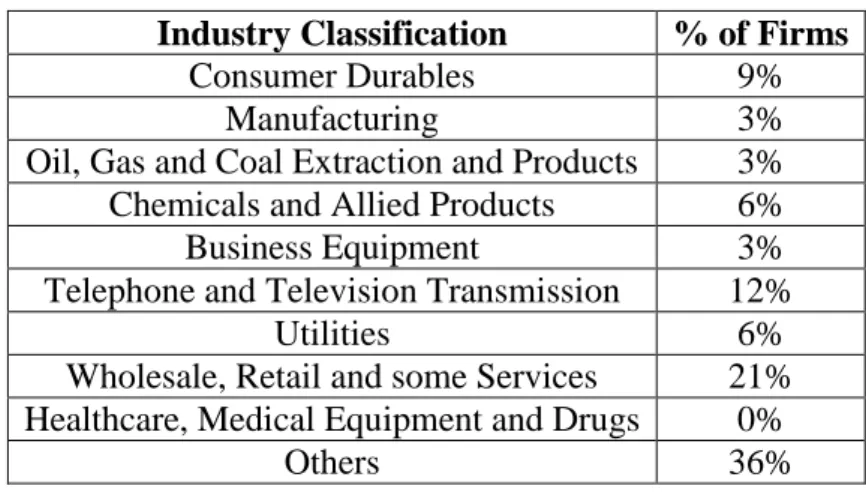
Table 5 represents the industry classification codes, according with Fama & French (2007), and the percentage of firms of the sample that fit in each category sector. The industry sector with the highest percentage of firms is others (mining, construction, transportation, hotels, business services and entertainment). Healthcare, medical equipment and drugs do not have any firm representing their sector in this sample.
13 http://www.bloomberg.com/europe
Table 5. Industry Sector Classification
Industry Classification % of Firms
Consumer Durables 9%
Manufacturing 3%
Oil, Gas and Coal Extraction and Products 3% Chemicals and Allied Products 6%
Business Equipment 3%
Telephone and Television Transmission 12%
Utilities 6%
Wholesale, Retail and some Services 21% Healthcare, Medical Equipment and Drugs 0%
Others 36%
Note: Table 5 categorizes the sample of firms in study according to the Fama & French (1997) industry classification sectors. Others include sectors such as Mining, Construction, Transportation, Hotels, Business Services and Entertainment.
Balance sheets and income statements of the sample of firms have been used to calculate the ratios used. Although the study does not use the information from all the firms listed in the Lisbon Euronext stock exchange, the sample used tries to represent the variety of sectors included in the Portuguese market.
3.4. Descriptive Statistics
The descriptive statistic analyzed in this section aim to verify if there are significant differences in the results obtained from the different periods in analysis. This study used Stata to calculate the descriptive analysis as follows. The source of the data used in this descriptive statistics analysis was Bloomberg and the financial statements of each firm. The analysis will focus on mean, median, standard deviation, maximum and minimum value and the number of observations for dependent and independent variables through the time period: 2005 to 2015.
Annex 1 shows the results for the four scenarios: one for the period before the crisis (2005 to 2007), one for the period during the crisis (2008 to 2012), one for the period with IMF intervention (2013 to 2015) and one for the entire period (2005 to 2015).
As shown in Table 1-, before the crisis, the mean for short-term debt is 0.399 which implies that about 40% of the assets of the sample firms are financed by short-term debt, the rest are financed by other financing options such as equity and long-term debt; long-term debt has a mean of 0.327
implying that about 33% of the assets of the selected firms are financed by long-term debt. The variable with the most significant mean is size with a mean of 6.44, as expected, since this study uses large companies. Liquidity shows also a high mean value, with a mean of 1.07. The results obtained imply that current assets of the selected firms are more than current liabilities. By analyzing the standard deviation of the independent variables used in the regression, only profitability, growth and non-debt tax shield present high dispersion because the value of their standard deviation is higher than the mean value.
For the period during crisis, from 2008 to 2012, as shown in Table 2, the mean for short-term debt is 0.432, about 43%. The mean for long-term debt ratio is 0.336. From one period to another, the ratio for short and long-term debt increased, although short-term debt ratio increased more. The results show that those firms increased their short-term debt instead of increasing long-term. The variable with higher mean continues to be size, with a mean of 6.656. Analyzing the output obtained, one can see comparing the period from 2005 to 2007 and 2008 to 2012, the mean for all variables decreased, with the exception of size. The variable size is the one with the most significant value in terms of mean in both periods since the industry sector for the companies selected is highly dependent on their sales and size.
From 2005 until 2015, as shown in Table 4., the mean for short-term debt was 0.413 and the mean for long-term debt was 0.333. The most significant mean value was the variable was size, with a mean of 6.56 followed by liquidity with a mean of 1.03. The values show that during that period of time, current assets for selected firms were more than their current liabilities. The results obtained are in accordance with other studies done for other European countries such as Netherlands, UK and Belgium (Hall et al., 2004). The short-term debt ratio is higher than the long-term, according to the mean values observed for those variables. On the other hand Khademi (2013) in his study on the capital structure for firms in Netherlands observed running descriptive analysis that the ratio of long-term debt is bigger than the short-long-term one. Firms in Netherlands, during the period of financial crisis identified in the study, 2008 to 2011, increased their long-term debt and decreased short-term debt.
Regarding the specific period of IMF’s intervention studied, 2013 to 2015, results show a mean of 0.392 for short-term debt and 0.332 for long-term debt. Compared to the period before and during crisis, the percentage of total assets financed by debt decreased. Firms preferred to lower their levels of debt. The effect on long-term debt was not significant compared to other periods. The mean for size in this period decreased when compared to other periods. Also, from 2013 until 2015 the variable growth registered a negative mean.
Additionally, this study analyzes some features on the capital structure of the selected firms in the period analyzed to see the behavior of some important variables to capital structure, across time. The analysis of some variables’ behavior during the observed time is important to better understand the changes they suffered across different time periods and it is the same exercise that managers should do in the process of taking decisions regarding the capital structure of firms in both present and future. Additionally, it is also important for investors to know the situation of a firm they might be interested in investing in and the evolution of the firm throughout time.
Table 6. Firms’ Capital Structure – Average Liabilities in % (2005-2015)
Variable 2005 2006 2007 2008 2009 2010 2011 2012 2013 2014 2015 2005-2015 Current Liabilities 39% 38% 38% 39% 38% 36% 38% 37% 36% 37% 36% 38% Non-Current Liabilities 61% 62% 62% 61% 62% 64% 62% 63% 64% 63% 64% 62% Table 6 provides the evolution of the average weight of debt in total debt for the sample of firm selected from 2005 to 2015. The results show that during the period of analysis, non-current liabilities represented a higher portion of total debt (average value of 62%) than the current liabilities (average value of 38%). The results show that the period between 2010 and 2011 was the period where non-current and current liabilities varied the most in terms of their relevance in firms’ total debt. The percentage for current liabilities increased in 2% and the non-current liabilities percentage decreased in 2%. The contrast with other years and the fact that 2010 and 2011 were years with global crisis affecting the Portuguese economy, could show a tendency for firms needing cash and, therefore, choosing short-term debt options instead of long-term. Although there are some differences between years, there are not significant changes in the average values of the variables analyzed.