Repositório ISCTE-IUL
Deposited in Repositório ISCTE-IUL:
2018-06-12Deposited version:
Post-printPeer-review status of attached file:
Peer-reviewedCitation for published item:
Moro, S., Cortez, P. & Rita, P. (2018). A divide-and-conquer strategy using feature relevance and expert knowledge for enhancing a data mining approach to bank telemarketing. Expert Systems. 35 (3)
Further information on publisher's website:
10.1111/exsy.12253Publisher's copyright statement:
This is the peer reviewed version of the following article: Moro, S., Cortez, P. & Rita, P. (2018). A divide-and-conquer strategy using feature relevance and expert knowledge for enhancing a data mining approach to bank telemarketing. Expert Systems. 35 (3), which has been published in final form at https://dx.doi.org/10.1111/exsy.12253. This article may be used for non-commercial purposes in accordance with the Publisher's Terms and Conditions for self-archiving.
Use policy
Creative Commons CC BY 4.0
The full-text may be used and/or reproduced, and given to third parties in any format or medium, without prior permission or charge, for personal research or study, educational, or not-for-profit purposes provided that:
• a full bibliographic reference is made to the original source • a link is made to the metadata record in the Repository • the full-text is not changed in any way
The full-text must not be sold in any format or medium without the formal permission of the copyright holders. Serviços de Informação e Documentação, Instituto Universitário de Lisboa (ISCTE-IUL)
Av. das Forças Armadas, Edifício II, 1649-026 Lisboa Portugal Phone: +(351) 217 903 024 | e-mail: [email protected]
A divide and conquer strategy using feature relevance and expert knowledge for
enhancing a data mining approach to bank telemarketing
Authors:
Sérgio Moro1,2,* (email: [email protected]) Paulo Cortez2 (email: [email protected]) Paulo Rita3,4 (email: [email protected])
Abstract
The discovery of knowledge through data mining provides a valuable asset for addressing decision making problems. While a list of features may characterize a problem, it is often the case that a subset of those features may influence more a certain group of events constituting a sub-problem within the original problem. We propose a divide and conquer strategy for data mining using both the data-based sensitivity analysis for extracting feature relevance and expert evaluation for splitting the problem of characterizing telemarketing contacts to sell bank deposits. As a result, the call direction (inbound/outbound) was considered the most suitable candidate feature. The inbound telemarketing sub-problem re-evaluation led to a large increase in targeting performance, confirming the benefits of such approach, considering the importance of telemarketing for business, in particular in bank marketing.
Keywords:
Feature selection, Divide and conquer, Marketing, Banking, Data mining
1
Instituto Universitário de Lisboa (ISCTE-IUL), ISTAR-IUL, Lisboa, Portugal 2
ALGORITMI Research Centre, University of Minho, Guimarães, Portugal 3
Instituto Universitário de Lisboa (ISCTE-IUL), CIS-IUL, Lisboa, Portugal 4
NOVA Information Management School (NOVA IMS), Universidade Nova de Lisboa, Campus de Campolide, 1070-312 Lisboa, Portugal
Introduction
Data mining (DM) enables to unveil previously undiscovered knowledge, providing leverage for decision making (Witten et al., 2016). The basic ingredient for DM is raw data, representing known instances of an interesting phenomenon to be modelled (i.e., the problem) that can be characterized by a list of features. A key aspect for a successful DM project is feature engineering, since data features need to be related with the problem modelled (e.g., desired outcome to predict) (Wang et al., 2015b). In previous works, we have addressed the telemarketing problem of predicting the result from phone call campaigns to sell bank deposits using DM. First, a bank telemarketing dataset was enriched with social and economic context features, leading to a tuned model that enabled to reach 79% of the deposit subscribers by selecting the half better classified clients (Moro et al., 2014). Such a model was then improved by including customer lifetime value related features, increasing the performance to 83% of subscribers with the half better classified contacts (Moro et al., 2015b).
In this paper, we further enhance the classification model by presenting a divide and conquer strategy for splitting the problem of selecting the most likely subscribers of a bank long-term deposit offered in the context of telemarketing campaigns, where contacts were conducted through phone calls within the bank's contact centre. The proposed approach is focused on selecting a candidate feature among the input features used to feed the model for logically dividing the problem into sub-problems. Then, a specific sub-problem is assessed for unveiling the benefits of the new classifier focused on a particular context within the larger problem. In this article, the next section describes the telemarketing and DM background related with this paper, followed by a section to present the bank dataset, the methods used for the divide and conquer strategy proposed and for assessing the impact on the new sub-problem. Then, the results are discussed. Finally, conclusions are summarized in the last section.
Background
Data mining
DM is considered a category of technologies under the wider umbrella of Business Intelligence, which includes also data warehouse or data mart, and On-Line Analytical Processing (Duan & Xu, 2012). As data is in demand for DM tasks, a BI system can encompass all those technologies together in order to provide an end-to-end solution, with the operational data feeding a data warehouse which, in turn, feeds DM for decision support on operational systems’ management (Xu et al., 2008). Moreover, the current Big Data age, through disparate sources such as social media and the Internet-of-Things, has further emphasized the relevance of DM for unveiling the hidden
patterns of knowledge from such massive volumes of data (Bendre & Thool, 2016). There are several types of DM tasks, including regression, where the outcome to model is numeric (e.g., stock market value), and classification, where the model attempts to find out the class of the outcome (e.g., if a customer purchases or not a product) (Qabajeh et al., 2015).
DM projects entail several relevant phases such as data cleaning, preparation, modelling and evaluation (Wang et al., 2014). Concerning the modelling phase, in Moro et al. (2014), four DM learning techniques were explored: logistic regression, decision trees, support vector machines (SVMs) and a neural network ensemble. The best result was achieved by the neural network, thus this is the only technique used for the experiments reported in this paper. Nevertheless, it should be noted that SVMs stand out as one of the most accurate modelling techniques (Yuan et al., 2010), with successful applications to a wide range of problems, including aircraft fuel consumption (Wang et al., 2015a), and customers’ feedback in hospitality (Moro et al., 2017). SVMs are able to “simultaneously minimize the empirical classification error and maximize the geometric margin classification space” (Yuan et al., 2010, p. 152).
Artificial neural networks represent an attempt to mimic the complex relations of neurons within the human brain to achieve logical reasoning in problem solving (Wang et al., 2010). A typical network is composed of layers, with each containing neurons (or nodes). Hence, the values of the input features travel through the network undergoing through computational transformations until the final node is reached, where a value resides as a result of all those complex relations hidden within the network. The capability of apprehending complex knowledge is dependent on both the number of hidden layers and the number of nodes (Li & Xu, 2000). For the present study, the neural network ensemble adopts the popular multilayer perceptron as its base model, with a configuration consisting in one hidden layer of H hidden nodes and one output node. The ensemble consists of Nr different trained multilayer perceptrons, where the combined output is made in terms of the average of the individual neural network predictions. It should be noted that domain knowledge has been proved to be a valuable asset when incorporated in DM tasks (Osei-Bryson & Rayward-Smith, 2009). Also, DM has been successively applied to several cases on banking, such as performance prediction (Wanke et al., 2015), and telemarketing (e.g., Barzanti and Giove, 2012, for fund raising).
The probabilistic outcome is computed by the data mining model for evaluating classification problems. A successful result c is considered when p(c|xk) > D, where D is the probability threshold that defines achieved success and p(c|xk) is the data-driven model response for the input client contact xk. The advantage of using class probabilities is that a receiver operating characteristic (ROC) curve can easily be conducted by varying D from 0.0 to 1.0, displaying one minus the specificity (x-axis) versus the sensitivity (y-axis) (Fawcett, 2006). In effect, the area under the curve provides a popular classification metric to evaluate prediction results (Jiménez et al., 2016) and thus such metric was adopted in this work. Another adopted metric is based on the Lift analysis, which
provides an interesting procedure to assess model prediction capabilities by dividing the dataset in deciles, ordered from the most to the least likely successful results (Witten et al., 2016). The cumulative Lift curve plots population samples (x-axis) versus the cumulative percentage of real responses captured (y-axis). Similarly to the AUC metric, the ideal method should present an area under the LIFT (ALIFT) cumulative curve close to 1.0.
Sensitivity analysis has been established as an effective technique for assessing to which degree a given model is sensitive to changes on the initial assumptions that have been made for building such model (Hora & Campos, 2015). The data based sensitivity (DSA) approach allows understanding neural network models by changing simultaneously several input features from the samples used in the training set and thus can be used to detect the global effect of a feature even if such influence is only visible when it interacts with other input features (Cortez & Embrechts, 2013). Although a recent method, DSA has been already applied to a wide range of problems in recent research. Some examples include predicting social media performance metrics (Moro et al., 2016), jet grouting (Tinoco et al., 2016), and groundwater potential mapping (Naghibi et al., 2017).
Divide and conquer strategy
A wide number of divide and conquer strategies have been applied in the machine learning and DM domains. The division of a certain problem in smaller fractions is a natural way to reduce complexity to a manageable size. Particularly, several algorithms widely spread for implementing DM techniques tend to adopt tree structures to which divide and conquer strategies are recursively applied to shortcut through the search-space of the problem (Yun et al., 2016). Also, a wide number of techniques categorized under rule based and ensemble classifiers, including random forests, are based on the divide and conquer rule induction approach (Stahl & Bramer, 2014). Recent developments continue to use divide and conquer strategies for improving DM modelling tasks, such as: improving the performance of support vector machines (Hsieh et al., 2014); and handling large datasets by using an hierarchical classification for dividing the problem in smaller fractions which can be dealt with neural networks (Fritsch & Finke, 2012). Chen et al. (2017) proposed a divide and conquer strategy for improving sentiment analysis based on successively categorizing sentences using neural networks. The approach the aforementioned authors propose outperforms other well-known sentiment analysis methods on several benchmarking datasets. Other related domain to which divide and conquer has been applied is process mining, with the results showing that, for large volumes of event logs, decomposing a problem into a maximum number of sub-problems is not always the best choice; rather, non-maximal decompositions tend to provide better results (Verbeek et al., 2016). Especially relevant is the criterion chosen for such decomposition, which may become a challenging task for an algorithm to handle solely without human intervention.
While a large number of articles are devoted to DM algorithm design, a smaller number emphasizes the need to divide the problem to reduce the feature selection search space. Such need has been mathematically described by Li and Xu (2001) within their study on feature space theory. It encompasses the transformation between extensions and intensions in terms of knowledge representation (Li et al., 2003). Furthermore, it is considered a research subject of relevant interest in DM, as the exponential growth associated with real world problems with several constraints and large search spaces pose serious challenges even with large computational power (Chandrashekar & Sahin, 2014). However, most of the proposals are focused on automated solutions or using expert knowledge embedded in the feature selection procedure, rather than decomposing the problem. As an example, Lin et al. (2014) included expert knowledge in their feature selection proposal of a wrapper-based method. Also, expert knowledge has helped to improve the reliability of web attack detection by reducing the number of redundant and irrelevant features (Torrano‐ Gimenez et al., 2015). The present study highlights a different mixed approach, which brings a new research contribution by using computed feature relevance combined with an expert knowledge. Furthermore, as Cortez and Santos (2013, p. 433) stated, “data-driven knowledge, used either solely or complemented by expert driven knowledge, turned into a key element of modern Expert Systems”.
Materials and methods
Bank telemarketing case-study
Direct marketing is the method of targeting specific customers allowing companies to promote products or services on an individual basis. The usage of a customer database can enhance the process, turning it into database marketing (Tapp, 2008). The telephone is still one of the major communication channels, emphasized by the proliferation of mobile devices. Marketing promotions and campaigns conducted using mainly the telephone are defined as telemarketing (Kotler & Keller, 2016). Companies with the need to support a large number of customers typically concentrate communication in contact centres, where automated or human agents can answer customers. Such centres are also used to conduct telemarketing campaigns, which include performing outbound calls to a list of customers, or by taking advantage of inbound calls from customers to approach them in order to promote campaign products. The difference between inbound and outbound telemarketing has been reported by a few researches for problems such as simulation modelling and staffing (e.g., Mehrotra & Fama, 2003; Lin et al., 2010).
One of the major problems in telemarketing is to specify the list of customers which present a higher likelihood of buying the product being offered (Talla Nobibon et al., 2011). Decision support systems using predictive models can provide better informed decision making, increasing
telemarketing managers' awareness of the impact resulting from predicted outcomes. DM modelling techniques allow unveiling patterns of information, translating it into knowledge which can be incorporated in such predictive systems (Witten et al., 2016). Despite the potential gain of using DM for modelling bank telemarketing success, few studies have adopted such approach (Moro et al., 2015a). As explained by Moro et al. (2014), in 2012, we initially explored several data-driven models for targeting the subscription of long-term deposits but we only achieved accurate predictive models when using features that were only known on call execution, such as call duration. In 2014, such drawback was solved by adding features that could be known before call execution, namely: social and economic context related (e.g., Euribor rate) (Moro et al., 2014); and lifetime value features (e.g., frequency of past client successes) (Moro et al., 2015b). Also in 2014, Javaheri et al. (2014) followed a distinct approach, modelling the effect of mass media campaigns (e.g., television) on the buying of new bank products. As explained in the Section 1, this paper provides a purely novel approach to enhance the modelling bank telemarketing success, where a divide and conquer strategy, supported by expert domain knowledge, is used to split the dataset instances according to the direction of the call, with a particular focus on inbound call specific features.
This research adopts the case of telemarketing contacts executed between May 2008 and June 2013 from a Portuguese bank for selling long-term deposit accounts, consisting in a total of 52944 records. In Moro et al. (2014) a feature selection and engineering procedure took place over the same dataset, from an initial base of 150 features. As a result, the final model used just 22 features. Subsequent work of Moro et al. (2015b) improved the model using five new customer lifetime value related features, increasing the total to 27.
For this work experiments, the five most relevant features for the best model (achieved by Moro et al., 2015b) are used for a panel of three human experts assess the relevance based on their business knowledge, complementing previous feature relevance. Such panel is composed by:
A telemarketing campaign manager, having worked three years as a technical contact centre support and ten years as a technician in Marketing (#1);
A bank technician, with 6 years of experience in the Commercial Area, plus three years in the Risk Department (#2);
A former bank information systems manager (2001-2016), who spent twelve years coordinating information systems projects for the bank’s contact centre (#3).
This panel is the same who helped with the definition of the banking dictionary adopted by Moro et al. (2015a). By enquiring three experts with different backgrounds, bias in the achieved results is reduced when compared to relying on a single expert.
Data mining
For computational experiments when modelling the sub-problem, the rminer package of the R tool was adopted, which provides a coherent and parameterizable small set of functions specifically designed for data mining computation (Cortez, 2010). To fit the data records, the choice was a neural network base learner, since this model provided the best results in previous studies with the same dataset, outperforming a support vector machine, a logistic regression and a decision tree. Rminer implements a multilayer perceptron ensemble with Nr learners, where each individual
learner consists of a multilayer perceptron with several computing nodes organized in layers (Haykin, 2009). The input layer is fed with the input vector and propagates the activations in a feed forward fashion, via the weighted connections, through the entire network. The ensemble final response is set as the average of the distinct neural networks. The use of such ensemble turns the model less dependent on the random initialization of the neural network weights, as suggested by Hastie et al. (2009).
Regarding the configuration of the ensemble model, the neural network ensemble is composed of Nr = 7 distinct networks, each trained with 100 epochs of the BFGS algorithm. For setting the number of hidden nodes (H), a grid search was performed where the number of hidden nodes was searched within the set H {0; 2; 6; 8; 10}. The rminer package of the R tool applies this grid search by performing an internal holdout scheme over the training set (with 2/3 of the data), in order to select the best H value, that corresponds to the lowest AUC value measured on a subset of the training set, and then trains the best model with all training set data.
Divide and conquer strategy
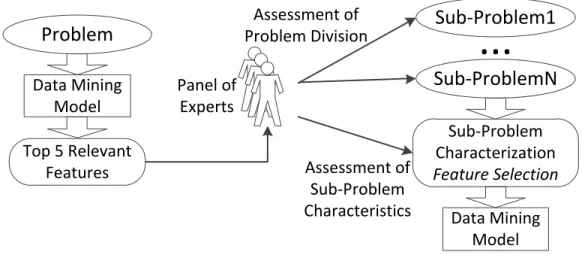
For defining a division of the problem, first the five most relevant features from previous research were considered (Table 1). Each of the three experts was asked to assess the relevance for each of the previously five most relevant features using their expertise, by selecting a quantitative metric for relevance from one (no relevance) to ten (vital relevance). Next, an unstructured interview took place for discussing their assessment with the goal of finding the most suitable candidate features for splitting the problem (and the dataset) in the light of business management commitments. For justifying this approach, it can be argued that specific domain knowledge via human expertise remains the best method for characterizing a specific problem, as argued by Witten et al. (2016). Figure 1 provides a simplified overview of the proposed procedure.
In the suggested strategy, each of the three members of the experts’ panel participated in two phases: first, by assessing from a shortened list of the most relevant features for the DM model which is the more suitable candidate partition for the problem in analysis; then, for providing
assistance in the characterization of the new sub-problem, which should be different than the main problem, justifying a new feature analysis. For the experiments hereby presented, the five most relevant features from the DM model were re-evaluated by each expert. However, this limitation of features was only imposed to save valuable time from human experts who assisted the experiments. Since the three experts hold distinct credentials and banking experience, all the three are accounted the same weight regarding their decisions. Therefore, for obtaining the final rank of features’ relevance, the average of the three experts’ decisions is computed. This approach is an attempt to benefit from the best of two alternative strategies:
usage of automated machine learning DM techniques, used to discover possible unknown yet useful knowledge from data; mixed with
cognitive human thinking, which is known for making straightforward shortcuts for quick decision making.
Such approach addresses the complexity associated with the characterization of a problem using its features, which is highly application-dependent.
Modelling procedure and evaluation
After deciding which sub-problem should be addressed, a baseline model using the 27 features previously discovered was developed, in order to allow a straightforward comparison (Moro et al., 2015b). First,, a feature selection and feature engineering procedure was conducted, where the baseline features were merged with newly features selected by the telemarketing manager expert, drawn from the total number of features present in the original database (dataset with 150 attributes) (Moro et al., 2014). Then, a feature reduction was conducted in three iterative steps by using DSA to remove the least relevant features for modelling. The procedure was defined as follows:
i) First, asking the bank telemarketing manager to identify which other features (besides the 27 already identified) could better characterize the new sub-problem in which customers are approached to buy the campaign deposit. The telemarketing manager selected these extra features from the initial set of 150 features presented by Moro et al. (2014).
ii) Second, modelling the subset telemarketing contacts considering: a) the 27 original features;
b) the features selected by the telemarketing manager specifically for its potential of influencing the new sub-problem call results.
iv) Fourth, proceeding with a three step iterative feature reduction phase, by excluding the least relevant features, as determined by a DSA, leaving only:
a) 1st step: the 20 most relevant features; b) 2nd step: the 15 most relevant features; c) 3rd step: the 10 most relevant features.
By reducing to just as few as ten features, if the model achieves better performance as the baseline (27 features), it can serve to demonstrate the large difference between addressing the telemarketing problem with the general solution and with the tuned model using specific sub-problem features.
In order to compare the results between every phase, both AUC and ALIFT metrics were computed in an effort to improve AUC but also aligned with an increase in ALIFT. For assessing model performance, considering the new sub-problem dataset, two different methods were adopted:
First, for every phase of the feature selection and reduction procedure, modelling was executed using a random holdout validation, with a selection of 2/3 of contacts for training and 1/3 for testing predictions. This procedure was performed for twenty times and computed average AUC and ALIFT metrics;
Second, a more realistic time ordered holdout was carried out with the most relevant features by selecting the 90% oldest contacts for building the newly proposed inbound model and then tested it on the more recent 10% of contacts. Such a different split from feature procedure intended to address the issue of having few contacts, thus we took a larger fraction for the training set for fitting more data. For comparison purposes, metrics were computed for modelling using the initial features, and the newly found characterizing features. The inbound model is the optimization achieved through the proposed divide and conquer and feature selection based on the new specific sub-problem toward a tuned result.
Experiments and results
Divide and conquer strategy
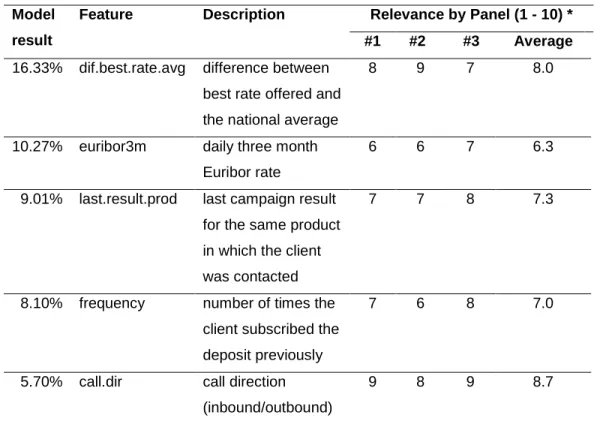
The five most relevant features in the study of Moro et al. (2015b) were assessed by the panel of experts. It should be noticed that the experts were perfectly aware of the previous results, which could influence their judgment. However, Table 1 shows that the relevance experienced in the real environment is not the same as the computed from the DM model (using DSA).
Call direction, the least relevant feature from the top five DM model DSA analysis, was considered the most relevant for both the telemarketing and the information systems managers. The risk manager with commercial background however pointed out the difference between best rate offered and the national average as the most relevant feature, with the call direction in second. It should be stressed that this expert, although with a valuable banking background, was less aware of the specificities inherent of telemarketing management when compared to the remaining two experts. Nevertheless, the final column in Table 1 shows that call direction was considered the most relevant feature in average. Such result pinpoints the need for a discussion to understand why human experience pointed to different direction from a computational result. First of all, the telemarketing manager indicated the huge difference in the human agents handling the calls: while outbound agents are typically young university students (18-24 years) appealing for a part-time job to pay some of their day-to-day expenses, inbound agents are older, more experienced agents. Furthermore, outbound agents usually do not stay for more than a year. In fact, their training reflects this situation, with highly focused and intensive sessions up to two weeks before beginning call handling, and smaller session for each new campaign, to understand the product or service being offered. Moreover, inbound agents only receive briefing sessions and electronic documentation for a new distinct product. Also, quality control is much more emphasized for outbound agents. It is interesting to note short-term outbound agents as opposed to mid or long-term inbound agents. In fact, outbound activities are pre-planned, more focused and can be better structured whereas inbound activities are likely to be less structured since the initiative does not come from the bank but rather from the consumer. Hence, inbound interaction may demand more experience and breadth from the employee. Outbound looks more hard-sell, inbound more soft-sell.
The other big difference is customer entanglement versus intrusiveness. The manager states that customers are keener to listen the agent when they begin the interaction. The fact that it was the customer who first established the call is enough to make a difference, since if she/he is calling, it is because she/he has some available slot of time for conversation, while an outbound call may come in an inconvenient time. Then, there is the procedure for this particular contact-centre, where customer requests are handled first and only then the agent tries to offer the product/service. Therefore, after the client is satisfied, it is more likely to be predisposed to listen the agent who happens to have just met her/his request.
Last but not least, there is a sense of insecurity in making banking transactions through phone. This is much more emphasized than a home banking web site, where the client is not interacting with a human being, on the opposite of a phone contact, aggravated by the fact the client is not physically seeing the agent. Therefore, customers who are used to interact with the bank via the phone communication channel (thus perform phone calls) are much more prone to subscribing products/services using this channel. In fact, intrusiveness associated with outbound
communication and specifically phone calls have been widely studied and regulated by legislation through opt-out registration (Woodside, 2005). Thus it is no surprise the conclusions of the telemarketing expert. However, the focus of this characteristic in comparison with the remaining features differs from the feature relevance determined through model analysis. Thus, a discussion about the second most relevant feature for the manager also should take place.
While it can be argued that the gain the customer achieves through the offered rate in comparison with the competition is a valuable driver toward deposit subscription, there is not such a remarkable difference such as for the type of phone call. The expert manager states that dialog script configured per campaign usually is different for each deposit, being adapted to its characteristics. This difference could suggest that mining a different model per product would improve targeting subscription performance. In fact, other reason may favour the split using the offered rate: the expert mentioned that eventually a DM model would optimally use different features associated with the deposit specification (e.g., a deposit with an offered rate higher than the competition may demand a high minimum amount of subscription, thus being more related with the client income). Nevertheless, the fact that interest rate is a numeric value (when compared with the binary direction call) also poses the difficulty of where the split should occur, or even how many splits.
In the end, the expert clearly indicated the inbound versus outbound as the most relevant split, although emphasizing that other divisions could occur considering the offered rate. Taking into account the size of the analysed dataset, the inbound telemarketing sub-problem consisted in only 1915 instances, as opposed to the total 52944 contacts. This number suggests previous research was optimized for outbound telemarketing. Given such potential to substantially improve inbound telemarketing predictive results, in this study we adopt the call direction split, with a particular focus on inbound calls. In the next section, the sub-problem of inbound telemarketing is characterized by the telemarketing manager and re-evaluated. As a last remark, it may be argued that the knowledge emerging from this discussion solely based on human experience can hardly be inferred by the state of the art in machine learning. Simply, there are too many context factors to account for in each problem. Results explored in the next section attest the benefits of the proposed approach.
Modelling
In this section, modelling of the new problem takes place, first for tuning through feature selection, then by comparing the results from baseline to the newly defined model. Previous section suggested splitting the problem between inbound and outbound telemarketing, following advice from expert, also supported by the literature. As stated previously, the panel of experts analysed the new sub-problem of inbound telemarketing and its characteristics and selected a new list of features for adding value to the baseline 27 features (Table 2). It should be noted that two of the
initially proposed features were discarded (call.dir and last.prod.result), since these attributes were constant for the small subset of just 1915 inbound contacts (but not for the whole 52944 records). Thus, further reference in this text mentions just 25 features to those used in the baseline study. Table 3 shows the aggregated results by the average for the twenty executions for each feature selection phase.
Recalling that a closer value of AUC and ALIFT to 1.0 represents a more accurate model, phase ii)a), with the originally proposed features, achieved an AUC of 0.8818, while modelling using just the new features (phase ii)b)) got an AUC of 0.7940. Nevertheless, the new features were an addition to the original characteristics, thus, an overall better result by merging all the features was expected, which was achieved through a model with an AUC of 0.9069 (phase iii)), confirming the value of the panel’s choices. To validate statistical significance, a Mann-Whitney non-parametric test was executed to check significance at the 95% confidence level (Molodianovitch et al., 2006).
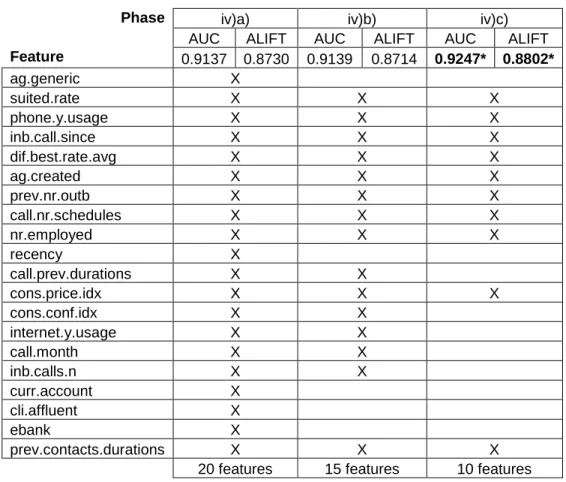
For the feature reduction procedure (Table 4), a first test was conducted for a reduction from the 34 features from phase iii) to the most relevant twenty features, where these features were selected using DSA method applied to the model with the 34 features. Such a reduction resulted in an improvement in the AUC from 0.9069 to 0.9137. The results achieved are evidence that some of the features hold noise, affecting negatively the performance of the model. In fact, more features does not necessarily mean better models, as it is a challenging task for an algorithm to decide which features are relevant and which are not (Domingos, 2012).
Next, two more steps were performed by removing the five lesser relevant features in each iteration. The result is an achievement of an AUC of 0.9139 with fifteen features, and of 0.9247 with just ten features. These metrics confirm that the discarded features were less relevant, leading to a model with better predictive performances. This behaviour often occurs when using feature selection methods (Guyon & Elissee, 2003).
Table 5 shows the results for the realistic simulation where the 90% older contacts were used for modelling and the newer 10% for testing the predictive accuracy, using the best set of 25 features proposed by Moro et al. (2015b) (original model, optimized for all types of contacts) and the ten new features discovered and presented in Table 4 (inbound optimized model, as set in phase iv)c)). The difference in the results confirms the effectiveness of the suggested procedure. The inbound optimized model achieves the best AUC and ALIFT values, presenting an AUC of 0.89 and ALIFT of 0.87 that corresponds respectively to a 14 and 13 percentage point difference when compared to the original model (with 25 features).
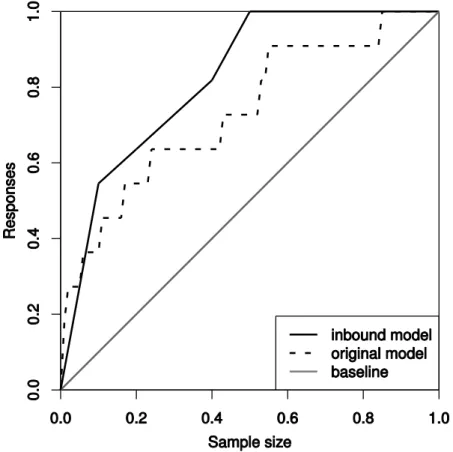
The curves plotted in Figure 2 for both the original model based on the 27 features previously discovered and the newly found features for the optimized inbound telemarketing model show the difference of both models, confirming the values shown on Table 5. Nevertheless, it should be
stated that this is a rough comparison, given the large difference between the features used. Also the confusion matrix displayed (right side of Figure 2) exhibits the high level of accuracy, with a true positive rate of TPR=82% and true negative rate of TNR=82%, when considering a success if the model foresees more than 20% of probability of occurring a subscription. We should note that the D=20% threshold used to build the example confusion matrix was chosen taking into account that this particular bank prefers to avoid losing business opportunities, which is translated into successful subscriptions. Hence, we opted for a low threshold and more sensitive example, above which the client is contacted.
Figure 3 shows the Lift cumulative curves for the simulation test, when using the 10% newest contacts. The plot visually confirms the large difference between both models in terms of prediction results. Table 6 exemplifies the portion of successful contacts reached from the total of successes for some sample sizes of the Lift curve. These results confirm that for the largest portion of the sample size range ( [0.07; 1.00]), the inbound optimized model obtains the highest cumulative Lift (i.e., number of client responses). In particular, it should be stressed that when half of the most likely buyers are selected, the inbound model achieves the perfect performance, reaching all subscribers. The difference is large (27.2 percentage points) when compared with the original model. In effect, the original model needs to select a much larger sample (with 80% of the most likely buyers) to achieve the same level of performance.
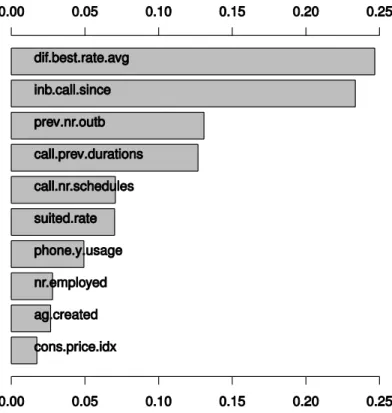
To detail the relevance of the ten features used for defining the inbound optimized model, the DSA method was executed, which uses samples from the training data to analyse variations in the desired outcome. The higher the variation in the predicted response, the more relevant is the analysed input feature. The respective DSA feature ranking is displayed in Figure 4
.
The difference between the best offered rate and the national average is the most relevant feature for the implemented model. This is a confirmation of the results achieved by Moro et al. (2015b), which also stated this feature as the most relevant. Interestingly, the second and third most relevant features are specifically inbound and correspond to newly proposed features. The former represents the past time period since any previous call for the same campaign, while the later stands for the previous outbound attempts within the same campaign. The relevance of the second feature is just slightly below the top feature, and above 20%, emphasizing the influence for modelling inbound calls. The third feature has an influence of around 13%. The inclusion of these two new features in the top three is a confirmation that inbound telemarketing should deserve a specific attention, different from outbound telemarketing, proving the value of the proposed strategy.
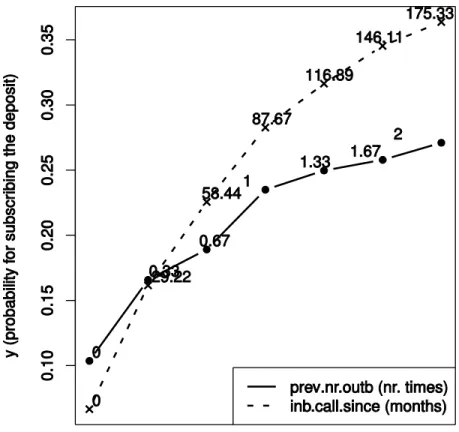
Considering the second and third most relevant and newly proposed features, we proceeded by using the sensitivity analysis DSA method to measure the global effect of the feature in the output
response. Figure 5 presents the respective Variable Effect Characteristic (VEC) curve, which plots the input feature range of values (x-axis) versus the average sensitive model responses (y-axis).
From the plot of Figure 5, it can be observed a direct influence of an increase in the number of days gone from another inbound contact for the same campaign with the likelihood of success. It should be noted that some of the inbound campaigns are resident, i.e., permanent since the corresponding product started to be sold through phone calls. This fact justifies the larger numbers in the curve, such as 175 months (approximately 14 years). Furthermore, each deposit has an expiration period, after which the value invested and interests earned are deposited in the main current account, meaning that the customer may be contacted again after this date. Several reasons may justify the relationship found. One of the more plausible is the fact that the customer may be bothered if few time passed since the last time he was asked previously to subscribe the same deposit. In fact, while the intrusiveness is more associated with outbound phone calls, inbound communication may also be affected by the customer perceived intrusiveness (Jung, 2009).
The third most relevant feature is the number of previous outbound calls, with a higher value influencing positively the likelihood of success. This is not a surprising relationship. In fact, it often occurs that the client is contacted directly through an outbound call and asked to be contacted later, but sometimes it is the client himself that takes the initiative of contacting the bank to finally subscribe the deposit, resulting in a successful contact. However, the studied dataset does not provide information about which contacts are made by the clients specifically for subscribing the deposit.
Conclusions
In this paper, a divide and conquer strategy approach was presented, using a procedure based on feature relevance computed by a data mining (DM) model followed by an expert analysis in order to find the best feature for splitting the problem in smaller more manageable sub-problems. This methodology was applied to a bank telemarketing problem consisting in campaigns conducted through phone calls for selling long-term deposits. The expert evaluated previous five most relevant features and assessed, based on his experience, which was the best candidate for splitting the problem. As a result, the call direction was considered the most suitable candidate.
Considering most of the contacts in the dataset are from outbound calls (51029), the hypothesis that arose was that inbound calls have been neglected in its characterization features. To test it, the 1915 inbound contacts were re-evaluated as a sub-problem from the original problem. First, the human expert helped in selecting additional features for increasing dataset value. Then, a feature
reduction procedure took place for improving the model by eliminating the least relevant features, leading to just ten.
A data-driven model was built and evaluated. As a baseline comparison, a model fed with 25 features that were previously identified as relevant was defined, but where there was no distinction between outbound and inbound contacts, with the vast majority of the calls being executed through outbound. The obtained results confirm the inbound optimized model as the best solution, outperforming the baseline model by a large difference. Moreover, the inbound optimized model achieves the ideal Lift performance (i.e., reaching all potential buyers) when selecting only half of the most likely buyers, while the baseline model needs to select a much larger sample (80% of the clients) to reach the same performance.
These results clearly confirm the approach proposed for dividing a problem in a smaller sub-problem which is characterized by specific features, different than the ones which best represent the more global problem. Thus, using a “divide and conquer'' approach, in which the inbound contacts are modelled with a distinct predictive model, leads to an added value for the studied telemarketing bank domain. Moreover, a sensitivity analysis was executed over the best predictive model, ranking two inbound specific features (i.e., number of days passed from another inbound contact for the same campaign and number of previous outbound calls), as the second and third most relevant features. Such knowledge is useful for bank campaign managers. Furthermore, within our knowledge, this is the first study that addresses inbound telemarketing problem within the banking domain (which it is normally “closed” and does not provide data openly for research). This clearly values this study and the obtained findings.
As future work, we intend to explore using other methods for feature selection to compare with the efficiency achieved through the DSA. One possibility is using mutual information theory, as it is a proven method for detecting noisy or irrelevant features (Barraza et al., 2016).
References
Barraza, N. R., Moro, S., Ferreyra, M., & de la Peña, A. (2016). Information Theory based Feature Selection for Customer Classification. In Simposio Argentino de Inteligencia Artificial (ASAI 2016)-JAIIO 45 (Tres de Febrero, 2016).
Barzanti, L., & Giove, S. (2012). A decision support system for fund raising management based on the Choquet integral methodology. Expert Systems, 29(4), 359-373.
Bendre, M. R., & Thool, V. R. (2016). Analytics, challenges and applications in big data environment: a survey. Journal of Management Analytics, 3(3), 206-239.
Chandrashekar, G., & Sahin, F. (2014). A survey on feature selection methods. Computers & Electrical Engineering, 40(1), 16-28.
Chen, T., Xu, R., He, Y., & Wang, X. (2017). Improving sentiment analysis via sentence type classification using BiLSTM-CRF and CNN. Expert Systems with Applications, 72, 221-230.
Cortez, P. (2010). Data mining with neural networks and support vector machines using the r/rminer tool. In Advances in Data Mining. Applications and Theoretical Aspects (pp. 572-583). Springer.
Cortez, P., & Embrechts, M. J. (2013). Using sensitivity analysis and visualization techniques to open black box data mining models. Information Sciences, 225, 1-17.
Cortez, P., & Santos, M. F. (2015). Recent advances on knowledge discovery and business intelligence. Expert Systems, 32(3), 433-434.
Domingos, P. (2012). A few useful things to know about machine learning. Communications of the ACM, 55(10), 78-87.
Duan, L., & Xu, L. D. (2012). Business intelligence for enterprise systems: a survey. IEEE Transactions on Industrial Informatics, 8(3), 679-687.
Fawcett, T. (2006). An introduction to roc analysis. Pattern recognition letters, 27, 861-874.
Fritsch, J., & Finke, M. (2012). Applying divide and conquer to large scale pattern recognition asks. In Neural Networks: Tricks of the Trade (pp. 311-338). Springer.
Guyon, I., & Elissee, A. (2003). An introduction to variable and feature selection. The Journal of Machine Learning Research, 3, 1157-1182.
Hastie, T., Tibshirani, R., Friedman, J., Hastie, T., Friedman, J., & Tibshirani, R. (2009). The elements of statistical learning volume 2. Springer.
Haykin, S. S. (2009). Neural networks and learning machines volume 3. Pearson Education Upper Saddle River.
Hora, J., & Campos, P. (2015). A review of performance criteria to validate simulation models. Expert Systems, 32(5), 578-595.
Hsieh, C.-J., Si, S., & Dhillon, I. S. (2014). A divide-and-conquer solver for kernel support vector machines. In Proceedings of the 31st International Conference on Machine Learning (pp. 566-574). International Machine Learning Society.
Javaheri, S. H., Sepehri, M. M., & Teimourpour, B. (2014). Response modelling in direct marketing: A data mining based approach for target selection. In Y. Zhao, & Y. Cen (Eds.), Data Mining Applications with R chapter 6. (pp. 153-178). Elsevier.
Jiménez, F., Jódar, R., Martín, M. D. P., Sánchez, G., & Sciavicco, G. (2016). Unsupervised feature selection for interpretable classification in behavioral assessment of children. Expert Systems. In press.
Jung, J. H. (2009). Factors influencing consumer acceptance of mobile advertising. Ph.D. thesis.
Kotler, P., & Keller, K. (2016). A Framework for Marketing Management (6/E). Pearson.
Li, H. X., & Xu, L. D. (2000). A neural network representation of linear programming. European Journal of Operational Research, 124(2), 224-234.
Li, H. X., & Xu, L. D. (2001). Feature space theory—a mathematical foundation for data mining. Knowledge-Based Systems, 14(5), 253-257.
Li, H. X., Xu, L. D., Wang, J. Y., & Mo, Z. W. (2003). Feature space theory in data mining: transformations between extensions and intensions in knowledge representation. Expert Systems, 20(2), 60-71.
Li, Y., Xia, J., Zhang, S., Yan, J., Ai, X., & Dai, K. (2012). An efficient intrusion detection system based on support vector machines and gradually feature removal method. Expert Systems with Applications, 39, 424-430.
Lin, F., Liang, D., Yeh, C. C., & Huang, J. C. (2014). Novel feature selection methods to financial distress prediction. Expert Systems with Applications, 41(5), 2472-2483.
Lin, Y.-H., Chen, C.-Y., Hong, W.-H., & Lin, Y.-C. (2010). Perceived job stress and health complaints at a bank call center: comparison between inbound and outbound services. Industrial health, 48, 349-356.
Mehrotra, V., & Fama, J. (2003). Call center simulations: call center simulation modeling: methods, challenges, and opportunities. In Proceedings of the 35th conference on Winter simulation: driving innovation (pp. 135-143). Winter Simulation Conference.
Molodianovitch, K., Faraggi, D., & Reiser, B. (2006). Comparing the areas under two correlated ROC curves: Parametric and non-parametric approaches. Biometrical Journal, 48, 745-757.
Moro, S., Cortez, P., & Rita, P. (2014). A data-driven approach to predict the success of bank telemarketing. Decision Support Systems, 62, 22-31.
Moro, S., Cortez, P., & Rita, P. (2015a). Business intelligence in banking: A literature analysis from 2002 to 2013 using text mining and latent Dirichlet allocation. Expert Systems with Applications, 42(3), 1314-1324.
Moro, S., Cortez, P., & Rita, P. (2015b). Using customer lifetime value and neural networks to improve the prediction of bank deposit subscription in telemarketing campaigns. Neural Computing and Applications, 26(1), 131-139.
Moro, S., Rita, P., & Coelho, J. (2017). Stripping customers' feedback on hotels through data mining: the case of Las Vegas Strip. Tourism Management Perspectives, 23, 41-52.
Moro, S., Rita, P., & Vala, B. (2016). Predicting social media performance metrics and evaluation of the impact on brand building: A data mining approach. Journal of Business Research, 69(9), 3341-3351.
Naghibi, S. A., Pourghasemi, H. R., & Abbaspour, K. (2017). A comparison between ten advanced and soft computing models for groundwater qanat potential assessment in Iran using R and GIS. Theoretical and Applied Climatology. In press.
Osei-Bryson, K. M., & Rayward-Smith, V. J. (2009). Data mining and operational research: techniques and applications.Journal of the Operational Research Society,60(8), 1043-1044.
Qabajeh, I., Thabtah, F., & Chiclana, F. (2015). A dynamic rule-induction method for classification in data mining. Journal of Management Analytics, 2(3), 233-253.
Stahl, F., & Bramer, M. (2014). Random Prism: a noise‐tolerant alternative to Random Forests. Expert Systems, 31(5), 411-420.
Talla Nobibon, F., Leus, R., & Spieksma, F. C. (2011). Optimization models for targeted offers in direct marketing: Exact and heuristic algorithms. European Journal of Operational Research, 210, 670-683.
Tapp, A. (2008). Principles of direct and database marketing. Pearson Education.
Tinoco, J., Gomes Correia, A., & Cortez, P. (2016). Jet grouting column diameter prediction based on a data-driven approach. European Journal of Environmental and Civil Engineering. In press.
Torrano‐Gimenez, C., Nguyen, H. T., Alvarez, G., & Franke, K. (2015). Combining expert knowledge with automatic feature extraction for reliable web attack detection. Security and Communication Networks, 8(16), 2750-2767.
Verbeek, H. M. W., van der Aalst, W. M. P., & Munoz-Gama, J. (2016). Divide and Conquer. Technical report, BPM Center Report Series.
Wang, L., Xu, L. D., Bi, Z., & Xu, Y. (2014). Data cleaning for RFID and WSN integration. IEEE Transactions on Industrial Informatics, 10(1), 408-418.
Wang, P., Xu, L., Zhou, S. M., Fan, Z., Li, Y., & Feng, S. (2010). A novel Bayesian learning method for information aggregation in modular neural networks. Expert Systems with Applications, 37(2), 1071-1074.
Wang, X., Chen, X., & Bi, Z. (2015a). Support vector machine and ROC curves for modeling of aircraft fuel consumption. Journal of Management Analytics, 2(1), 22-34.
Wang, Y., Liu, Y., Feng, L., & Zhu, X. (2015b). Novel feature selection method based on harmony search for email classification. Knowledge-Based Systems, 73, 311-323.
Wanke, P., Kalam Azad, M., Barros, C. P., & Hadi‐Vencheh, A. (2015). Predicting performance in ASEAN banks: an integrated fuzzy MCDM–neural network approach. Expert Systems, 33(3), 213-229.
Witten, I. H., Frank, E., Hall, M. A., & Pal, C. J. (2016). Data Mining: Practical machine learning tools and techniques. Morgan Kaufmann.
Woodside, A. G. (2005). Consumer responses to interactive advertising campaigns coupling short-message-service direct marketing and TV commercials. Journal of Advertising Research, 45, 382-401.
Xu, L., Liang, N., & Gao, Q. (2008). An integrated approach for agricultural ecosystem management. IEEE Transactions on Systems, Man, and Cybernetics, Part C (Applications and Reviews), 38(4), 590-599.
Yuan, R., Li, Z., Guan, X., & Xu, L. (2010). An SVM-based machine learning method for accurate internet traffic classification. Information Systems Frontiers, 12(2), 149-156.
Yun, U., Lee, G., & Lee, K. M. (2016). Efficient representative pattern mining based on weight and maximality conditions. Expert Systems, 33(5), 439-462.
Figures
Problem
Data Mining
Model
Top 5 Relevant
Features
Sub-ProblemN
Sub-Problem1
...
Data Mining
Model
Sub-Problem
Characterization
Feature Selection
Assessment of
Problem Division
Assessment of
Sub-Problem
Characteristics
Panel of
Experts
Figure 2 ROC curves for the inbound and original models (left) and example confusion matrix for
Figure 5 VEC curves showing the influence of the two most relevant inbound features in the predictive model.
Tables
Table 1 Assessment of relevance by the panel of experts. Model
result
Feature Description Relevance by Panel (1 - 10) * #1 #2 #3 Average 16.33% dif.best.rate.avg difference between
best rate offered and the national average
8 9 7 8.0
10.27% euribor3m daily three month Euribor rate
6 6 7 6.3
9.01% last.result.prod last campaign result for the same product in which the client was contacted
7 7 8 7.3
8.10% frequency number of times the client subscribed the deposit previously
7 6 8 7.0
5.70% call.dir call direction (inbound/outbound)
9 8 9 8.7
Table 2 List of features selected by a domain expert and expected to influence inbound call responses.
Feature Description
phone.type landline phone or mobile device from which the client called
inb.calls.n number of inbound calls in which the agent received a system alert informing that the client has been selected for the current product campaign
phone.y.usage phone banking yearly usage internet.y.usage internet banking yearly usage curr.account client current account balance
term.accounts client total term accounts balance, if available ebank subscriber of e-banking services (internet or phone) prev.nr.outb previous outbound attempts within the same campaign
Table 3 Feature selection results (best values in bold). Phase AUC ALIFT Features included
ii)a) (25 features)
0.8818 0.8424 the 27 baseline features, except for call.dir and last.prod.result, which remained constant ii)b)
(9 features)
0.7940 0.7649 features described in Table 3
iii) (34 features)
0.9069* 0.8669* both features included in ii)a) and in Table 3
Table 4 Feature reduction results (best values in bold).
Phase iv)a) iv)b) iv)c)
AUC ALIFT AUC ALIFT AUC ALIFT
Feature 0.9137 0.8730 0.9139 0.8714 0.9247* 0.8802* ag.generic X suited.rate X X X phone.y.usage X X X inb.call.since X X X dif.best.rate.avg X X X ag.created X X X prev.nr.outb X X X call.nr.schedules X X X nr.employed X X X recency X call.prev.durations X X cons.price.idx X X X cons.conf.idx X X internet.y.usage X X call.month X X inb.calls.n X X curr.account X cli.affluent X ebank X prev.contacts.durations X X X
20 features 15 features 10 features * Statistically significant under a pairwise comparison with iv)a) and iv)b).
Table 5 Realistic simulation test set results (best values in bold). Phase AUC ALIFT Features included
original 0.7481 0.7341 25 features, described by Moro et al. (2015b) inbound optimized 0.8875* 0.8641* 10 features, described in Table 4 (step iv)c))
* Statistically significant under a pairwise comparison with the original model.
Table 6 Comparison of results: Lift cumulative samples. Sample size Original model Inbound model
10% 36.4% 54.5% 20% 54.5% 63.6% 30% 63.6% 72.7% 40% 63.6% 81.8% 50% 72.7% 100.0% 60% 90.9% 100.0%