DATA MINING TO ESTIMATE BROILER MORTALITY
WHEN EXPOSED TO HEAT WAVE
Marcos Martinez Vale1; Daniella Jorge de Moura1*; Irenilza de Alencar Nääs1; Stanley Robson de Medeiros Oliveira2; Luiz Henrique Antunes Rodrigues1
1
UNICAMP/FEAGRI, Cidade Universitária Prof. Zeferino Vaz, C.P. 6011 - 13083-970 - Campinas, SP - Brasil. 2
Embrapa Informática Agropecuária, Av. Dr. André Tosello, 209, C.P. 6041 13083970 Campinas, SP Brasil.
*Corresponding author <[email protected]>
ABSTRACT: Heat waves usually result in losses of animal production since they are exposed to thermal stress inducing an increase in mortality and consequent economical losses. Animal science and meteorological databases from the last years contain enough data in the poultry production business to allow the modeling of mortality losses due to heat wave incidence. This research analyzes a database of broiler production associated to climatic data, using data mining techniques such as attribute selection and data classification (decision tree) to model the impact of heat wave incidence on broiler mortality. The temperature and humidity index (THI) was used for screening environmental data. The data mining techniques allowed the development of three comprehensible models for estimating specifically high mortality during broiler production. Two models yielded a classification accuracy of 89.3% by using Principal Component Analysis (PCA) and Wrapper feature selection approaches. Both models obtained a class precision of 0.83 for classifying high mortality. When the feature selection was made by the domain experts, the model accuracy reached 85.7%, while the class precision of high mortality was 0.76. Meteorological data and the calculated THI from meteorological stations were helpful to select the range of harmful environmental conditions for broilers 29 and 42 days old. The data mining techniques were useful for building animal production models.
Key words: THI, broiler production, environmental data
MINERAÇÃO DE DADOS E ESTIMATIVA DA MORTALIDADE ALTA
DE FRANGOS QUANDO EXPOSTOS A ONDA DE CALOR
RESUMO: As ondas de calor provocam perdas na produção animal pela sua exposição ao estresse por calor aumentando a mortalidade, e consequentemente, perdas econômicas. Bancos de dados zootécnicos e meteorológicos históricos podem conter informações que permitem modelar a mortalidade de frangos devido à incidência de ondas de calor. O objetivo foi analisar bancos de dados de frangos de corte associados a dados meteorológicos utilizando técnicas de mineração de dados, seleção de atributos e classificação (árvore de decisão) para modelar o impacto da incidência de onda de calor na mortalidade de frangos de corte. O Índice de Temperatura e Umidade (ITU) foi utilizado para descrever parte dos dados ambientais. A técnica de Mineração de Dados permitiu a construção de três modelos compreensíveis para estimar a alta mortalidade em frangos de corte. Os modelos gerados pela abordagem de seleção de atributos por Análise dos Componentes Principais e Wrapper apresentaram igual desempenho com uma precisão total de 89,3% e a classificação para alta mortalidade foi de 83,3%. Quando a seleção foi feita por especialistas do domínio, a precisão do modelo foi de 85,7%, e a da classificação para alta mortalidade foi de 76,9%. Resultados meteorológicos e o ITU calculada a partir de estações meteorológicas permitiram identificar condições ambientais prejudiciais para frangos entre 29 e 42 dias de vida. A técnica de Mineração de Dados é aplicável para construir modelos preditivos para a produção animal.
Palavras-chave: ITU, frango de corte, dados ambientais
INTRODUCTION
Brazilian poultry production has been develop-ing in a very competitive scenario. This scenario re-quires losses control to reduce production costs im-proving its productivity. The main factors that affect
higher values for the first two weeks up to 30 days of rearing (Xin et al., 1994; Cony & Zocche, 2004; Tabler et al., 2006). One way to access bird thermal comfort for studying mortality is by using an index that combines several factors (Tao & Xin, 2003; Chepete et al., 2005).
Heat wave is a meteorological event reaching extreme dry bulb temperatures that may impact on ani-mal production. These events have been more frequent lately due to the global climatic changes, however, very little is known about their impact on Brazilian broiler production. The COPA/COGECA (2004), an agricul-tural committee from the Europe Union that produces a report about European heat wave impact and losses in agriculture, shows general economical losses of 15-30% in poultry production for the heat wave that hit European producer countries in 2003. St-Pierre et al. (2003) estimated that in the United States the produc-tion loss can reach 128 million dollars when environ-mental conditions depart from the thermoneutral zone, based on the temperature and humidity index (THI) calculated from meteorological station databases.
Data mining is a promising approach to esti-mate poultry production mortality. This new research area has emerged as a means of extracting hidden pat-terns or previously unknown implicit information from large repositories of data (Fayyad et al. 1996; Fayyad & Stolorz, 1997; Rezende et al., 2005). The fascina-tion with the promise of analysis of large volumes of data has led to an increasing number of successful ap-plications of data mining in recent years. For instance, Zhang et al. (2005) showed how data mining tech-niques can be used to model native pasture produc-tivity. The results revealed that data mining techniques were very efficient to predict the main critical points and pasture productivity.
The objective of this research was to build up a model (decision tree) using data mining techniques such as feature selection and data classification, for predicting broiler mortality caused by heat wave inci-dence, using a database composed of poultry produc-tion and meteorological attributes.
MATERIAL AND METHODS
The database was organized from two similar experimental data (mortality with no significant differ-ences, P > 0.05 by T test) using 1,000 broilers each,
from November to December of 1997 and 1998 in two similar poultry houses. The results showed mortalities above normal in the 5th and 6th weeks of age due to
heat wave incidence.
The broiler houses where the flocks were reared had natural ventilation and open sides with
lat-eral curtains, and were East-West solar oriented, 22o42’
S, 47º38’ W, and altitude of 528 m. The meteorologi-cal data was taken from USP/ESALQ (2005). The da-tabase used for building the model was organized us-ing the followus-ing data: broiler mortality and corre-sponding housing and outside environmental data (dry bulb temperature, DBT; humid bulb temperature, HBT; wind speed, WS; maximum and minimum temperatures, TMAX, TMIN; relative humidity, RH; calculated black globe temperature index, BGTI; and calculated tempera-ture and humidity index, THI). The Broiler database re-ferred to the 5th and 6th weeks (between 29 and 42 days
old) in a total of 28 instances (observations), screened when the heat wave occurred. In this research both at-tribute and feature have the same meaning.
Some attributes were derived from the origi-nal data for each observation in the database, includ-ing the thermal amplitudes inside and outside the hous-ing up to five days prior to the heat wave incidence. The final database used for the analysis contained 70 attributes, distributed as follows: five coming from ex-perimental original data, 16 from the original data from the meteorological stations, 34 derived attributes from the original meteorological database, 12 derived tributes from the housing database, two derived at-tributes from the interaction between meteorological and housing database, and one class attribute which clas-sified the mortality in one of the following classes; high mortality (HM) and normal mortality (NM), as shown in Table 1.
The data mining techniques were applied ac-cording to the CRISP-DM methodology comprising the following steps: domain understanding, data acquisi-tion, understanding, preparaacquisi-tion, modeling and evalu-ation according to the knowledge from the domain ex-perts (Chapman et al., 2000).
The software used for the analysis was Weka®
largest information gain (difference in entropy) that results from choosing an attribute for splitting the data. The attributes define the possible branches of the grow-ing tree. Early assigned attributes are more important than attributes assigned later during the tree growth. In this way the “most important” attribute - whose val-ues divide the data items into nearly pure subsets with respect to the classification - represents the tree root. Thus the tree construction offers a ranking in the sig-nificance of a certain attribute regarding the classifi-cation. The attribute with the highest normalized in-formation gain is the one used to make the decision. The algorithm then recourses on the smaller sub lists. The pseudo code of the algorithm J48 can be found in (Quinlan, 1993; Quilan, 1996).
The algorithm J48 is one of best approaches for mining rules through decision trees found in the literature (Han & Kamber, 2006). Apart from that, this algorithm is available in free and commercial softwares and several experimental results using J48 for variable selection show that this algorithm maintains classiûcation accuracy in many bench mark problems, reducing signiûcantly running times (Martínez, & Fuentes, 2005).
Due to the large number of attributes gener-ated in the first data pre-processing, a feature selec-tion was used to remove the attributes with low cor-relation values. The tools used for the attribute selec-tion were: (i) - Principal Component Analysis (PCA) which involves a mathematical procedure to transform Table 1 - Summary of used data and features assumed for organizing the final data set.
Feature type: 0 - Class attribute calculated by mortality and specialist judgment; 1- Attribute of the experiment data registered inside the housing; 2 - Attribute of meteorological station (registered data); 3 - Attribute derived from meteorological station (calculated data); 4 - Attribute derived from housing (calculated data); 5 - Attribute derived from housing and meteorological (calculated data).
Feature Type Feature Type Feature Type
Mortality classifier 0 Mean HBT 3 TMIN 1 day before 3
Year of experiment 1 TMIN 3 TMIN 2 days before 3
Age, day 1 TMA2X 3 TMIN 3 days before 3
Age, week 1 RH amplitude 3 TMIN 4 days before 3
Housing TMAX 1 DBT amplitude 3 TMIN 5 days before 3
Housing TMIN 1 Mean RH 1 day before 3 Mean THI (Chepete et al., 2005) 3 Mean RH 2 days before 3 Max THI (Chepete et al., 2005) 3
Mean DBT 2 Mean RH 3 days before 3 Min THI (Chepete et al., 2005) 3
Mean absolute TMAX 2 Mean RH 4 days before 3 THI amplitude (Chepete et al., 2005) 3
Time of TMAX 2 Mean RH 5 days before 3
Mean absolute TMIN 2 Mean DBT 1 day before 3 BGTI (Moura et al., 2004) 4 Time of absolute TMIN 2 Mean DBT 2 days before 3 Housing thermal amplitude 4
Mean RH 2 Mean DBT 3 days before 3 Housing TMAX 1 day before 4
Max RH 2 Mean DBT 4 days before 3 Housing TMAX 2 days before 4
Time of max RH 2 Mean DBT 5 days before 3 Housing TMAX 3 days before 4
Min RH 2 of 1 day beforeHousing TMAX amplitude 3 Housing TMAX 4 days before 4
Time of Min RH 2 Housing TMAX amplitude
of 2 days before 3 Housing TMAX 5 days before 4
Mean WS 2 of 3 days beforeHousing TMAX amplitude 3 Housing TMIN 1 day before 4
Max WS 2 of 4 days beforeHousing TMAX amplitude 3 Housing TMIN 2 days before 4
Time of max WS 2 of 5 days beforeHousing TMAX amplitude 3 Housing TMIN 3 days before 4
Rain Index 2 TMAX 1 day before 3 Housing TMIN 4 days before 4
Global Radiation 2 TMAX 2 days before 3 Housing TMIN 5 days before 4
Photo Active radiation 2 TMAX 3 days before 3
TMAX 4 days before 3 Amplitude of housing and outsideTMAX 5
a number of (possibly) correlated variables into a smaller number of uncorrelated variables called prin-cipal components; (ii) - Chi-squared test which evalu-ated the dependence between the attribute and its clas-sifier (the class attribute); (iii) - Wrapper, that evalu-ates the attribute cluster in a machine learning process and verifies the classifying accuracy of crossing vali-dation; (iv) - Correlation Feature Selection (CFS) that searches the cluster of correlated attributes avoiding re-use of the same information; (v) - InfoGain, that evaluates the gain in information in relation to the clas-sifier; and (vi) - GainRatio that analyzes the informa-tion gain rate related to the specific class correcting impaired measurements. Alternatively, a new feature selection approach was used considering the knowl-edge of the domain experts who selected the main at-tributes based on their expertise.
The evaluation of the models was made by two domain experts (specialized in poultry production) ana-lyzing the generated models. Their evaluation took into account how much comprehensible the models are, the selected attributes that were used to build up other models with other feature selection approach, and the importance of the models concerning the mortality es-timation (the model accuracy and the class precision for high mortality).
The model accuracy was calculated by a con-fusion matrix (Table 2) and it is expressed as the per-centage of correctly classified test instances over all test instances, including True positives and True nega-tives. On the other hand, the class precision was also calculated by the confusion matrix (Table 2) and it is expressed as a rate raging from 0 to 1, representing the instances that were correctly classified as True positives or True negatives (Gomes, 2002).
The classes (HM and NM) have different num-ber of memnum-bers. For example, the class NM has 25 members, while the class HM has only three. Thus, before building the model it was necessary to balance
the number of members per class; otherwise the out-comes could be biased toward the classes with more members. One strategy to deal with this problem was to produce a random subsample of the database using sampling with replacement (Breiman, 1996). Two re-strictions were applied: preserve the total number of elements and generate a uniform distributed subsample. To accomplish that, the module Resample of Weka®
was used.
The class attribute was chosen as a function of daily broiler mortality. Using daily and weekly broiler mortalities two classes were selected (HM and NM) which took into account the predicted mortality for that specific breed. The values of daily mortality were compared with those of the weekly mortality in order to avoid classification error.
RESULTS AND DISCUSSION
In the first approach, a decision tree was built without using feature selection and class balance, gen-erating a model with low class precision for HM (Table 3). To improve the model accuracy the resample tech-nique was used to balance the number of members per class, as recommended by Breiman (1996). Thus, us-ing the feature selection approaches and resample, three comprehensible models were generated allowing the classification of the high mortality as a function of the other attributes of the database.
Two of the comprehensible models were gen-erated using Principal Component Analysis (PCA) and Wrapper feature selection as well, both yielding a model accuracy of 89.3%. The third screening of classifiers was based on the knowledge of domain experts in which the attributes that are not related to mortality were removed, generating the third decision tree, which reached a model accuracy of 85.7% (Table 3).
The HM classification yielded a class precision of 0.83 when using PCA and Wrapper selection
tech-Class Predict as C+ Predict as C- Class precision Model Accuracy1
C+ True positives False negatives Tp / (Tp + Fn)
[(Tp + Tn) / N] × 100
(Tp) (Fn)
C- False positives True negatives Tn / (Fp + Tn)
(Fp) (Tn)
Table 2 - Confusion matrix.
1N is equal to the number of instances in the test set.
Evaluation No selection PCA Wrapper Experts
Model Accuracy (%) 82.1 89.3 89.3 85.7
HM Class Precision 0.50 0.83 0.83 0.76
niques, while the selection from the experts’ point of view reached a class precision of 0.76. The class pre-cision from classification in NM was greater than 0.95, for all models, and less important from this research that focuses on high poultry mortality.
Models generated using the other feature se-lection approaches (Chi-squared, CFS, InfoGain, GainRation) were discarded because of the low model accuracy they yielded (less than 75%) and, most im-portantly, because of the low comprehensibility con-sidered by the judgment from the knowledge of the experts in poultry. In addition, the accuracy of such models was similar to that one obtained without ap-plying feature selection and resampling. The method-ologies imply the discharge of less important models from the point of view of the domain experts, and re-try other models with other approach in the domain (Chapman et al. 2000).
The use of feature selection was fundamental to identify the most salient features for building the poultry production model. In general, the use of fea-ture selection reduces the complexity of models, im-proves the predictive accuracy and comprehensibility of such models (Kim et al., 2002; Guyon & Elisseeff, 2003). Clearly, this justifies the low accuracy of the model generated without using feature selection.
The attribute selection was performed using the PCA and Wrapper approaches, which greatly improved the model accuracy, reduced the complexity and high-lighted the precision of the most important class (HM) when compared to the model without feature selec-tion and resampling. On the other hand, when com-paring the models built using PCA and Wrapper with that one generated by the experts, it was observed that the models based on feature selection yielded better results. The main reason is that experts frequently use an empirical approach to select features, which may result in a set of redundant or noisy attributes. Such attributes compromise the accuracy and the complex-ity of a model (Kim et al., 2002; Guyon & Elisseeff, 2003).
The decision tree generated from the model without feature selection and class balance is depicted in Figure 1. The root of this tree is the attribute maxi-mum wind speed (measured daily), which was inter-preted by the experts as a noise attribute. Even though the variable wind speed is well known as an impor-tant mitigation for heat stress (Tao & Xin, 2003; Sevegnani et al., 2001), the class precision found for the HM was very low (0.50). The maximum wind speed occurred always during night when the bird mortality had already taken place (from 15h00 to 18h00) which led to discharge this variable in the model.
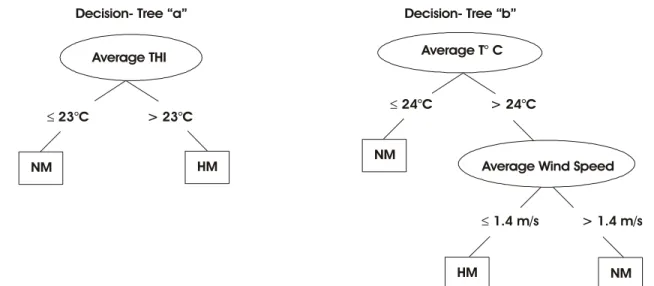
The decision trees with the best understand-ing by the domain experts were generated usunderstand-ing PCA and Wrapper; however the model built using Wrapper presented less complexity (Figure 2, Decision-Tree a), which may be an advantage for monitoring mortality based on historical and regional data.
Regarding the decision tree shown in Figure 2, Decision-Tree a, only the attribute average THI was used, which is calculated using the equation given in Chepete et al. (2005). The attribute average THI was computed considering the data from the meteorologi-cal station. The decision tree built using PCA showed an average daily dry bulb temperature and an average daily wind speed as the main attributes for predicting broiler high mortality due to heat stress, according to various authors (Teeter et al., 1985; Macari & Furlan, 2001; Tao & Xin, 2003; Chepete et al., 2005). The effect of wind speed in broiler performance in the range of 0.2 to 1.2 m s-1
was investigated by Tao & Xin (2003) and by Sevegnani et al. (2001) within the lim-its of 0.3 to 1.0 m s-1. All the authors found that
ther-mal comfort in adult broilers is dependent of average daily wind speed. In this particular experiment, the as-sociation of average local wind speed below 1.4 m s-1
with dry bulb temperature above 24oC was responsible
for high incidence of broiler mortality.
The decision tree in which the feature selec-tion was made by the domain experts was built con-sidering the average THI (Chepete et al., 2005) asso-ciated to the average daily wind speed (Figure 3). How-ever, the model accuracy was 85.7%, while the class precision for HM was 0.76, less than those generated by using PCA and Wrapper approaches.
Analyzing the meteorological data, it was ob-served that in only one of the three cases of high broiler mortality the daily maximum absolute
tempera-Figure 1 - Decision tree generated from the data without feature selection (Model accuracy = 82.1% and class precision HM = 0.50).
Max. Wind Speed
≤ 9.95 m/s > 9.95 m/s
HM
HM NM
≤ 26°C > 26°C
ture was over 32°C for more than one day. In this case two consecutive days with maximum absolute tempera-ture reaching 33 and 32°C were observed. In the other incidences, only one day with daily maximum abso-lute temperature equal or greater than 32°C was suf-ficient to lead to high broiler mortality.
The conventional definition of heat wave used for humans, as shown in INMET (2005), is not ad-equate for poultry production. Thus, characterizing a heat wave, including its magnitude and intensity, de-serves further exploration, in the sense of affecting broiler production. This confirms Abaurrea et al. (2006) findings that the heat waves in Europe and in the United States have different profiles.
One effective way to build up simpler models would be the inclusion of another attribute related to
temperature, humidity and wind speed index (THVI, Tao & Xin, 2003). The index THVI should be adjusted to broilers in the range of 29 to 42 days of age. The models showed in Figures 2 and 3 can be applied to predict broiler mortality and the use of each one of them may depend on the available data.
In general, meteorological stations generate a large number of data that are seldom used for animal production. Thus, the development of models using regional or local data to predict production losses may be useful for producers who use mitigation action to reduce the economical impact of heat wave loss.
CONCLUSION
It was possible to build up a predictive model of broiler mortality using historical flock database and local meteorological data. This model can be applied to situations in which the internal environment directly reflects the outside environmental conditions when the housing does not use cooling systems. In particular, data mining techniques such as feature selection and data classification (decision tree) are useful for build-ing animal production models that exhibit low com-plexity in terms of the number of attributes, better pre-dictive accuracy and improved comprehensibility.
ACKNOWLEDGEMENTS
To PRODETAB - Banco Mundial/EMBRAPA/ FAPESP for the project’s financial support.
REFERENCES
ABAURREA, J.; ASIN, J.; CEBRIAN, A.C.; CENTELLES, A. On the need of a changing threshold in heat wave definition. Geophysical Research Abstract, v.8, p.762-775, 2006. Figure 2 - Decision tree built using the feature selection: (a) Wrapper and (b) PCA (Both models yielded model accuracy = 89.3% and
class precision HM = 0.83).
HM NM
≤ 23°C > 23°C
Average THI Decision- Tree “a”
NM
≤ 24°C > 24°C
Average T° C Decision- Tree “b”
Average Wind Speed
≤ 1.4 m/s > 1.4 m/s
NM HM
Figure 3 - Decision tree generated with feature selection made by the domain experts (Model accuracy = 85.7%; class precision HM = 0.76).
Average THI
≤ 23°C > 23°C
NM Average
Wind Speed
≤ 1.4 m/s > 1.4 m/s
BREIMAN, L. Bagging predictors. Machine Learning, v.26, p.123-140, 1996
CHAPMAN, P.; CLINTON, J.; KERBER, R.; KHABAZA, T.; REINARTZ, T.; SHEARER, C.; WIRTH, R. CRISP-DM 1.0: step-by-step data mining guide. 2000. 78p. Available at: http:/ /www.crisp-dm.org/CRISPWP-0800.pdf. Accessed 31 Oct. 2005. CHEPETE, H.J.; CHIMBOMBI, E.; TSHEKO, R. Production performance and temperature-humidity index of Cobb 500 broilers reared in open-sided naturally ventilated houses in Botswana. In: ASAE ANNUAL MEETING, Beijing, 2005. Proceedings. Beijing: Livestock Environment, 2005. (Paper n. 701P0205).
COMITÊ DÊS ORGANISATIONS PROFESSIONALLES DE LA AGRICOLES DE LA COMMUNITÉ EUROPÉENNE - COPA/ COGECA. Assessment of the impact of the heat wave and drought of the Summer 2003 on agricultural and forestry. Cologne, 2004. 15p. Available at: http://www.meteo.uni-oeln.de/ content/klimadiagnose /summerheat2003/ pocc_03_78i4_1e.pdf. Accessed 26 Jan. 2005.
CONY, A.V.; ZOCCHE, A.T. Manejo de frangos de corte. In: MENDES, A.A.; NÄÄS, I.A.; MACARI, M. Produção de frangos de corte. Campinas: FACTA, 2004. cap.8, p.117-136.
FAYYAD, U.; PIATETSKY-SHAPIRO, G.; SMYTH, P. From data mining to knowledge discovery: an overview. Artificial Intelligence Magazine, v.17, p.37-54, 1996.
FAYYAD, U.; STOLORZ, P. Data mining and KDD: promise and challenges. Future Generation Computer Systems, v.13, p.99-115, 1997.
GOMES, A.K. Análise do conhecimento extraído de classificadores simbólicos utilizando medidas de avaliação e interessabilidade. São Carlos: ICMC-USP, 2002. 127 p. Dissertação (Mestrado). GUYON, I.; ELISSEEFF, A. An introduction to variable and feature
selection. Journal of Machine Learning Research, v.3, p.1157-1182, 2003.
HAN, J.; KAMBER, M. Data mining:concepts and techniques. 2 ed, San Francisco: Morgan Kaufmann, 2006, 770p.
INSTITUTO NACIONAL DE METEOROLOGIA - INMET. Glossário. Available at: http://www.inmet.gov.br/informacoes/ glossario/glossario.html. Accessed 27 Jan. 2005.
KIM, Y.S.; STREET, W.N.; MENCZER, F. Feature selection in data mining. In: WANG, J. Data mining:opportunities and challenges. Hershey: Idea, 2002. cap.4, p.80-105.
MACARI, M.; FURLAN, R.L. Ambiência na produção de aves em clima tropical. In: SILVA, I.J.O. DA (Ed.) Ambiência na produção de aves em clima tropical. Piracicaba: Funep, 2001. v.1, cap.2. p.31-87.
MARTÍNEZ, J.; FUENTES, O. Using C4.5 as variable selection criterion in classification tasks. In: ARTIFICIAL INTELLIGENCE AND SOFT COMPUTING, Benidorm, 2005. Proceedings. Benidorm: A. P. del Pobil, 2005. p.191-195. QUINLAN, J.R. C4.5: programs for machine learning. San
Francisco, Morgan Kaufmann, 1993. 302p.
QUINLAN, J.R. Improved use of continuous attributes in c4.5. Journal of Artificial Intelligence Research, v.4, p.77-90, 1996.
REZENDE, S.O.; PUGLIESI, J.B.; MELANDA, E.A.; DE PAULA, M.F. Mineração de dados. In: REZENDE, S.O. Sistemas inteligentes: fundamentos e aplicações. São Paulo: Manole, 2005. p.307-336.
SEVEGNANI, K.B.; MOURA, D.J.; SILVA, I.J. O.; MACARI, M.; NÄÄS, I.A. Perdas de calor sensível e latente em frangos de corte aos 49 dias, expostos à ventilação forçada. In: REUNIÃO ANUAL DA SOCIEDADE BRASILEIRA DE ZOOTECNIA, 38., Piracicaba, 2001. Anais. Piracicaba: SBZ, 2001. p.16-17. SHANNON, C.A. Mathematical theory of communication. Bell
System Technical Journal, v.27, p.379-423, 1948. ST-PIERRE, N.R.; COBANOV, B.; SCHNITKEY, G. Economic
losses from heat stress by livestock industries. Journal of Dairy Science, v.86, E Suppl., p.52-77, 2003.
TABLER, G.T.; BERRY, I.L.; MENDENHALL, A.M. Mortality patterns associated with commercial broiler production. Available at: http://www.thepoultrysite.com/ FeaturedArticle/ FATopic.asp?AREA=ProductionMgmt&Display=253. Accessed 14 Nov. 2006.
TAO, X.; XIN, H. Temperature-humidity-velocity: index for market-size broilers. In: ASAE ANNUAL INTERNATIONAL MEETING, Las Vegas, 2003. Proceedings. Las Vegas: ASAE, 2003. (ASAE Annual International Meeting. Paper n. 034037). TEETER, R.G.; SMITH, M.O.; OWENS, F.N.; ARP, S.C.; SANGIAH, S.; BREAZILE, E. Chronic heat stress and respiratory alkalosis: occurrence and treatment in broiler chicks. Poultry Science, v.64, p.1060-1064. 1985.
UNIVERSIDADE DE SÃO PAULO. Escola Superior de Agricultura “Luiz de Queiroz” - USP/ESALQ. Departamento de Física e Meteorologia. Available at: http://www.esalq.usp.br/ departamentos/lce/automatica/pagina4.html. Accessed 5 Sept. 2005.
WITTEN, I. H.; FRANK, E. Data mining: practical machine learning tools and techniques. 2.ed. San Francisco: Morgan Kaufmann, 2005. 525p.
XIN, H.; BERRY, I.L.; BARTON, T.L.; TABLER, G.T. Feed and water consumption, growth and mortality of male broilers. Poultry Science, v.73, p.610-616, 1994.
YAHAV, S.; GOLDFELD, S.; PLAVNIK, I.; HURWITZ, S. Physiological response of chickens and turkeys to relative humidity during exposure to high ambient temperature. Journal of Thermal Biology, v.20, p.245-253, 1995.
ZHANG, B.; VALENTINE, I.; KEMP, P. Modelling the productivity of naturalized pasture in the North Island, New Zeland: a decision tree approach. Ecological Modelling, v.186, p.299-311, 2005.