Chitosan/carrageenan nanoparticles: Effect of cross-linking with tripolyphosphate 1
and charge ratios 2
Susana Rodrigues1, Ana M. Rosa da Costa2, Ana Grenha1* 3
1CBME – Centre for Molecular and Structural Biomedicine / IBB – Institute for
4
Biotechnology and Bioengineering, University of Algarve, Faculty of Sciences and
5
Technology, Campus de Gambelas, 8005-139 Faro, Portugal: 2CIQA – Centre of
6
Research in Chemistry of Algarve, Faculty of Sciences and Technology, Campus de
7
Gambelas, 8005-139 Faro, Portugal
8 9 10 11 *Corresponding author: 12
E-mail address: [email protected] 13
Postal address: Centre for Molecular and Structural Biomedicine (CBME), Faculty of 14
Sciences and Technology, Building 8, Room 2.4, Campus de Gambelas, 8005-139 Faro,
15 Portugal 16 Phone: +351 289800100 - Ext. 7441 17 Fax: +351 289 818419 18 19
ABSTRACT 20
Chitosan/carrageenan/tripolyphosphate nanoparticles were prepared by polyelectrolyte
21
complexation/ ionic gelation, the latter compound acting as cross-linker. The
22
incorporation of the three components in the nanoparticle matrix was assessed by
23
analytical techniques (FTIR, XPS and TOF-SIMS).
24
Using chitosan/carrageenan nanoparticles as control, the effect of the cross-linker in the
25
particles properties was studied. A decrease in size (from 450-500 nm to 150-300 nm)
26
and in zeta potential (from +75 - +85 mV to +50 - +60 mV), and an increase in
27
production yield (from 15-20% to 25-35%), and in stability (from one week to up to 9
28
months) were observed. Also, a correlation between positive to negative charge ratios in
29
the formulations and the above characteristics was established.
30
The small size and high positive surface charge make the developed
31
chitosan/carrageenan/tripolyphosphate nanoparticles potential tools for an application in
32
mucosal delivery of macromolecules.
33 34
Keywords: chitosan, cross-linking, k-carrageenan, nanoparticles, tripolyphosphate 35
1. Introduction 37
Polymeric nanoparticles have been used increasingly in various fields, such as drug
38
delivery, imaging and tissue engineering, the first being, by far, the most reported
39
application. The main reason justifying the widespread use of polymeric nanoparticles
40
relies on the displayed high surface-to-volume ratio which improves the loading
41
capacity of the selected molecule, while providing its protection. In addition, increased
42
drug absorption might be attained by the capacity of nanoparticles to reduce epithelial
43
resistance to transport (de la Fuente, Csaba, Garcia-Fuentes & Alonso, 2008; Rawat,
44
Singh & Saraf, 2006; Reis & Ribeiro, 2006).
45
Many polymers have been used to prepare these vehicles, but those of natural origin are
46
often preferred because, as compared to synthetic counterparts, they comply more easily
47
with the requisites of biocompatibility, biodegradability and absence of toxicity that are
48
mandatory in any biomedical application (Liu, Jiao, Wang, Zhou & Zhang, 2008;
49
Malafaya, Silva & Reis, 2007). Chitosan (CS) and carrageenan (CRG) are two
marine-50
derived polymers which belong to the above mentioned class, and have demonstrated in
51
a previous study the ability to assemble into nanoparticles of 400-600 nm (Grenha et al.,
52
2010). CS is a cationic polysaccharide composed of repeating units of
N-53
acetylglucosamine and D-glucosamine that are β-(1-4)-linked (Figure 1), and presents
54
well-documented favorable properties for drug delivery such as biocompatibility,
55
biodegradability, low toxicity (Dornish, Hagen, Hansson, Peucheur, Vedier &
56
Skaugrud, 1997; Hirano, Seino, Akiyama & Nonaka, 1988) and mucoadhesiveness
57
(Lehr, Bouwstra, Schacht & Junginger, 1992). CRG is another polysaccharide, extracted
58
from red seaweed (van de Velde, Knutsen, Usov, Rollemay & Cerezo, 2002) and
59
composed of galactose and anhydrogalactose units, linked by glycosidic bonds (Figure
60
1) (Lim, Gwon, Choi, Shin & Nho, 2010). Due to its half-ester sulfate moieties,
carrageenan displays a strong ionic nature and exhibits a high capacity to react with
62
proteins (Malafaya, Silva & Reis, 2007; Mohamadnia, Zohuriaan-Mehr, Kabiri,
63
Jamshidi & Mobedi, 2007). There are two types of carrageenan that evidence
gel-64
forming ability, k- and , k-carrageenan gels being more firm than those obtained with
i-65
carrageenan, which are more elastic and soft (Bixler, 1993). The assembly of the
66
referred CS/CRG nanoparticles was mediated by polyelectrolyte complexation (Grenha
67
et al., 2010), a method that uses very mild conditions, avoiding harmful organic solvents
68
or high shear forces. Therefore, it has the general capability of protecting the
69
encapsulated molecules and retaining their activity during the encapsulation, which are
70
its principal advantages (Mohanraj & Chen, 2006; Saboktakin, Tabatabaie, Maharramov
71
& Ramazanov, 2010; Grenha, 2012). This methodology involves the interaction
72
between a chitosan with high degree of protonation and a polyanion, permitting the
73
rapid formation of nanoparticles. Their size, as well as other characteristics, might be
74
modulated by adjusting formulation parameters like the type of materials composing the
75
particles matrix, their concentration and mass ratios, amongst others (Calvo et al. 1997a;
76
Grenha, 2012).
77
In many cases, for instance if the nanoparticles are to be applied in mucosal delivery, it
78
is important to ensure that their size will permit the contact with the epithelial surface,
79
an effect that is maximised for particles between 50 and 500 nm (Desai, Labhasetwar,
80
Amidon & Levy, 1996; Jani, Halbert, Langridge & Florence, 1990). Preparing
81
nanoparticles in this size range is facilitated by the use of adequate cross-linking agents.
82
Tripolyphosphate (TPP) is a non-toxic polyanion (Figure 1) known for its capacity to
83
cross-link chitosan, a reaction mediated by electrostatic forces, resulting in the
84
formation of ionic cross-linked networks (Janes, Calvo & Alonso, 2001; Mi, Sung,
85
Shyu, Su & Peng, 2003).
The objective of this work was to produce CS/CRG nanoparticles, including in the
87
formulation TPP as cross-linking agent, and to evaluate the effect of the presence of this
88
polyanion on the properties of nanoparticles, namely concerning size, surface charge
89
and stability. To do so, different amounts of cross-linker were used and formulations
90
with different polymeric mass ratios were tested. Reduced size and strong positive
91
surface charge would improve the nanoparticles contact with mucosal epithelial
92
surfaces, which is very positive when considering an application in mucosal drug
93 delivery. 94 95 2. Experimental 96 2.1. Materials 97
Chitosan (low molecular weight, deacetylation degree = 75-85%), pentasodium
98
tripolyphosphate, glycerol and glacial acetic acid were supplied by Sigma Chemicals
99
(Germany). k-carrageenan and potassium bromide (KBr) were obtained from FMC
100
Biopolymer (Norway) and Riedel-del-Haën (Germany), respectively. Ultrapure water
101
(Milli-Q Plus, Millipore Iberica, Spain) was used throughout.
102 103
2.2. Nanoparticles preparation 104
CS/CRG/TPP nanoparticles were prepared by a modification of a previously
105
described methodology (Grenha et al., 2010), based on the polyelectrolyte complexation
106
of CS with CRG and additional ionic gelation of chitosan with TPP anions. Briefly, CS
107
was dissolved in 1% (w/w) acetic acid to obtain a solution of 1 mg/mL and CRG and
108
TPP were dissolved in purified water to obtain stock solutions of 2.5 and 1.0 mg/mL,
109
respectively. Different volumes of the latter solutions were mixed in order to obtain
110
volumes of 0.8 mL of solutions with the required concentrations of both components.
The spontaneous formation of nanoparticles occurs upon incorporation, under gentle
112
magnetic stirring at room temperature, of the aforementioned solutions into 2 mL of the
113
CS solution, corresponding to final theoretical CS/CRG/TPP ratios varying from 4/1/0
114
to 7/1/1 (w/w).
115
Nanoparticles were concentrated by centrifugation at 16 000 x g on a 10 µL glycerol
116
layer for 30 min at 15 °C (centrifuge 5804R, Eppendorf, Germany). The supernatants
117
were discarded and nanoparticles were ressuspended in 200 µL of purified water.
118 119
2.3. Nanoparticles physicochemical characterization 120
The production yield of nanoparticles was calculated by gravimetry. Fixed volumes
121
of nanoparticle suspensions were centrifuged (16 000 x g, 30 min, 15 °C), and
122
sediments were freeze-dried over 24 h at -34 °C, followed by a gradual increase in
123
temperature until 20 °C, using a Labconco freeze dryer (Labconco, USA) (n = 3).
124
The process yield (P.Y.) was calculated as follows: P.Y. (%) = (nanoparticle
125
sediment weight/total solid weight) x 100.
126
The morphological examination of CS/CRG/TPP nanoparticles was conducted by
127
transmission electron microscopy (TEM) (JEM-1011, JEOL, Japan). The samples were
128
stained with 2% (w/v) phosphotungstic acid and placed on copper grids with Formvar®
129
films for TEM observation.
130
Measurements of nanoparticle size and zeta potential were performed on freshly
131
prepared samples by photon correlation spectroscopy and laser Doppler anemometry,
132
respectively, using a Zetasizer Nano ZS (Malvern Instruments, Malvern, UK). For the
133
analysis of particle size and determination of the electrophoretic mobility, each sample
134
was diluted to the appropriate concentration with ultrapure water and placed in the
electrophoretic cell. Each analysis was performed at 25 °C. Three batches of each
136
formulation were analyzed (n = 3).
137 138
2.4. Nanoparticle stability study 139
Aliquots of nanoparticle formulations with and without TPP (formulations 5/1/1 and
140
5/1/0, respectively) were stored at 4 ºC. Nanoparticle sizes and zeta potentials were
141
monitored as a function of time for 250 days, using the technique described above (n =
142
3).
143 144
2.5. Nanoparticles chemical analysis 145
2.5.1. Fourier transform infrared (FTIR) spectroscopy 146
The interactions between the different components of the nanoparticulate systems
147
were analyzed by FTIR. Infrared spectra of the specimen powders, namely CS, CRG
148
and TPP, and CS/CRG/TPP nanoparticles (formulation 5/1/1), were recorded using a
149
FTIR spectrophotometer (Tensor 27, Bruker, Germany). Prior to the assay, the samples
150
were gently triturated with KBr and compressed into discs.
151
For each spectrum a 32-scan interferogram was collected in transmittance mode with
152
a 4 cm-1 resolution in the 4000–400 cm-1 region at room temperature.
153 154
2.5.2. Surface analysis by X-Ray photoelectron spectroscopy (XPS) and time-of-155
flight secondary ion mass spectrometry (TOF-SIMS) 156
The surface of CS/CRG/TPP nanoparticles was analyzed to determine their chemical
157
composition. To do so, a droplet of nanoparticles (formulations 4/1/1 and 5/1/1) was
158
placed directly on a polished monocrystalline silicon wafer, used as a sample holder.
159
The droplet was then allowed to dry in a desiccator, prior to the analyses. The surface of
the samples was analyzed by XPS (K-Alpha ESCA, Thermo Scientific, UK) and
TOF-161
SIMS (TOF-SIMS IV, Ion-TOF GmbH, Germany). Solutions of the different
162
compounds (CS, CRG and TPP) were analysed separately as controls.
163
The XPS measurements were carried out using monochromatic Al-Ka radiation (hv =
164
1486.6 eV), and photoelectrons were collected from a take-off angle of 90° relative to
165
the sample surface. The X-Ray monochromatic spots were 400 µm in diameter and the
166
correspondingly sampling area was 0.1256 mm2. Measurements were performed in
167
constant analyzer energy (CAE) mode with 100 eV pass energy for survey spectra and
168
20 eV pass energy for high-resolution spectra. Charge referencing was done by setting
169
the lower binding energy C 1s photopeak at 285.0 eV, the C 1s hydrocarbon peak
170
(Briggs & Seah, 1983). Surface elemental composition was determined using the
171
standard Scofield photoemission cross section. Residual vacuum in the analysis
172
chamber was maintained at around 3 x 10⁻⁹ mbar.
173
For TOF-SIMS analyses, samples were bombarded with a pulsed bismuth ion beam
174
(Bi3+) generated with a liquid metal ion gun operated at 25 keV and a 45° incidence
175
with respect to the sample surface. The secondary ions generated were extracted with a
176
10 kV voltage, and their time-of-flight from the sample to the detector was measured in
177
a reflectron mass spectrometer. Electron flood gun charge compensation was necessary
178
during measurements. A raster size of 500 µm × 500 µm was used, and at least three
179
different spots were analyzed under the “static” condition with ion doses of 2 x 10¹²
180
ions/cm2. The calibration of the mass spectra in the positive mode was based on
181
hydrocarbon peaks such as CH3+, C2H3+, C3H5+ and C7H7+. Negative spectra were
182
calibrated to the C-, C2-, C3-, C4-, C2H-, C3H- and C4H- peaks before further analysis. The
183
experimental conditions (ion type, beam voltage, and primary ion dose) were
184
maintained constant for each experiment.
186
2.6. Statistical analysis 187
The t-test and the one-way analysis of variance (ANOVA) with the pair wise
188
multiple comparison procedures (Student-Newman-Kleus Method) were performed to
189
compare two or multiple groups, respectively. All analyses were run using the
190
SigmaStat statistical program (Version 3.5, SyStat, USA) and differences were
191
considered to be significant at a level of p < 0.05.
192 193
3. Results and discussion 194
3.1. CS/CRG/TPP nanoparticles characterization 195
CS/CRG/TPP nanoparticles were produced by a very mild polyelectrolyte
196
complexation/ionic gelation method, as described in the Experimental Section. Briefly,
197
when the three components are mixed, an electrostatic interaction is established between
198
the positively charged amino groups of CS and the negatively charged sulphate and
199
phosphate groups of CRG and TPP, respectively, leading to the nanoparticle formation
200
in a process derived from inter- and intramolecular linkages mediated by the anionic
201
molecules (Janes, Calvo & Alonso, 2001). TPP affords a further intense interaction, as it
202
provides a cross-linking effect. Figure 2 displays a TEM microphotograph of
203
representative CS/CRG/TPP nanoparticles, showing a spherical morphology and
204
compact structure.
205
An estimation of the positive to negative (+/-) charge ratios for the different
206
formulations was made, based on the following assumptions: 1) Chitosan was
207
considered to have one positive charge per deacetylated monomer and, since it has a
208
deacetylation degree of 75-85%, a mean value of 0.8 positive charges per monomer was
209
used. According to a reported method (Ma et al, 2008) an average monomeric molecular
weight of 169 g/mol for this deacetylation degree was obtained; 2) Carrageenan was
211
assumed to be in the sodium salt form, to which corresponds a mass of 408 g/mol and a
212
negative charge per disaccharide monomer unit; 3) Pentasodium tripolyphosphate has a
213
molar mass of 368 g/mol and five negative charges per anion. The mass of each
214
compound in every formulation was then converted to moles of charge and the +/-
215
molar ratio was calculated.
216
As can be seen in Figure 3, formulations with mass ratios below 4/1/1 (as 2/1/0.5 and
217
3/1/1), which evidence a +/- charge ratio around 1 (Figure 3A), resulted in precipitation
218
(Figure 3B). The observed precipitation for lower ratios is due to the presence of an
219
excess of anionic charges, which neutralize chitosan positive charges and, thus, reduce
220
or eliminate electrostatic repulsion, leading to precipitation. In fact, a 1:1 +/- charge
221
stoichiometry does not mean that complete charge neutralization will occur, due to
222
different charge spacings in the intervenient species and to steric constraints. However,
223
one may assume a preferential interaction between the sulphate and the ammonium
224
groups, both weakly hydrated, instead of with the strongly hydrated counterions
225
(Crouzier & Picart, 2009). The same assumption should apply to TPP polyanion. This
226
would lead to mainly an intrinsic charge matching in detriment of an extrinsic charge
227
compensation and, thus, to a small deviation from neutrality.
228
On the contrary, the formulation corresponding to a mass ratio of 7/1/0, which
229
displays a +/- charge ratio of 13.5, did not lead to nanoparticle formation. As observed
230
by other authors and, according to the described formation mechanism of nanoparticles,
231
which is mediated by electrostatic interactions, the absence of nanoparticle formation is
232
attributed to an insufficient number of anionic charges to neutralise CS amino groups
233
(Calvo, Remuñán-López, Vila-Jato & Alonso, 1997a; Fernández-Urrusuno, Calvo,
234
Remuñán-López, Vila-Jato & José Alonso, 1999). For this reason, Figure 4 only depicts
the physicochemical characteristics of CS/CRG/TPP nanoparticles of mass ratios
236
between 4/1/0 and 6/1/1.
237
Observing in Figure 4A the data corresponding to formulations containing only
238
CS/CRG (4/1/0 to 6/1/0), no significant differences are observed for both size and zeta
239
potential, which lay around 450-500 nm and +80 mV, respectively. However, bearing in
240
mind the observations of Figure 3A, concerning charge ratios, there is a tendency to
241
decrease the size from the formulation 4/1/0 (charge ratio of 7.7) to 6/1/0 (charge ratio
242
of 11.6), which is attributed to the increase in the charge ratio, as reported elsewhere
243
(Chen, Mohanraj, Wang & Benson, 2007; Nizri, Magdassi, Schmidt, Cohen & Talmon,
244
2004; Nizri, Makarsky, Magdassi & Talmon, 2009). Increasing CRG content in the
245
formulation (from 6/1/0 to 4/1/0) leads to a lower charge ratio due to the negative
246
charge of CRG sulphate groups. This resulted, as expected, in a zeta potential decrease.
247
Comparing these data with some reported previously for CS/CRG nanoparticles
248
(Grenha et al., 2010), we observe similar tendencies but smaller nanoparticle sizes in the
249
present work for comparable formulations, which might be explained by the use of
250
chitosan and carrageenan from different suppliers (van de Velde, Knutsen, Usov,
251
Rollemay & Cerezo, 2002). In Figure 4B it is seen that the production yields are
252
relatively low (13-19%) and comparable in all cases. In the present study, CS/CRG
253
nanoparticles were used as control.
254
The incorporation of TPP in the matrix of nanoparticles succeeded in providing an
255
effective cross-linking effect. More specifically, the presence of TPP resulted in
256
alterations on all the typical characterization parameters, namely the nanoparticle size
257
and zeta potential (Figure 4A), as well as production yield (Figure 4B). For the highest
258
amount of TPP incorporated (mass ratio of 1 compared to chitosan), particle size
259
decreased to 176-208 nm (p < 0.05) and zeta potential also decreased from +80 mV to
approximately +50 mV (p < 0.05). Size decrease is attributed to the cross-linking effect,
261
which induces the condensation of polymeric chains, resulting in smaller particles. The
262
simultaneous decrease in zeta potential is a consequence, not only of the inclusion of a
263
negatively charged material in the matrix of nanoparticles, but also of the general size
264
decrease, which possibly exposes a lower number of charged groups because of the
265
diminished surface. Interestingly, it can be observed that the incorporation of a mass
266
ratio of only 0.5 of TPP is enough to induce a clear effect on size and zeta potential, but
267
a higher amount of cross-linking agent (mass ratio of 1 compared to chitosan) is
268
necessary to produce a significant effect on production yield (p < 0.05). In fact, if the
269
formulation 4/1 is considered as example, it is seen by observation of Figure 4 that the
270
addition of 0.5 TPP does not modify the production yield, but it significantly decreases
271
both the nanoparticles size, by 45% (from 491 nm to 269 nm), and the zeta potential, by
272
25% (from +78 to +54 mV). A further increase of 0.5 TPP, resulting in a final
273
CS/CRG/TPP = 4/1/1, results in a significant increase of the production yield to 36%,
274
while the changes in the size and zeta potential, although significant (p < 0.05), are not
275
very pronounced, as size decreases 61 nm and zeta potential 4 mV. This trend was
276
similarly observed for the remaining formulations and, in all cases, the polydispersity
277
index was lower than 0.3. The inclusion of TPP in the nanoparticles was also observed
278
to result in unimodal size distribution.
279
The production yield practically doubled in all formulations with the highest amount
280
of TPP (p < 0.05), reaching a maximum of 36% for CS/CRG/TPP = 4/1/1. This
281
behaviour could be explained by the specific mechanism of nanoparticle formation,
282
according to which a determined amount of negative charges is necessary to provide a
283
certain degree of neutralisation of chitosan amino groups, which leads to the formation
284
of nanoparticles. When adding 0.5 TPP the cross-linking occurs, decreasing the size of
nanoparticles, but the amount of phosphate groups is not enough to increase the number
286
of formed nanoparticles, an effect that is observed when TPP amount is doubled. The
287
obtained results are in accordance with the ability of TPP to cross-link chitosan,
288
demonstrating in this case the capacity to decrease the size of chitosan-based
289
nanoparticles obtained by polyelectrolyte complexation with another polymer.
290
These results demonstrate, as a whole, that the charge ratio plays a critical role in the
291
production of nanoparticles by electrostatic interactions. In fact, it is shown that the
292
final properties of CS/CRG/TPP nanoparticles can be adjusted by modulating charge
293
ratios.
294 295
3.2. Nanoparticles stability study 296
The data corresponding to nanoparticles size evolution over time is depicted in
297
Figure 5, for formulation CS/CRG/TPP = 5/1/1 and for the corresponding CS/CRG
298
formulation, which was used as control. The rationale of conducting this assay in water
299
was the interest in obtaining information on the nanoparticles stability in the
300
resuspension medium. In the cases where the nanoparticles are an intermediate product
301
of the final drug delivery system, as reported in some works of our group (Grenha,
302
Seijo, Serra & Remuñán-López, 2007; Al-Qadi, Grenha & Remuñán-López, 2011), this
303
could avoid the need of extra procedures to stabilize the nanoparticles, as a
304
lyophilization step for instance.
305
The formulation without TPP tends to demonstrate some degree of size variation,
306
although not statistically significant, accompanied by an increase in the polydispersity
307
after 7 days of storage. On the contrary, the formulation containing TPP evidenced
308
improved stability, without signals of significant size variation during the experimental
309
period of 250 days. Zeta potential was also monitored in this study, but no alterations
were found over time for either of the assayed formulations (data not shown). Other
311
authors reported the stability of CS/TPP nanoparticles when stored at 5 ºC for 15 days
312
in non-buffered medium, further observing an increase in the polydispersity after that
313
period, as the standard deviation of mean size of the nanoparticles registered a
314
significant increase (López-León, Carvalho, Seijo, Ortega-Vinuesa & Bastos-González,
315
2005). The results found in the present study for the CS/CRG/TPP formulation indicate
316
that TPP acts as a stabiliser, possibly because of its cross-linking effect, which causes
317
polymeric molecules to establish stronger interactions with each other to form a more
318
stable structure, less prone to aggregation. Actually, cross-linking reactions have been
319
described to improve the properties of particulates (Mi, Sung, Shyu, Su & Peng, 2003),
320
hydrogels (Sung, Huang, Chang, Huang & Hsu, 1999) and scaffolds (Adekogbe &
321
Ghanem, 2005), amongst other structures.
322 323
3.3. Chemical analysis of nanoparticles 324
As commented above, formulations containing TPP showed different
325
physicochemical characteristic as compared to those without TPP, which suggests that
326
TPP is in fact incorporated in the matrix of nanoparticles. Nevertheless, an indubitable
327
demonstration of TPP presence is possible only by chemical analysis of the
328
formulations. In this manner, specific techniques of chemical analysis, such as FTIR,
329
XPS and TOF-SIMS, were used to characterize the chemical composition of
330
nanoparticles, the last two techniques referring to surface analysis.
331 332
3.3.1. FTIR analysis 333
The FTIR spectrum of CS/CRG/TPP nanoparticles is depicted in Figure 6, along with
334
the spectra of all the materials separately (CS, CRG and TPP), which were used as
controls in this assay. TPP spectrum presents two intense absorption bands at 1147 and
336
906 cm-1, attributed, respectively, to P=O and P-O along with P-O-P. The overlapping
337
of the former with the sulphate band of k-carrageenan (van de Velde, Knutsen, Usov,
338
Rollemay & Cerezo, 2002) and of the latter with the carbohydrate bands, renders the
339
detection of their presence in the nanoparticles ambiguous. Moreover, those bands are
340
expected to shift upon protonation and hydrogen bonding (Jiang, Saxena, Song, Ward,
341
Beveridge & Myneni, 2004), which may occur during particle formation. However, the
342
collapse of the sulphate and polysaccharide bands observed in the nanoparticles may be
343
accounted for if TPP is present, especially if shifting of the 1147 cm-1 band occurred.
344
Also, the band at 894 cm-1 in the nanoparticles may be attributed to a shift in the 906
345
cm-1 band of TPP. The amide bands are masked by the 1644 cm-1 bending band
346
of adsorbed water (Wilson, Smith, Kacurakova, Saunders, Wellner & Waldron, 2000)
347
and the new 1539 cm-1 absorption of the amino groups in protonated CS.
348 349
3.3.2. Surface analysis by XPS and TOF-SIMS 350
XPS is one of the most commonly used techniques of surface analysis. Upon
351
exposure of the sample to an X-ray beam, the binding energies of characteristically
352
emitted photoelectrons are measured, providing information on the elements from
353
which they originate, as well as their chemical bonding. Table 1 displays the percentage
354
of each chemical element present in the sample of either controls (CS, CRG and TPP)
355
or nanoparticles. The final chemical composition of a sample can be obtained from core
356
photoemission intensity peak areas using the Shirley background subtraction technique
357
from the survey spectra. The element composition can be quantified by using X-ray
358
photoelectron intensity values and the Scofield theoretically derived set of atomic
359
sensitivity factors. Some of the samples showed an intensive silicon signal (data not
shown), which is attributed to the substrate, as a consequence of an incomplete coating
361
of the substrate surface with the sample. These Si signals do not compromise the
362
obtained results and are not included in Table 1. The survey of controls detected the
363
expected elements, such as carbon (C), oxigen (O), nitrogen (N), phosphorus (P) and
364
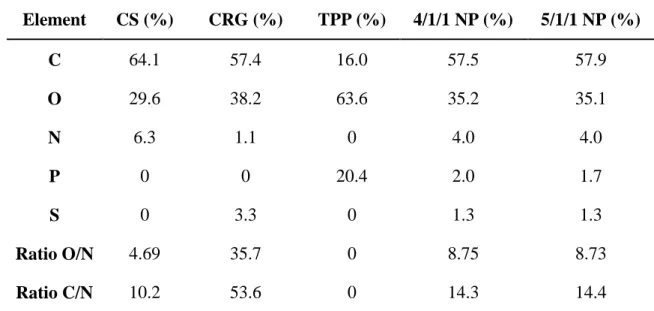
sulfur (S). The obtained CS composition (64.1% C, 29.6% O and 6.3% N) is similar to
365
that observed by Silva et al., who used the same CS type to produce membranes and
366
obtained 66.4% C, 28.0% O and 5.6% N. In addition, these authors report an O/N ratio
367
of 4.98, which is close to that of the present work (4.69) (Silva et al., 2008).
368
In this work, the prepared nanoparticles were found to contain approximately 57% C,
369
35% O, 4% N, 2% P and 1% S, the content of P being necessarily attributed to the
370
cross-linking agent TPP, and that of S having origin in CRG. The obtained atomic
371
percentages of C, O, N and P were comparable to those reported in other works for the
372
analysis of CS/TPP nanoparticles (53.8% C, 33.8% O, 4.5% N and 2.7% P) (Calvo,
373
Remuñan-López, Vila-Jato & Alonso, 1997b; Grenha, Seijo, Serra & Remuñán-López,
374
2007). The slight variations can be explained by the use of CS of different
375
characteristics and the analysis of nanoparticles with different compositions and mass
376
ratios. The C/N ratio of nanoparticles assayed in the present study (14.3) is slightly
377
higher than those reported by Grenha et al. (11.9)(Grenha, Seijo, Serra &
Remuñán-378
López, 2007) and Calvo et al. (10.9)(Calvo, Remuñan-López, Vila-Jato & Alonso,
379
1997b). This difference is attributed to the presence of an extra compound in the
380
nanoparticles formulation (CRG), which increased the amount of C, thereby increasing
381
the C/N ratio.
382
Unexpectedly, a certain amount of C and N were detected in the TPP and CRG
383
samples, respectively. This effect was reported by other authors as corresponding to the
384
atmospheric exposure of the samples, which led to the adsorption of some adventitious
carbon (Barr & Seal, 1995; Swift, 1982) and nitrogen (Allott, Curtis, Hall, Harriman &
386
Battarbee, 1995; Baltrusaitis, Jayaweera & Grassian, 2009; Edwards, Zak, Kellner,
387
Eisenlord & Pregitzer, 2011; Rao, Rao & Ppabhakaran, 1987) on the samples surface.
388
In contrast to photoelectron spectroscopy techniques such as XPS, TOF-SIMS not
389
only provides information on the elements present on analysed surfaces, but also offers
390
detailed molecular information with high sensitivity. This technique has been useful in
391
the characterization of surface chemistry of pharmaceutical systems (Barnes, Kempson
392
& Prestidge, 2011). Figure 7 displays the negative mass spectra, between 50 and 110
393
mass/u, obtained by TOF-SIMS for each of the analysed samples.
394
The spectrum of CS (Figure 7A) evidences a peak at m/z 58 corresponding to
395
C2H4NO (Al-Qadi, Grenha & Remuñán-López, 2011), as well as peaks at m/z 59
396
(C2H3O2), 69 (C3HO2), and 71 (C3H3O2). Typical fragments of chitosan were also
397
detected in the sample of control chitosan, such as C14H9NO, C4H21N14O and C8H15NO6
398
(data not shown), the latter representing one of the typical units of chitosan molecule,
399
N-acetyl-D-glucosamine (Grenha, Remunan-Lopez, Carvalho & Seijo, 2008; Grenha, 400
Seijo, Serra & Remuñán-López, 2007). The CRG spectrum (Figure 7B) is dominated by
401
SO2, SO3 and SO4H peaks, at m/z 64, 80 and 97, respectively. Smaller peaks, attributed
402
to saccharide species, as well as to SO4, are also present. TPP spectrum (Figure 7C)
403
consists of two peaks, corresponding to PO2 and PO3, at m/z 63 and 79 (Al-Qadi,
404
Grenha & Remuñán-López, 2011).
405
As it is demonstrated in Figure 7 C and D, the mass spectra of both nanoparticle
406
formulations evidence peaks that are characteristic of all the previous spectra, which
407
correspond to controls. The obtained results are in agreement with those previously
408
observed in the XPS analysis, indicating the presence of all the components (CS, CRG
409
and TPP) in the nanoparticles and suggesting a homogeneous distribution of the various
constituents through their matrix. However, given the novelty of this technique, few
411
references were found reporting results of the application of TOF-SIMS on similar
412
materials and those found report fragment peaks with higher masses (mass/u), thus, the
413
establishment of comparisons with previously developed works was very scarce.
414 415
4. Conclusions 416
In this work, nanoparticles comprising CS, CRG and TPP were produced and
417
characterized using several techniques such as photon correlation spectroscopy and laser
418
Doppler anemometry, TEM, FTIR, XPS, and TOF-SIMS. The three components were
419
identified in the FTIR, XPS and TOF-SIMS spectra of the nanoparticles, thus indicating
420
an effective association of all the materials. In particular, their detection by the surface
421
analysis techniques suggests a homogeneous distribution through the nanoparticles’
422
matrix.
423
TPP acted as a cross-linker agent and, therefore, enabled the production of
424
nanoparticles with smaller size, apart from increasing their production yield. In
425
addition, the presence of TPP in the nanoparticle matrix increased their stability,
426
providing a shelf-life of at least 9 months. Charge ratios were demonstrated to play a
427
critical role in the nanoparticles formation, since a ratio around 1 leads to precipitation,
428
owing to charge neutralization, while very high charge ratios do not provide enough
429
charges to permit an interaction that induces nanoparticle formation. Overall, it was
430
demonstrated that by modulating charge ratios, the final properties of CS/CRG/TPP
431
nanoparticles can be adjusted to specific applications.
432
Taking into account the small size and high positive charge displayed by the
433
developed nanosystems, they are considered to hold potential for an application in
434
mucosal delivery of macromolecules.
436
Acknowledgement 437
This work was supported by national Portuguese funding through FCT - Fundação
438
para a Ciência e a Tecnologia, project PEst-OE/EQB/LA0023/2011 and
PTDC/SAU-439
FCF/100291/2008. The authors thank Carmen Serra from C.A.C.T.I, University of
440
Vigo, Spain, for the helpful analysis of XPS and TOF-SIMS results.
441 442
References 443
Adekogbe, I., & Ghanem, A. (2005). Fabrication and characterization of
DTBP-444
crosslinked chitosan scaffolds for skin tissue engineering. Biomaterials, 26(35),
7241-445
7250.
446
Al-Qadi, S., Grenha, A., & Remuñán-López, C. (2011). Microspheres loaded with
447
polysaccharide nanoparticles for pulmonary delivery: Preparation, structure and surface
448
analysis. Carbohydrate Polymers, 86(1), 25-34.
449
Allott, T. E. H., Curtis, C. J., Hall, J., Harriman, R., & Battarbee, R. W. (1995). The
450
impact of nitrogen deposition on upland surface waters in Great Britain: A regional
451
assessment of nitrate leaching. Water, Air, & Soil Pollution, 85(2), 297-302.
452
Baltrusaitis, J., Jayaweera, P. M., & Grassian, V. H. (2009). XPS study of nitrogen
453
dioxide adsorption on metal oxide particle surfaces under different environmental
454
conditions. Physical Chemistry Chemical Physics, 11(37), 8295-8305.
455
Barnes, T. J., Kempson, I. M., & Prestidge, C. A. (2011). Surface analysis for
456
compositional, chemical and structural imaging in pharmaceutics with mass
457
spectrometry: A ToF-SIMS perspective. International Journal of Pharmaceutics,
Barr, T. L., & Seal, S. (1995). Nature of the Use of Adventitious Carbon as a
Binding-460
Energy Standard. Journal of Vacuum Science & Technology A - Vacuum Surfaces and
461
Films, 13(3), 1239-1246. 462
Bixler, H.J. (1993). The carrageenan connection IV. British Food Journal, 96, 12–17. 463
Briggs, D. & Seah, M.P. (1983). Practical Surface Analysis by Auger and X-Ray
464
Photoelectron Spectroscopy. New York: John Wiley & Sons. 465
Calvo, P., Remuñán-López, C., Vila-Jato, J. L., & Alonso, M. J. (1997a). Novel
466
hydrophilic chitosan-polyethylene oxide nanoparticles as protein carriers. Journal of
467
Applied Polymer Science, 63(1), 125-132. 468
Calvo, P., Remuñán-López, C., Vila-Jato, J. L., & Alonso, M. J. (1997b). Chitosan and
469
Chitosan/Ethylene Oxide-Propylene Oxide Block Copolymer Nanoparticles as Novel
470
Carriers for Proteins and Vaccines. Pharmaceutical Research, 14(10), 1431-1436.
471
Chen, Y., Mohanraj, V. J., Wang, F., & Benson, H. A. E. (2007). Designing
chitosan-472
dextran sulfate nanoparticles using charge ratios. AAPS PharmSciTech, 8(4), 131–139.
473
Crouzier, T., Picart, C. (2009). Ion pairing in polyelectrolyte multilayer films containing
474
polysaccharides. Biomacromolecules, 10(2), 433-442.
475
de la Fuente, M., Csaba, N., Garcia-Fuentes, M., & Alonso, M. J. (2008). Nanoparticles
476
as protein and gene carriers to mucosal surfaces. Nanomedicine, 3(6), 845-857.
477
Desai, M. P., Labhasetwar, V., Amidon, G. L., & Levy, R. J. (1996). Gastrointestinal
478
uptake of biodegradable microparticles: effect of particle size. Pharmaceutical
479
Research, 13(12), 1838-1845. 480
Dornish, M., Hagen, A., Hansson, E., Peucheur, C., Vedier, F., & Skaugrud, O. (1997).
481
Safety of Protasan™: Ultrapure chitosan salts for biomedical and pharmaceutical use. 482
Lyon: Jacques Andre publisher.
483
Edwards, I. P., Zak, D. R., Kellner, H., Eisenlord, S. D., & Pregitzer, K. S. (2011).
484
Simulated Atmospheric N Deposition Alters Fungal Community Composition and
485
Suppresses Ligninolytic Gene Expression in a Northern Hardwood Forest. Plos One,
486
6(6), e20421. 487
Fernández-Urrusuno, R., Calvo, P., Remuñán-López, C., Vila-Jato, J. L., & José
488
Alonso, M. (1999). Enhancement of Nasal Absorption of Insulin Using Chitosan
489
Nanoparticles. Pharmaceutical Research, 16(10), 1576-1581.
490
Grenha, A. (2012). Chitosan nanoparticles: a survey of preparation methods. Journal of
491
Drug Targeting, doi: 10.3109/1061186X.2011.654121. 492
Grenha, A., Gomes, M. E., Rodrigues, M., Santo, V. E., Mano, J. F., Neves, N. M., &
493
Reis, R. L. (2010). Development of new chitosan/carrageenan nanoparticles for drug
494
delivery applycations. Journal of Biomedical Materials Research Part A, 92A,
1265-495
1272.
496
Grenha, A., Remuñán-López, C., Carvalho, E. L., & Seijo, B. (2008). Microspheres
497
containing lipid/chitosan nanoparticles complexes for pulmonary delivery of therapeutic
498
proteins. European Journal of Pharmaceutics and Biopharmaceutics, 69(1), 83-93.
499
Grenha, A., Seijo, B., Serra, C., & Remuñán-López, C. (2007). Chitosan
Nanoparticle-500
Loaded Mannitol Microspheres: Structure and Surface Characterization.
501
Biomacromolecules, 8(7), 2072-2079. 502
Hirano, S., Seino, H., Akiyama, Y., & Nonaka, I. (1988). Biocompatibility of chitosan
503
by oral and intravenous administrations. Polymer Materials and Science Engineering,
504
59, 897-901. 505
Janes, K. A., Calvo, P., & Alonso, M. J. (2001). Polysaccharide colloidal particles as
506
delivery systems for macromolecules. Advanced Drug Delivery Reviews, 47(1), 83-97.
507
Jani, P., Halbert, G. W., Langridge, J., & Florence, A. T. (1990). Nanoparticle Uptake
508
by the Rat Gastrointestinal Mucosa: Quantitation and Particle Size Dependency.
509
Journal of Pharmacy and Pharmacology, 42(12), 821-826. 510
Jiang, W., Saxena, A., Song, B., Ward, B. B., Beveridge, T. J., & Myneni, S. C. B.
511
(2004). Elucidation of functional groups on Gram-positive and Gram-negative bacterial
512
surfaces using infrared spectroscopy. Langmuir, 20, 11433-11442.
513
Lehr, C. M., Bouwstra, J. A., Schacht, E. H., & Junginger, H. E. (1992). In vitro
514
evaluation of mucoadhesive properties of chitosan and some other natural polymers.
515
International Journal of Pharmaceutics, 78(1-3), 43-48. 516
Lim, Y. M., Gwon, H. J., Choi, J. H., Shin, J., & Nho, Y. C. (2010). Preparation and
517
Biocompatibility Study of Gelatin/Kappa-carrageenan Scaffolds. Macromolecular
518
Research, 18, 29-34. 519
Liu, Z., Jiao, Y., Wang, Y., Zhou, C., & Zhang, Z. (2008). Polysaccharides-based
520
nanoparticles as drug delivery systems. Advanced Drug Delivery Reviews, 60, 1650–
521
1662.
522
López-León, T., Carvalho, E. L. S., Seijo, B., Ortega-Vinuesa, J. L., &
Bastos-523
González, D. (2005). Physicochemical characterization of chitosan
524
nanoparticles:electrokinetic and stability behavior. Journal of Colloid and Interface
525
Science, 283, 344–351. 526
Ma, O., Lavertu, M., Sun, J., Nguyen, S., Buschmann, M. D., Winnik & F. M.,
527
Hoemann, C. D. (2008). Precise derivatization of structurally distinct chitosans with
528
rhodamine B isothiocyanate, Carbohydrate Polymers, 72, 616–624.
529
Malafaya, B. M., Silva, A. G., & Reis, R. L. (2007). Natural-origin polymers as carriers
530
and scaffolds for biomolecules and cell delivery in tissue engineering applications.
531
Advanced Drug Delivery Reviews, 59, 207-233. 532
Mi, F. L., Sung, H. W., Shyu, S. S., Su, C. C., & Peng, C. K. (2003). Synthesis and
533
characterization of biodegradable TPP/genipin co-crosslinked chitosan gel beads.
534
Polymer, 44(21), 6521-6530. 535
Mohamadnia, Z., Zohuriaan-Mehr, M. J., Kabiri, K., Jamshidi, A., & Mobedi, H.
536
(2007). pH-Sensitive IPN Hydrogel Beads of Carrageenan-Alginate for Controlled Drug
537
Delivery. Journal of Bioactive and Compatible Polymers, 22, 342-356.
538
Mohanraj, V. J., & Chen, Y. (2006). Nanoparticles – A Review. Tropical Journal of
539
Pharmaceutical Research, 5, 561-573. 540
Nizri, G., Magdassi, S., Schmidt, J., Cohen, Y., & Talmon, Y. (2004). Microstructural
541
Characterization of Micro- and Nanoparticles Formed by Polymer−Surfactant
542
Interactions. Langmuir, 20(11), 4380-4385.
543
Nizri, G., Makarsky, A., Magdassi, S., & Talmon, Y. (2009). Nanostructures Formed by
544
Self-Assembly of Negatively Charged Polymer and Cationic Surfactants. Langmuir,
545
25(4), 1980-1985. 546
Rao, C. N. R., Rao, G. R., & Ppabhakaran, K. (1987). A combined XPS-UPS-EELS
547
study of nitrogen adsorbed on clean and barium-promoted iron surfaces: The nature of
548
the precursor to dissociation. Chemical Physics Letters, 134(1), 47-50.
Rawat, M., Singh, D., & Saraf, S. (2006). Nanocarriers: promising vehicle for bioactive
550
drugs. Biological & Pharmaceutical Bulletin, 29(9), 1790-1798.
551
Reis, C., & Ribeiro, A. (2006). Nanoencapsolation II. Biomedical applications and
552
current status of peptide and protein nanoparticulate delivery systems. Nanomedicine:
553
Nanotechnology, Biology and Medicine, 2, 53-65. 554
Saboktakin, M. R., Tabatabaie, R. M., Maharramov, A., & Ramazanov, M. A. (2010).
555
Synthesis and characterization of superparamagnetic chitosan–dextran sulphate
556
hydrogels as nano carriers for colon-specific drug delivery. Carbohydrate Polymers, 81,
557
372-376.
558
Silva, S. S., Luna, S. M., Gomes, M. E., Benesch, J., Pashkuleva, I., Mano, J. F., &
559
Reis, R. L. (2008). Plasma Surface Modification of Chitosan Membranes:
560
Characterization and Preliminary Cell Response Studies. Macromolecular Bioscience,
561
8(6), 568-576. 562
Sung, H. W., Huang, D. M., Chang, W. H., Huang, R. N., & Hsu, J. C. (1999).
563
Evaluation of gelatin hydrogel crosslinked with various crosslinking agents as
564
bioadhesives: In vitro study. Journal of Biomedical Materials Research, 46(4), 520-530.
565
Swift, P. (1982). Adventitious Carbon - the Panacea for Energy Referencing. Surface
566
and Interface Analysis, 4(2), 47-51. 567
van de Velde, F., Knutsen, S. H., Usov, A. I., Rollemay, H. S., & Cerezo, A. S. (2002).
568
1H and13C high resolution NMR spectroscopy of carrageenans:application, research
569
and industry. Trends in Food Science & Technology, 13, 73–92.
570
Wilson, R. H., Smith, A. C., Kacurakova, M., Saunders, P. K., Wellner, N., & Waldron,
571
K. W. (2000). The mechanical properties and molecular dynamics of plant cell wall
polysaccharides studied by Fourier-transform infrared spectroscopy. Plant Physiology,
573
124(1), 397-405. 574
Table 1 - Surface composition (atomic percentage) determined by XPS of CS, CRG, TPP
and CS/CRG/TPP nanoparticles of different ratios.
Element CS (%) CRG (%) TPP (%) 4/1/1 NP (%) 5/1/1 NP (%) C 64.1 57.4 16.0 57.5 57.9 O 29.6 38.2 63.6 35.2 35.1 N 6.3 1.1 0 4.0 4.0 P 0 0 20.4 2.0 1.7 S 0 3.3 0 1.3 1.3 Ratio O/N 4.69 35.7 0 8.75 8.73 Ratio C/N 10.2 53.6 0 14.3 14.4
CS: Chitosan, CRG: Carrageenan; NP: Nanoparticles; TPP: Tripolyphosphate
Figure captions 576
Fig. 1. Chemical structures of materials composing the matrix of nanoparticles: 577
chitosan, k-carrageenan and sodium tripolyphosphate.
578
Fig. 2. TEM microphotograph of representative CS/CRG/TPP (4/1/1) nanoparticles. 579
Fig. 3. Representative scheme of A) positive/negative charge ratio of each formulation 580
(white fill: formation of nanoparticles; dark grey: precipitation; light grey: inability to
581
form nanoparticles); B) the ability to form nanoparticles according to formulation
582
composition: precipitation (□); nanoparticles (●); solution (◊).
583
Fig. 4. Effect of CS/CRG mass ratio and TPP amount on A) nanoparticle size (round 584
marks) and zeta potential (triangular marks) and B) production yield of nanoparticle
585
(square marks). White: 0 TPP; grey: 0.5 TPP; black: 1 TPP (mean ± SD, n = 3).
586
Fig. 5. Evolution of CS/CRG (○) and CS/CRG/TPP (●) nanoparticle size as a function 587
of time, upon storage at 4 ºC (mean ± SD, n = 3).
588
Fig. 6. FTIR spectra of CS, CRG, TPP and CS/CRG/TPP (5/1/1) nanoparticles. 589
Fig. 7. Negative ion mass spectra obtained by TOF-SIMS analysis of (A) CS, (B) CRG, 590
(C) TPP, (D) CS/CRG/TPP = 4/1/1 nanoparticles and (E) CS/CRG/TPP = 5/1/1
591
nanoparticles.
Figure 1
Figure 2
Figure 3
Figure 4
Figure 5
Figure 6
Figure 7