ECOLOGICALLY RELEVANT CHARACTERISTICS OF
FLOW-REGIME OF RUFIJI BASIN IN TANZANIA
(AN ENSEMBLE OF ECOHYDROLOGICAL CLUES TO INFER ASSOCIATED RAMIFICATIONS ON STREAM AND ECOSYSTEM)
(under Erasmus Mundus Ecohydrology Program
Co
ECOLOGICALLY RELEVANT CHARACTERISTICS OF
REGIME OF RUFIJI BASIN IN TANZANIA
(AN ENSEMBLE OF ECOHYDROLOGICAL CLUES TO INFER ASSOCIATED RAMIFICATIONS ON STREAM AND ECOSYSTEM)
By
MD. ASHKAR BIN SAYEED
A dissertation
submitted in partial fulfillment of the requirements for the degree of
Master of Science in Ecohydrology
under Erasmus Mundus Ecohydrology Program)
University of Algarve
2014
Advisory Committee:
Supervisor: Professor Luis Chicharo (University of Algarve, Faro, Portugal) Co-supervisor: Professor Michael McClain
(UNESCO-IHE, Delft, Netherlands)
ECOLOGICALLY RELEVANT CHARACTERISTICS OF
REGIME OF RUFIJI BASIN IN TANZANIA
(AN ENSEMBLE OF ECOHYDROLOGICAL CLUES TO INFER ASSOCIATED RAMIFICATIONS ON STREAM AND ECOSYSTEM)
COPYRIGHT
A Universidade do Algarve tem o direito, perpétuo e sem limites geográficos, de arquivar e publicitar este trabalho através de exemplares impressos reproduzidos em papel ou de forma digital, ou por qualquer outro meio conhecido ou que venha a ser inventado, de o divulgar através de repositories científicos e de admitir a sua cópia e distribuição com objetivos educacionais ou de investigação, não comerciais, desde que seja dado crédito ao autor e editor.
Md. Ashkar Bin Sayeed
September 09, 2014
University of Algarve, Faro, Portugal
Email: [email protected]
DECLARAÇÃO DE AUTORIA DE TRABALHO
Declaro ser a autora deste trabalho, que é original e inédito. Autores e trabalhos consultados estão devidamente citados no texto e constam da listagem de refências incluida.
Md. Ashkar Bin Sayeed
September 09, 2014
University of Algarve, Faro, Portugal
DEDICATION
This dissertation is lovingly dedicated to my beloved parents, who had been long long miles away from me during the preparation of this write-up; still spread their wings of best wishes and encouragement in each step of the way.
iv ACKNOWLEDGEMENT
All thanks to Almighty Allah, the most Beneficent and Merciful, who gave me courage to complete this thesis. Here I feel outmost gratitude to mention the part of various personalities who have contributed to the completion of this work.
First of all I would like to express my sincere feelings and gratitude to my supervisor, Prof. Dr. Luís Manuel Zambujal Chícharo without whose arrangement and encouragement in doing this thesis I would have wandered aimlessly in an endless labyrinth.
I feel highly obliged to my co-supervisor Prof. Dr. Michael McClain, who provided me with the broad framework, general and spirited guidance within which I carried out my work and for the valuable help he has rendered to me. I would like to thank him for his great support in accommodating me in the research team he coordinates for getting constant opportunity of consultation.
I cannot forget the invaluable help which Dr. Raymond Venneker provided me during initial set up of my thesis idea.
I am thankful to UNESCO-IHE (Delft, Netherlands) for giving me the opportunity and logistic support to conduct this study and research.
I am also thankful to all the staff members related to EMMS in ECOHYD and particularly to International mobility office, UAlg.
I am as ever beholden to my family members and I wish to express my sincere thanks to my parents, who have always been a source of inspiration and encouragement. Their encouragement and good wishes have played a major role in the completion of this thesis. My sincere thanks go to the European Union for financing me to complete the prestigious Erasmus Mundus Master of Science in Ecohydrology.
Last but not the least, all my hard work, passion, the willingness and achievement are just only devoted to one person, my beloved mother.
RESUMO
Fenómeno ecohidrológico das necessidades de água para os ecossistemas aquáticos são hoje em dia uma preocupação de segurança ambiental que foi abordado através de diferentes formas de quantificação dos processos hidrológicos dinâmicos e ramificações associadas. Indicadores de fluxo de eco-relevantes disponíveis podem ser capazes de ditar o comportamento do fluxo necessário para serviços do ecossistema. Este estudo examinou como a variabilidade das características ecologicamente relevantes do fluxosignatário da bacia Rufiji na Tanzânia pode ser ligado de forma eficiente para traduzir as configurações de fluxo, e respostas do ecossistema. O fator-chave que está por trás a causar um tipo específico de impacto sobre ecossistema pode não ser sempre facilmente identificável; no entanto, saber o tipo ea extensão das ramificações, até mesmo devido ao desvio de comportamento do fluxo clássico de sua típica variabilidade e harmonia ou extensa variação nas métricas históricas de fluxo, são essenciais para a decisão de restauração e gestão de medidas e estratégias eficientes voltadas para a realização saudável de sistemas fluviais. Com este ponto de vista, este estudo teve como objetivo quantificar 47 características hidrológicas ecologicamente relevantes selecionados após a justificação de um conjunto de parâmetros disponíveis e explorar as probabilidades de ramificações dos ecossistemas associados. A quantificação do fluxo foi realizada com os dados de séries históricas de descarga por 18 estações de medição na bacia Rufiji na Tanzânia, que é um local de grande interesse devido a estar mais expostoa incertezas hidrológicas recorrentes, do que qualquer outra região do mundo. Um problema aqui, que foi a irregularidade de dados e não ter informações específicas sobre o ano de referência de regulação de fluxo para dividir o período de registros em unidades comparáveis, foi criteriosamente gerido por um desenvolvimento de um método simples de processos de filtragem e agrupamento para os fazer uteis para cálculos específicos. Os resultados foram comparados com base de conhecimento cientificamente válido das suscetibilidades fluxo de comunidades da bacia existente para inferir o estado ecológico no local de interesse e eco-ramificações baseadas no fluxo foram discutidas. Assim, as características ecohidrológicas do regime de fluxo foram concluídas como eficientes, supondo as eco-ramificações da relação fluxo-ecologia; proporcionando, assim, uma forma conveniente para retratar a situação ecológica orientada do comportamento do fluxo da bacia do Rufiji de uma forma de causa e efeito. Tais explorações, juntamente com o zoneamento com base nas ramificações de fluxo críticas, pode ser muito útil para os gestores de bacias hidrográficas para decidir medidas e estratégias do sistema de gestão futuras de Rufiji. Estes tipos de informações podem orientar recomendações de fluxo ambiental subsequentes para atingir ecossistemas fluviais saudáveis na bacia Rufiji. Estas estatísticas podem ser incorporadas no plano de recuperação de bacias para elaborar ponto de partida eficiente que pode ser uma referência para afinar os parâmetros de modelagem hidrológica relevantes previstos para esta bacia. Conhecimento do estado ecológico bruto em determinados pontos do rio e cursos inferidas, a partir destas estatísticas pode ajudar a definir a priorização das necessidades de investigação na bacia. Os resultados deste estudo podem servir como um modelo útil para as outras bacias hidrográficas da região. Para enfrentar os desafios futuros de gestão da água em uma região de maior interesse da segurança hídrica como no Leste Africano da Tanzânia, essa investigação prévia das condições da corrente e dos ecossistemas, o que pode parecer ser um grande desafio inicialmente, para uma grande bacia como Rufiji, pode convenientemente e eficientemente ser feito pelo advento de pistas ecohidrológicas de indicadores de fluxo de eco-relevantes. Daí, a inferência do estado ecológico das relações fluxo-ecologia no presente estudo parece ser um marco na Rufijieco-hidrologia bacia. Palavras-chave: Ecohidrologia; fluxo-métricas; segurança da água; influência dos ecossistemas;
ABSTRACT
Ecohydrological phenomenon of water requirements for aquatic ecosystems are now-a-days an essential environmental security concern which have been addressed through different ways of quantification of dynamic hydrological processes and associated ramifications (e.g. stress on biota, their removal or even extinction etc.). Readily available eco-relevant flow metrics can be able to dictate the flow behavior required for necessary ecosystem services. This study examined how variability in eco-relevant characteristics of signatory flow-regime of the Rufiji basin in Tanzania could efficiently be linked to translate stream configurations and ecosystem responses. The key driver acting behind the scene to cause a specific type of impact on ecosystem may not always be easily identifiable; nevertheless knowing the type and extent of the ramifications, even due to the deviation of classic flow behavior from its typical range of variability and harmony or extensive variation in historic flow metrics, are essential for deciding efficient restoration and management measures and strategies targeted to achieve healthy river systems. With this view point, this study was aimed to quantify 47 ecologically relevant hydrological characteristics selected after justification from a suit of available parameters and to explore the likelihoods of associated ecosystem ramifications. The quantification of flow-metrics was carried out with the historical time-series data of discharge for 18 gauging stations on Rufiji basin in Tanzania, which is a site of greater interest due to being more exposed to recurrent hydrological uncertainties than any other region of the world. The criticality here, which was regarding the data irregularity and about having no specific information on reference year of flow regulation to divide the period of records into comparable units, was judiciously managed by a simple methodological development of filtering and clustering processes to make those useful for targeted calculations. The results were compared with existing scientifically valid knowledge of the flow susceptibilities of basin communities to infer the ecological status in the site of interest and flow based eco-ramifications were discussed. Thus, the ecologically relevant
characteristics of flow regime were concluded as efficient ecohydrological contrivance to
surmise eco-ramifications from flow-ecology relationships; thus providing a convenient way to portray the flow behavior oriented ecological status of the Rufiji basin in a manner of cause and effect. Such explorations together with the zonation based on criticalness to flow oriented ramifications may be very useful to the river basin managers for deciding future management measures and strategies of the Rufiji system. These sorts of information may guide subsequent environmental flow recommendations for achieving healthy river ecosystems. These statistics may be incorporated in the basin restoration plan to devise efficient starting point rather than to play haphazardly which may be a reference for fine-tuning any relevant hydrological modelling parameters planned for this basin. Knowledge on gross ecological status at particular river points and courses inferred from these statistics may help to set spatial prioritization of research needs in the basin. The results of this study in total may serve as a useful model for the other river basins of the region. To face future water management challenges in a region of greater interest of water security like East African nation Tanzania, such a prior investigation of stream and ecosystem conditions, which may seem to be a big challenge initially for a large basin like Rufiji, can conveniently and efficiently be done by the advent of ecohydrological clues of eco-relevant flow metrics. Hence, the inference of ecological status from flow-ecology relationships in this current study appears to be a milestone in Rufiji basin ecohydrology.
Key words: Ecohydrology; flow-metrics; water security; ecosystem influence; Rufiji basin;
Tanzania; East Africa
vii TABLE OF CONTENTS
1. INTRODUCTION ... 1
1.1. Background ... 1
1.2. Motivation and significance ... 2
1.3. Research problem statement and justification ... 2
1.4. Purpose of the study ... 3
1.5. Research questions and hypothesis setting ... 3
1.6. Objectives of the study ... 4
2. LITERATURE REVIEW ... 6
3. STUDY AREA ... 11
4. METHODOLOGY ... 15
4.1. Data collection, tabulation and plotting hydrographs ... 15
4.2. Data filtering ... 16
4.3. Data completeness chart, clustering and plotting: ... 16
4.4. Flow statistics, data cleaning and completeness ... 18
4.5. Estimation and plotting of mean-monthly discharge and flow duration curve ... 19
4.6. Computation of ERCs of flow-regime... 19
4.6.1. Monthly water conditions ... 21
4.6.2. Annual water extremes ... 21
4.6.3. Monthly low flows ... 21
4.6.4. Extremely low flows ... 21
4.6.5. High flow pulses ... 22
4.6.6. Small floods ... 22
4.6.7. Large floods ... 22
4.6.8. Rate and frequency of water condition changes ... 22
4.7. Programming language / tool used ... 23
viii
5.1. Mean-monthly discharge ... 24
5.2. Flow-duration curve ... 26
5.3. Ecologically relevant characteristics of flow-regime ... 29
5.3.1. Monthly water conditions ... 29
5.3.2. Annual water extremes ... 30
5.3.3. Monthly low flows ... 42
5.3.4. Extreme low flows ... 43
5.3.5. High flow pulses ... 46
5.3.6. Small floods ... 48
5.3.7. Large floods ... 50
5.3.8. Rate and frequency of water condition changes ... 52
6. DISCUSSION ... 55
6.1. Monthly water conditions ... 56
6.2. Annual water extremes ... 57
6.3. Monthly low flows ... 60
6.4. Extreme low flows ... 61
6.5. High flow pulses ... 65
6.6. Small floods ... 68
6.7. Large floods ... 70
6.8. Water condition changes ... 71
6.9. Summarization of flow based eco-ramifications ... 74
7. CONCLUSIONS ... 76
8. REFERENCES ... 80
APPENDIX………..………Appendix [ Page | 01 ] to Appendix [ Page | 24 ]
ix LIST OF TABLES
Table 4.1.1. Basic information of the gauge stations of Rufiji Basin ... 15
Table 4.3.2. Clustering of discharge data ... 18
Table 4.6.1. Ecologically relevant characteristics of flow-regime ... 20
Table 5.2.1. Flow durations in Rufiji Basin ... 28
Table 5.3.1.1. Statistics of monthly water conditions of Rufiji basin ... 29
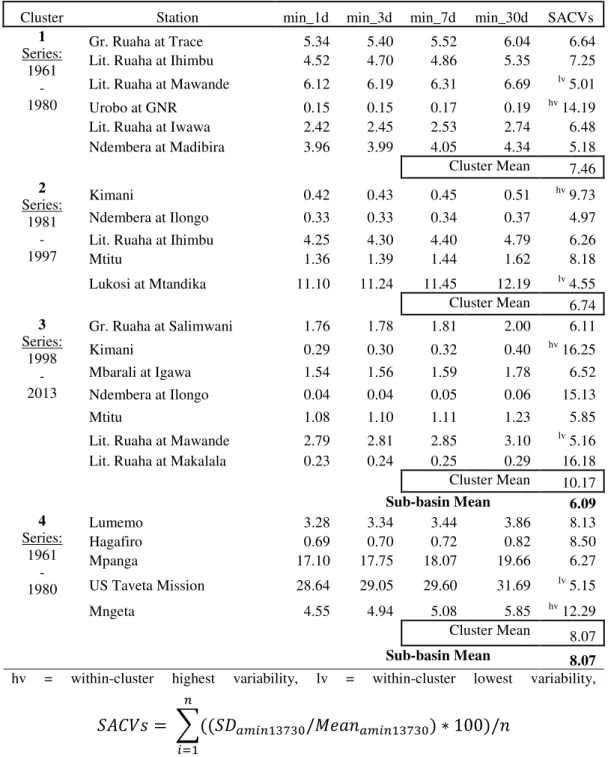
Table 5.3.2.1. Average annual minima of 1, 3, 7, and 30-day means ... 31
Table 5.3.2.2. Average annual maxima of 1, 3, 7, and 30-day means ... 32
Table 5.3.3.1. Statistics of monthly low flows of Rufiji basin ... 42
Table 5.3.4.1. Statistics of extreme low flows of Rufiji basin ... 45
Table 5.3.5.1. Statistics of high flow pulses of Rufiji basin ... 47
Table 5.3.6.1. Statistics of small floods of Rufiji basin ... 50
Table 5.3.7.1. Statistics of large floods of Rufiji basin ... 52
Table 5.3.8.1. Rate and frequency of water condition changes in Rufiji Basin ... 53
Table 6.9.1. Compilation of eco-ramifications in Rufiji basin across flow-metrics ... 75
(Restart page numbering for Appendix) Appendix [ Page | n ] Table 9.1. Column headings’ attributes of Table 9.2 ... 01
Table 9.2.1. Eco-relevant flow statistics of Gr. Ruaha (Trace) at ‘1961-1980’ ... 02
Table 9.2.2. Eco-relevant flow statistics of Lit. Ruaha (Ihimbu) at ‘1961-1980’ ... 03
Table 9.2.3. Eco-relevant flow statistics of Lit. Ruaha (Mawande) at ‘1961-1980’ ... 04
Table 9.2.4. Eco-relevant flow statistics of Urobo (GNR) at ‘1961-1980’ ... 05
Table 9.2.5. Eco-relevant flow statistics of Lit. Ruaha (Iwawa) at ‘1961-1980’ ... 06
Table 9.2.6. Eco-relevant flow statistics of Ndembera (Madibira) at ‘1961-1980’ ... 07
Table 9.2.7. Eco-relevant flow statistics of Kimani at ‘1981-1997’ ... 08
Table 9.2.8. Eco-relevant flow statistics of Ndembera (Ilongo) at ‘1981-1997’ ... 09
Table 9.2.9. Eco-relevant flow statistics of Lit. Ruaha (Ihimbu) at ‘1981-1997’ ... 10
Table 9.2.10. Eco-relevant flow statistics of Mtitu at ‘1981-1997’ ... 11
Table 9.2.11. Eco-relevant flow statistics of Lukosi (Mtandika) at ‘1981-1997’ ... 12
Table 9.2.12. Eco-relevant flow statistics of Gr. Ruaha (Salimwani) at ‘1998-2013’... 13
Table 9.2.13. Eco-relevant flow statistics of Kimani at ‘1998-2013’ ... 14
Table 9.2.14. Eco-relevant flow statistics of Mbarali (Igawa) at ‘1998-2013’ ... 15
x
Table 9.2.16. Eco-relevant flow statistics of Mtitu at ‘1998-2013’ ... 17
Table 9.2.17. Eco-relevant flow statistics of Lit. Ruaha (Mawande) at ‘1998-2013’ ... 18
Table 9.2.18. Eco-relevant flow statistics of Lit. Ruaha (Makalala) at ‘1998-2013’ ... 19
Table 9.2.19. Eco-relevant flow statistics of Lumemo at ‘1961-1980’ ... 20
Table 9.2.20. Eco-relevant flow statistics of Hagafiro at ‘1961-1980’ ... 21
Table 9.2.21. Eco-relevant flow statistics of Mpanga at ‘1961-1980’ ... 22
Table 9.2.22. Eco-relevant flow statistics of US Taveta Mission at ‘1961-1980’ ... 23
Table 9.2.23. Eco-relevant flow statistics of Mngeta at ‘1961-1980’... 24
(Restart page numbering for Annex) Annex [ Page | n ] Table Ann-III.1. Outliers with statistics (Ruaha at 1961-1980) ... 19
Table Ann-III.2. Outliers with statistics (Ruaha at 1981-1997) ... 25
Table Ann-III.3. Outliers with statistics (Ruaha at 1998-2013) ... 33
Table Ann-III.4. Outliers with statistics (Kilombero at 1961-1980) ... 39
xi
LIST OF FIGURES
Figure 1.1. Flowchart showing Thesis Concept ... 05 Figure 3.1. Showing Rufiji basin in the World Map ... 11 Figure 3.2. Showing Rufiji basin coordinates ... 11 Figure 3.3. Map showing boundary, sub-basins, gauging stations and rivers of Rufiji basin in Tanzania ... 14 Figure 5.1.1. Mean-monthly discharge ... 24 - 25 Figure 5.2.1. Flow-duration curves ... 26 - 27 Figure 5.3.2.1. Annual flow-minima of 1, 3, 7, and 30-day means ... 34 - 37 Figure 5.3.2.2. Annual flow-maxima of 1, 3, 7, and 30-day means ... 38 - 41
(Restart page numbering for Annex) Annex [ Page | n ]
Figure Annex I. Hydrographs with crude data... 02 - 06 Figure Annex II. Hydrographs with clustered data ... 08 - 11 Figure Annex III. Plots of flow statistics (min-max, range, range-mean ratio, and coefficient of variation) over the time-series ... 13 - 38
1 1. INTRODUCTION
1.1. Background
Water resources management has always been a prime attention globally. Thousands of discrete river systems and watercourses have been identified across the world with their hydrologic signatures. Water related disasters and water security issues in all over the world provide a broad context for studying hydrology of river basins where environmental and ecosystem concerns are addition to these. Watershed hydrology in particular has presented its nature with lots of unpredictability and influence on resource elements due to its range and large coverage. Ecohydrological phenomenon of water requirements for aquatic ecosystems introduced in such watershed hydrology are now-a-days an essential environmental security concern which have been addressed through different ways of quantification of dynamic hydrological processes and associated ramifications.
Geomorphic and climatic variations have been the architecture of the signatory flow-regimes of the individual rivers and streams attributed by the magnitude, frequency, seasonal timing or predictability, duration, and rate of change of hydrologic conditions. Flows being a master variable chiefly modulate how their regimes translate into stream configurations and ecosystem responses (Arthington, 2012). In course of the development of hydrological science, researchers have identified universal characteristics and parameters of these flows to efficiently link to their translation process and outcome. All of these statistics have been studied well for their ecosystem influences (reviewed by Richter et al., 1996); thus introduced as ecologically relevant hydrological indices.
Readily available eco-relevant flow metrics can be able to dictate the flow behavior required for necessary ecosystem services. Numerous scientific publications suggest that such methodologies have been implemented well on Australian and American river basin systems. While the African continent has been exposed more than any other region of the world to recurrent hydrological uncertainties (Rockstrom et al., 2014), addressing these issues there with applying such methodologies can best be illustrated through representative ecohydrological researches on African river basins.
2 1.2. Motivation and significance
The site of interest for the current study, the Rufiji basin, lies entirely within the African nation of Tanzania and is the largest catchment basin of the country. The basin-use pattern includes agriculture, fisheries, forestry, livestock, mining and wildlife, navigation, tourism and transport, and human and industrial settlements (RBWB, 2014) which are the universal drivers to produce particular influence on its hydrology and dependent ecosystems, so as for Rufiji too. These anthropogenic activities which are dependent on basin water use are accompanied with environmental degradation potential. The responses of such degradations are expressed in deviations of natural flow regimes of the river basin from its typical range of variability and harmony, and subsequent changes in ecosystem services and resilience. Although the first most wave of these types of responses are initiated soon after regulating river water to meet human needs which constitutes the larger share of the ramification, but this may not be immediately responsive to its fullest; it is supposed to have a cumulative impact over the time where climate change is an addition to this. The key driver acting behind the scene to cause such a specific type of impact may not always be easily identifiable; nevertheless knowing the type and extent of the ramifications, even due to the deviation of classic flow behavior or extensive variation in historic flow metrics, are essential for deciding efficient restoration and management measures and strategies targeted to achieve healthy river systems. Such information can be incorporated in basin management plans to help policy makers and managers for prescribing ecohydrological solutions.
1.3. Research problem statement and justification
There are lots of ways to determine the ramifications on stream and ecosystem associated with flow behavior where complex hydrological modelling tools are advent to these. However, the problem is that the evolution of simple methodologies for such types of determinations has always been a true demand in ecohydrological research, especially where the historic flow data were not preserved regularly. Another problem is the absence of a particular cut point in the considered period of interest which distinguishes altered flow from the natural one. These problems were well justified for the current study on Rufiji basin in Tanzania since the time-series data of discharge were irregular in both spatial and temporal scale, and there were not any distinguishing year of flow regulation to divide the period of records into comparable units. Still irregular time-series data of river discharge can be of
3
great use if linkage between flow behavior and ecology can be established and incorporated in judicious processing and presentation of flow metrics. And comparative variations in historic flow metrics and comparative deviations of harmonic flow behavior can be taken into consideration to infer the associated ramifications.
1.4. Purpose of the study
The main purpose of the current study is to identify the research problem for ecohydrological analyses of Rufiji basin in Tanzania in terms of available flow data type, to address those problems in terms of efficient clustering and comparative flow statistics, and to infer discharge related ramifications based on literature-oriented flow-ecology relationships.
1.5. Research questions and hypothesis setting
The research questions of the current study were phrased as follows:
i) Can the clustering methodology based on concentrated discharge data across the
considered period of interest provide an efficient platform for analyses and subsequent comparisons to determine or infer the flow behavior related ecological ramifications at Rufiji basin in Tanzania while there might not be regular series of discharge data available from hydro-meteorological stations?
ii) Can the comparative studies of the variability of ecologically relevant flow-metrics at
different hydro-meteorological stations or clustered stations or sub-basins of Rufiji basin in Tanzania provide signals of ecological ramifications while there is no distinguishing year of flow regulation to divide the period of records into comparable units?
On the basis of these research questions, it was hypothesized that the idea of clustering hydro-meteorological stations based on concentrated flow data across the time-series could provide an efficient platform for analyses and subsequent comparisons to determine or infer the flow behavior related ecological ramifications at Rufiji basin in Tanzania. It was also hypothesized that the comparative inter-annual variability in flow metrics of selected ecologically relevant hydrological parameters at different hydro-meteorological stations or
4
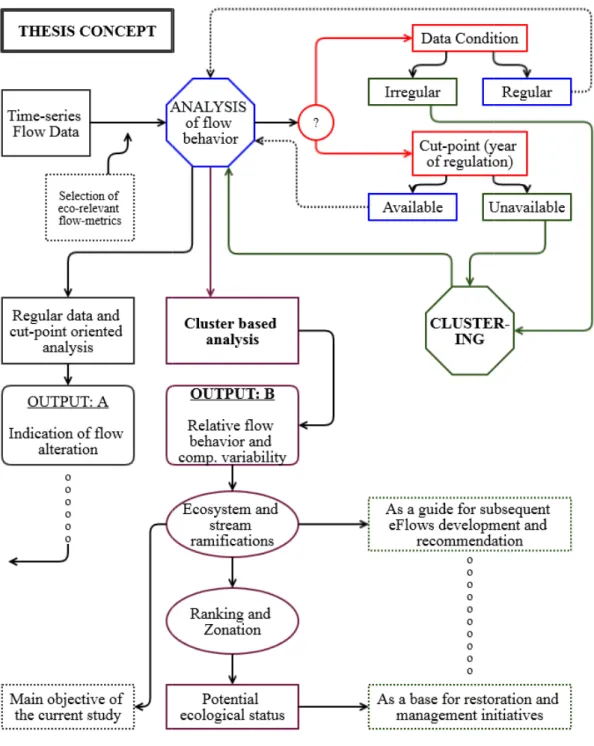
clustered stations or sub-basins of Rufiji basin in Tanzania could provide signals of ramifications on stream and ecosystem, as well as ranking of stations, clusters and sub-basins and their zonation based on comparative ecological status or pressure. The results of testing these hypotheses were considered to be falsifiable. Please follow Figure 1.1 for the illustration of this concept.
1.6. Objectives of the study
The objectives of the current study were as follows:
i) To deal with flow data for hydrological analyses while the data are irregular at both
spatial and temporal scale.
ii) To determine the ecologically relevant characteristics of flow-regime at Rufiji basin
in Tanzania.
iii) To infer ecological ramifications from the variability of the determined flow-metrics
while there is no cut point to define pre-development status and post-development alterations.
iv) To create a ranking-based zonation of the stations, clusters and sub-basins according
to their susceptibility to those inferred ramifications on stream and ecosystem and to ascertain their potential ecological status or pressure.
Figure 1.1. Flowchart showing Thesis Concept Figure 1.1. Flowchart showing Thesis Concept
6 2. LITERATURE REVIEW
The natural regime defines the hydrological variability pattern and reflects the interaction between the climatic regime (precipitation and temperature) and the basin characteristics that regulate runoff (geomorphology, geology and vegetation) (Oscar et al., 2010). The proper functioning of any healthy river system is strongly dependent on the natural flow variability to which the ecosystem components are adapted. Flow shapes physical habitat and biotic composition in rivers; life history strategies of aquatic species have evolved in response to natural flow variability (Bunn and Arthington, 2002). The components of natural flow regime which characterize its variability are defined as: magnitude, timing, frequency, duration, rate of change and predictability of flow events (Lytle & Poff, 2004). Any anthropogenic flow alteration caused from direct modification in the rivers or indirectly from land-use changes have significant impacts in nutrient and sediment dynamics and in the inter-connection between rivers and floodplains (Poff and Zimmerman, 2010). The general flow modification or alteration effect is the transformation of dynamic patterns into static, relatively stable patterns with reduced flows (Benejam et al., 2010). On a global scale, flow modifications or alterations present a serious and extensive threat to the integrity of aquatic ecosystems and the persistence of freshwater species (Anderson et al., 2011a). Over half of the world’s major river systems are presently affected by flow regulation (Nilsson et al. 2005), and climate change is predicted to further modify historical flow patterns in many rivers (Anderson et al., 2011a). Flow modifications or alterations imperil living aquatic inhabitants, more prominently migratory species (Bunn and Arthington, 2002), as well as spawning individuals and residents of local interest. It manifests its impact in the reduced ability of rivers to provide valued ecosystem services — sources of water and food, recreation, waste assimilation, flood control (Anderson et al., 2011b) —upon which humans depend (Millennium Ecosystem Assessment, 2005).
Numbers of scientific literatures suggest that the flow modification or alteration of any river or stream are accompanied with any kind of flow regulation like water abstraction for agriculture or drinking water supply, flood control etc. or any kind of river engineering works like river dredging for navigation, embankment for flood protection, bridge construction for communication, damming for hydroelectricity, barrage for water control, river training structures, aqueducts, irrigation channels, diversions etc. and management and maintenance of these in-channel structures. All of these flow regulations and river engineering works
7
which are targeted to human needs and benefits can cause changes of the performance of rivers and streams. These universal drivers of flow modifications or alterations and subsequent ecosystem degradations in many cases are not mutually exclusive. In those situations, the key cause to influence a specific consequence may not always be easily identifiable. The current site of interest, the Rufiji basin in Tanzania, being the largest catchment in the country had been offering fuel to various kinds of economic activities and the associated ramifications on stream and ecosystem were evident here as well (discretely reported by Kangalawe and Liwenga, 2005; Mombo et al., 2013; Mombo et al., 2014; United Republic of Tanzania, 2007) where different drivers were responsible for these consequences. In Tanzania, the river water dependent economic activities of the adjacent communities were found to effect degradation of basin resources and services; for example, in the Kilombero Valley, a Ramsar site and one of the sub-basins of Rufiji system (Kangalawe and Liwenga, 2005; Mombo et al., 2014). Among plenty of natural resources there, well managed basin wetlands provide higher earning potential to the low-input rain-fed agriculture of Tanzania (United Republic of Tanzania, 2007) since the cropping activities were often found to be carried out in those wetland areas for exploiting the flow-borne soil fertility and soil moisture (United Republic of Tanzania, 1997). Varying degrees, methods and extents of wetland utilization in Tanzanian basins substantially affected its state at a range from minimal to profound (Mombo et al., 2013). United Republic of Tanzania (2007) reported a conspicuous alteration of the ecosystem in parts of Rufiji basin, especially at the Panagani River of the Kilombero valley and the Usangu plains of the Upper Great Ruaha River, which were, according to Schuijt (2002), often associated with unsustainable use of the life support services and resources provided by those wetlands.
Impacts of flow modifications have recently been come up with a worldwide recognition of flow need of ecosystem which inspires to determine and maintain environmental flows (Naiman et al., 2002; Tharme, 2003; Poff et al., 2010). An environmental flow is a management concept that aims to establish the flow regime needed to sustain ecosystems and the amount of water available for off-channel human uses or storage in reservoirs at different times of the year (Anderson et al., 2011a). Initially the idea was being used chiefly for temperate rivers, or in tropical regions where water policies recognized the significance of specific flow regimes to sustain ecosystems (Tharme, 2003). Recent water laws and policies in some tropical countries (e.g., East Africa) explicitly refer to maintain flows for sustaining
8
ecosystems. Environmental flows with variability as similar as natural are of vital importance for healthy ecological status. Specifically it must include the time distribution of maximum and minimum flows, flood and drought flows and the rates of flow change. Water laws of many nations are demanding the assessment and incorporation of environmental flow regime for every water bodies of ecological worth exclusively to their basin management plans. Environmental flow regime is necessary for reinstating the conservation of biophysical states with long-term sustainable functioning of the ecosystem (Oscar et al., 2010). There is a clear distinction between the natural flow regime of a river that maintains ecosystem in a pristine state and an environmental flow that maintains a certain level of ecological integrity based on an appropriate management vision (Anderson et al., 2011a). Environmental flow standards can be restrictive management thresholds—designed to limit water withdrawals—or active management thresholds—designed to control flow releases at downstream (Poff et al., 2010).
Hydrological characterization constitutes the first step of a new holistic framework intended to develop environmental flow criteria, where the unaltered hydrology of rivers and streams constitutes the basis for assessing the extents and effects of flow alteration, and estimating environmental flows (Belmar et al., 2012). But the unaltered hydrology may not be always possible to differentiate or separate from the flow records of the period of interest, especially in cases where there is a cumulative impact of various drivers acting actively and concurrently on the basin hydrology to cause its flow modification and associated ecosystem ramifications. Most often assessment of environmental flow criteria (EFC) is based on statistical analysis of stream discharge data alone (Tharme, 2003). When environmental flow requirements are developed they are most often based on field data e.g. observed streamflow records (King et al., 2008). Acreman and Dunbar (2004) reviewed various methods developed as of then to define environmental flows and concluded a simple categorization of the methods into four types: look-up tables, desktop analysis, functional analysis and hydraulic habitat modelling. According to him, no method is necessarily better than another; each may be suitable for different applications. Whilst look-up methods are easy and cheap to apply, they can be expensive to develop, are less accurate and more suitable for scoping studies; in contrast, although hydraulic habitat modelling is more expensive to apply, it is suitable for impact assessment at specific sites. Each method would need to be used within a wider decision-support framework. These are generally either objective-based to define a target flow regime for a specific desired river status, or scenario-based to indicate the relative merits of various flow regime options for the river environment. The current study had been
9
focused to the later one where scenario-based evaluation of the basin stations based on relative merits of various ecologically relevant characteristics of flow-regime were planned for aiding subsequent environmental flow assessment process by the policy makers and basin managers.
There are a lot of statistical parameters of ecohydrological importance to estimate ecologically relevant characteristics of flow-regime of any river or stream. The Nature Conservancy (2009) documented a well suit of such parameters to determine hydrological alterations and environmental flow components which provide a basis for inferring ramifications on stream and ecosystem. Laize et al. (2010) supplemented to various factors reported by Moss (2010) and Norris and Thoms (1999) for determining the health of a river ecosystem, which were light, temperature, nutrient levels, water discharge, channel structure, physical barriers to connectivity, species interactions and the level of management, such as macrophyte cutting and dredging, fishing and stocking etc. There are significant correlations between or among particular factors of such kind. Laize et al. (2010) gave an example of such inter-dependence of river health determining factors where they mentioned about an interaction among discharge, channel structure and macrophyte growth to determine water depth and velocity, which in turn influence food delivery, light penetration and oxygen levels. To say specifically about the discharge which is a dynamic key variable of any river system, scholars suggested that all the ecologically relevant components of flow-regime have particular influence on freshwater ecosystems (Junk et al., 1989; Richter et al., 1996; Poff et
al., 1997; Biggs et al., 2005; Arthington et al., 2006; Kennen et al., 2007; Laize et al., 2010).
Relative merits of eco-relevant flow metrics expressed in ecosystem ramifications can guide an efficient environmental flow assessment of any river basin under pressure of flow regulations, like the Rufiji basin in Tanzania. These types of discharge oriented ecosystem ramifications can also be sourced from deviation of typical harmonic flow behavior illustrated over a water year, thus causing a relatively higher or lower inter-annual variations of such kind. Year-to-year flow variability was predicted to have adverse effects on the biodiversity and ecological function of rivers and floodplain habitats and to be threatening to the ecological integrity of rivers, which in turn serve as a caution for careful consideration of water resource management options for rivers (Leigh and Sheldon, 2008). According to The Millennium Ecosystem Assessment (2005) and Nilsson et al., (2005), many aquatic ecosystems all over the world were being degraded or lost or at least suffered from functional
10
unhealthiness particularly due to flow modifications. Thus, there is a pressing need to assess the degree of such modifications of discharge and associated ramifications on stream and ecosystem by the advent of ecologically significant hydrological statistics for guiding efficient management decisions and strategies (Leigh and Sheldon, 2008). A noticeable departure or deviation or lack of harmonization in these statistical measurements from their reference range of variability is the key element for the ramifications in associated ecosystem functionality and health. Environmental flows can doctor these situations due to which establishment of this prescription and its efficient execution is receiving increasing attention in ecohydrological science (Dyson et al., 2003, Poff et al., 2010). The current study was thus attempted, as a guide to develop such prescriptions, the exploration of the flow-behavior associated ramifications on stream and ecosystem of Rufiji basin in Tanzania.
11 3. STUDY AREA
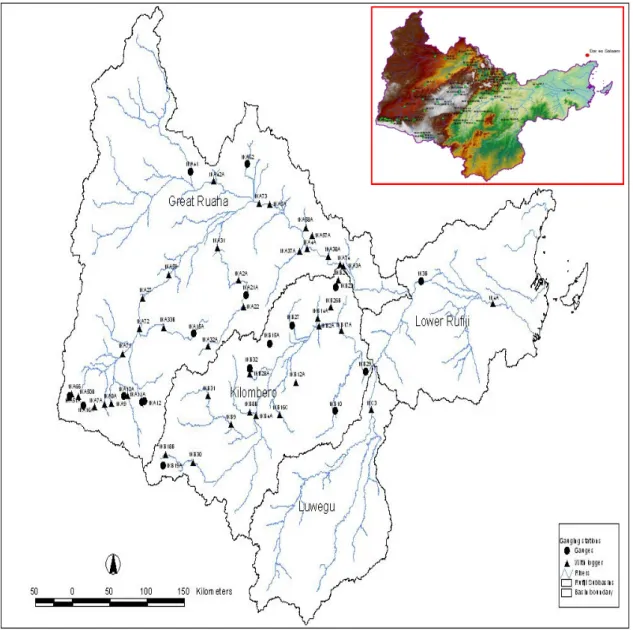
The Rufiji Basin covers an area of 183,791 square kilometres (about 20% of Tanzania) which
drains into the Indian Ocean. The basin is situated between Longitudes 33o55’E and 39o25’E
and between Latitudes 5o35’S and 10o45’S. The altitude of the basin rises from 0 meter
(above mean sea level) at the Indian Ocean to 2,960 meters (above mean sea level) in the highlands (Kipengere ranges and Poroto Mountains) Iringa and Mbeya Regions. The Basin is divided into four sub basins which are Great Ruaha (46.5%), Kilombero (21.9%), Luwegu
(13.8%) and Lower Rufiji
(17.7%) (RBWB, 2013). Figure 3.1. Showing Rufiji basin in the World Map(RBWB, 2013)
12
The Rufiji basin is managed under the Rufiji Basin Water Board of the Water Councils unit of the Ministry of Water in Tanzania. Again The Rufiji Basin Development Authority (RUBADA) was established as a philanthropic Government organization of Tanzania to pursue multi-sectoral responsibilities for promoting, regulating, coordinating and facilitating sustainable and balanced development of ecological and socio-economics in the sector of energy, agriculture, fisheries, forestry, tourism, mining, industry, transport and environment in the basin (RUBADA, 2014). The basin was maintained by a network of 57 hydrometric stations among which 52 stations were fully operational, 2 were partially operated and 3 were non operational. From these we collect information on water level. 52 stations are fully operational, 2 are partially operated and 3 are non operational. Historical discharge (Q in
m3/s) data were collected for the current study from these stations on a selective basis.
The drainage patterns of the Rufiji basin were reported to be highly dependent on its geomorphology which was formed from a former erosion cycle due to earth's epeirogenic movements (RBWB, 2013). The basin is characterised by many wetlands both in the highlands and the lowlands, and the mangrove at the Rufiji river delta. Economic activities there in the Rufiji Basin are mainly agriculture, tourism, wildlife conservation, fisheries and mining. According to RBWB (2013), agriculture is the mostly practiced activity in the Usangu plain and Kilombero basin, tourism and wildlife conservation are practiced in the National Parks (Udzungwa, Mikumi, Kitulo and Ruaha) and the Game reserves (Selous, Mpanga/Kipengele and Rungwa), fisheries are practiced in the Kilombero, Great Ruaha and Rufiji rivers, and mining projects are developed in the Selous basin at Namtumbo district and in the Iringa district at Nyang’oro hills.
Weathering of the parent rocks in the area characterized the soil types of the basin which are mostly dominated by coarse to medium grained sand, reddish-brown fine slits and clay volcanic types. The flood plains in Lower Rufiji, Great Ruaha and Kilombero Catchments are dominated with the black clay soil and scarcely distributed sand and silt soils. According to RBWB (2013), the Rufiji River Basin varies greatly in climatic and hydrological conditions. The basin has a tropical dry, humid and hot climate which differs from the coast to the highlands or mountainous regions in the upper parts of the catchments. The lower parts of the basin experience two rainy seasons while the most part is characterized by unimodal rainfall. The annual rainfall ranges from 400 mm to 1800 mm with a high along the
mountain chain and uneven falling across the year.The four principal sub-basins of the Rufiji
13
variations (on an average, 50 to 14,000 m3/sec). The largest part of the basin experiences
longer dry seasons and shorter wet seasons. Economic activities have increased in the basin areas hence decreases the flows in most of the rivers which consequently lead to insufficient flow to downstream users.
The Rufiji basin drains through a number of tributaries including Great Ruaha, Mlombiji, kimani, Mbarali, Chimala, Kioga, Halali, Ndembera, Little Ruaha, Mswiswi, Kisigo, Bubu, Fufu, Lunwa, Mwega, Lukosi, Yovi, Umrobo, Ipatagwa, Mlowo, Ruhiji, Kigogo, Lidete, Mnyera, Mpanga, Furua, Sofi, Mchilipa, Luri, Kihansi, Mgeta, Ruipa, Lumemo, Msolwa, Luhombero, Hagafiro, Mbarangandu, Luwegu etc. There are three major reservoirs in the basin which are Mtera and Kidatu in the Great Ruaha and Lower Kihansi in the Kilombero. The basin is running important water resources management interventions including Studies for Construction of Ndembera dam and Preparation of the Integrated Water Resources Management Plan which are expected to be the solution of many water related challenges within the basin (RBWB, 2013).
According to 12 years old national census results, about 1,400,000 people were living in the Rufiji basin. The greater significance of this basin lies under four National Parks ( Kitulo, Ruaha, Mikumi and Udzungwa), big game reserves (Selous, Rungwa, Usangu,
Mpanga/Kipengere, Lunda etc), forest reserves (23,200 km2), mining of Uranium and Copper
(Mbeya, Iringa and Morogoro regions), livestock keeping, eco-tourism attractions, the Rufiji Delta, the coast lines and the Mafia Island (RBWB, 2014).
14 Figure 3.3. Map showing boundary, sub-basins, gauging stations and rivers of Rufiji basin
15 4. METHODOLOGY
4.1. Data collection, tabulation and plotting hydrographs
Historical discharge (Q in m3/s) data of 29 stations under 3 sub-basins of Rufiji River Basin
System were collected from Rufiji Basin Water Board (RBWB), Tanzania and tabulated according to time-series format (Year: 1957-2014) where a double column database having date and Q fields for each station was prepared. Hydrographs based on these datasets were plotted for each station (Annex I) to visually determine the data quality.
Table 4.1.1 reveals the basic information of the stations of the Rufiji River Basin System under rivers, locations and positions headings. Shaded numbers of stations were selected for final analyses which were chosen by data filtering and data clustering method (section 4.2 and 4.3) and therefore, the complete information in Table 4.4.1 were provided only for these selected stations.
Table 4.1.1. Basic information of the gauge stations of Rufiji Basin (based on RBWB, 2013)
Sub-basin Serial No.
Station
Code River Location Latitude Longitude
Ruaha
1 - Little
Ruaha Iringa Nduka - -
2 1KA5A Great
Ruaha Trace 7.12722 36.08333
3 - Chimala Chitekelo - -
4 1KA8A Gre Ruaha Salimwani 8.9 37.11666 5 1KA9 Kimani Great North Road 9.85 34.18333 6 1KA11A Mbarali Igawa 8.78333 34.36666 7 1KA15A Ndembera Ilongo 8.28333 35.21111 8 1KA21A Little
Ruaha Ihimbu 7.88333 35.8
9 1KA22 Mtitu Mtitu 8.01666 35.78333
10 - Ruaha Malangali - -
11 1KA31 Little
Ruaha Mawande 7.5 35.5
12 1KA32A Little
Ruaha Makalala 8.33333 35.33333 13 1KA37A Lukosi Mtandika 7.56666 36.43333
14 - Kizigo Ilangali - -
15 - Kizigo Chinugulu - -
16 - Mswiswi Wilima - -
16 Sub-basin Serial
No.
Station
Code River Location Latitude Longitude 18 1KA52A Little
Ruaha Iwawa 8.93333 34.00111
19 - Gre Ruaha Gorge - -
20 1KA33B Ndembera Madibira 8.23333 34.8
Kilombero
21 1KB14A Lumemo Kiburubutu 8.01222 36.65722
22 - Ruhudji Kifunga's Falls - -
23 1KB19A Hagafiro Hagafiro 9.39583 34.81666 24 1KB8B Mpanga Mpanga Mission 8.93777 35.81277 25 1KB9
Mnyera
U/S Taveta
Mission 9.01666 35.51666 26 1KB15A Mngeta U/S Bridge 8.33611 36.08611
27 - Kilombero Swero - - Lower Rufiji 28 - Pangani - - - 29 - Utete - - - Note.
Data for total 29 no. of stations were collected primarily; subsequently filtered and clustered at 18
4.2. Data filtering
For each station, discharge (Q in m3/s) data were filtered according to dual conditions where
there were at least 26 daily values in a month and afterwards, 08 monthly values in a year. Missing value statistics were calculated and based on that, the thresholds for this filtering were decided along with keeping consideration of a balance so that a large portion of data points might not be excluded by this filtering process. Thus the thresholds for this filtering were arbitrarily chosen with flexibility of that limit. This gave an estimation that a month was considered to be representative for subsequent analyses if it consisted no more than 10%, 12%, 15%, and 18% daily missing values for 28, 29, 30, and 31-day months respectively, and a year was considered to be representative for subsequent analyses if it consisted no more than 40% monthly missing values in the time-series.
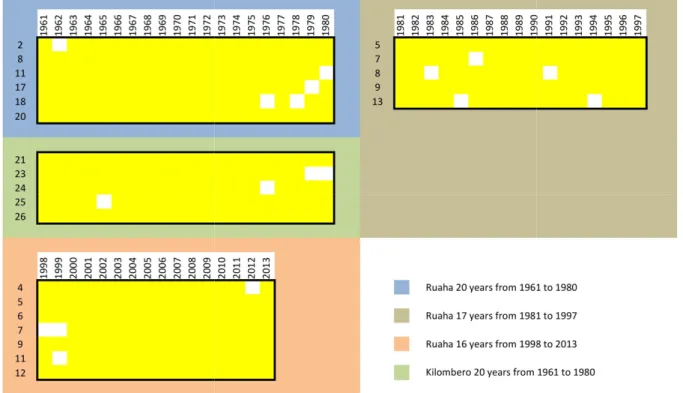
4.3. Data completeness chart, clustering and plotting:
Based on the dual conditions set at data filtering stage a completeness chart was prepared which showed both the complete data years and missing data years across each station of the Rufiji Basin (Table 4.3.1). A bird's eye view on the chart gave a visual signal of the concerted data which provided a clustering idea over the basin database. A total of four bases were set
for this clustering process: i) length of of stations per cluster must not go below 5
and iv) missingness must not cross a maximum limit of 1 trial-and-error process. After several work outs
clusters were developed which met all the four conditions set
based on these filtered and clustered discharge data were plotted for each station (Annex to visually determine the quality of the processed data.
Table 4.3.2. Clustering of discharge da basin which were taken from Table
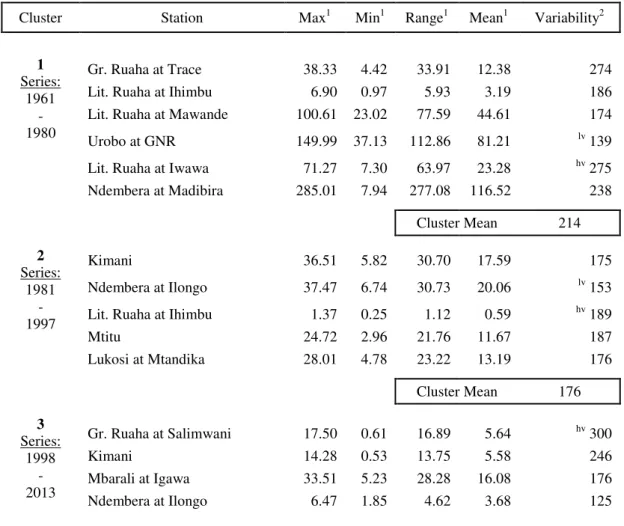
4.4. Flow statistics, data cleaning and completeness
Filtered and clustered flow data were arranged for a couple of significant statistical measurements. Minimum, maximum, range, mean, range
(SD), and coefficient of variation (CV) were computed and plotted to visualize the f variability. Subsequently, extremely variable data points (above 0.98 percentile)
determined suspicious data points
(Annex III). Finally, completeness of each station in terms of having suspicious and outlier free discharge data (termed as '
(Table Ann-III.5 in Annex III)
i) length of time-series must not be less than 15 years
per cluster must not go below 5, iii) sub-basins must not overlap with one another must not cross a maximum limit of 14.5%. These thresholds were set by
fter several work outs of placing those boundaries which met all the four conditions set (Table 4.3.2
based on these filtered and clustered discharge data were plotted for each station (Annex to visually determine the quality of the processed data.
Table 4.3.2. Clustering of discharge data (numbers at left side indicates station from Table 4.1.1 and Table 4.3.1)
. Flow statistics, data cleaning and completeness
Filtered and clustered flow data were arranged for a couple of significant statistical measurements. Minimum, maximum, range, mean, range-by-mean (R/M), standard deviation (SD), and coefficient of variation (CV) were computed and plotted to visualize the f
ubsequently, extremely variable data points (above 0.98 percentile)
suspicious data points were identified and removed from the series as outliers Finally, completeness of each station in terms of having suspicious and outlier
termed as 'cleaned data') was determined for each series and cluster ).
18
must not be less than 15 years, ii) number s must not overlap with one another, These thresholds were set by boundaries, four final 4.3.2). Hydrographs based on these filtered and clustered discharge data were plotted for each station (Annex II)
(numbers at left side indicates stations of Rufiji
Filtered and clustered flow data were arranged for a couple of significant statistical mean (R/M), standard deviation (SD), and coefficient of variation (CV) were computed and plotted to visualize the flow ubsequently, extremely variable data points (above 0.98 percentile) and visually were identified and removed from the series as outliers Finally, completeness of each station in terms of having suspicious and outlier was determined for each series and cluster
19 4.5. Estimation and plotting of mean-monthly discharge and flow duration curve
Cleaned discharge data were arranged month-wise for all the years in each cluster for each station and year-wise means were calculated from all the series. Subsequently month-wise means and their percentages to mean-annual discharge were computed for each period of record to normalize the data. Finally, mean-monthly (%) graphs were plotted to observe the long-term flow behavior and the annual cycle across months and stations within each cluster. Flow-duration curves from clean data were plotted for each station to visualize percent time flow exceeded during the considered period of record.
4.6. Computation of ERCs of flow-regime
A total of 47 ecologically relevant characteristics (ERCs) of flow-regime to be computed were selected (Table 4.6.1) from a list of 67 statistical hydrological parameters introduced and documented by The Nature Conservancy (2009). This selection was based on judgmental decision. Timing of annual extreme water conditions (6 parameters: Julian date of 1-day maximum, 1-day minimum, peak extreme low flow, peak high flow pulse, peak small flood, and peak large flood) were delisted since a similar type of information could be possible to extract from an earlier measurement viz., mean-monthly plots. Frequency and duration of annual water extremes (4 parameters: number and duration of low and high flows) were delisted since similar statistical measurement were carried out more extendedly under extremely low flows, high flow pulses, small floods, and large floods categories. Rise and fall rates from high flow pulses, small floods, and large floods groups (6 parameters) were delisted since similar type of information could be possible to extract in simpler format from measurements of rate and frequency of water condition changes. Annual extremes of 90-day means (2 parameters) were delisted since these seemed to be redundant with annual extremes of 1, 3, 7, 30-day means. Number of zero-flow days and base flow index (2 parameters) were delisted since these might be less meaningful according to objectives of this study. Thus, the number of ecologically relevant characteristics were thinned down from 67 to 47 and selected for analyses of the current study which are mentioned in the following sub-sections.
20
Table 4.6.1. Ecologically relevant characteristics of flow-regime (based on The Nature Conservancy, 2009)
ERCs Hydrologic parameters Ecosystem influences on/in Monthly water
conditions
Mean value of each calendar month Availability of habitat, soil moisture, food, water etc. and dynamics of physico-chemical parameters in water Subtotal 12 parameters
Annual water extremes
Annual minima and maxima of 1-, 3-, 7-, and 30-day means
Stress balance, sites for colonization, ecosystem structure, channel morphology, habitat condition, nutrient dynamics, community distribution, waste disposal, sediment dynamics, spawning facilities etc. Subtotal 08 parameters Monthly low flows
Mean values of low flows during each calendar month
Habitat, water temperature, DO, water table levels, soil moisture, drinking water supply to dependent terrestrial animals, egg suspension, mobility, hyporheic organisms etc.
Subtotal 12 parameters
Extremely low flows
Frequency, mean peak flow (minimum flow during the event), and mean duration of extremely low flow events during each water year
Prey concentration, certain recruitments, removal of invasives, riparian structure along depth etc.
Subtotal 03 parameters High flow
pulses
Frequency, mean peak flow (maximum flow during the event), and mean duration of high flow events during each water year
Shaping channel pools, riffles and bed substrates (sand, gravel, cobble), limiting riparian structure, water quality, flushing wastes and pollutants, oxygenation, preventing siltation, mixing and transporting nutrients etc.
Subtotal 03 parameters
Small floods Frequency, mean peak flow (maximum flow during the event), and mean duration of small flood events during each water year
Migration, spawning and nursing, floodplain connection and recharge, distribution and abundance of biodiversity, nutrient exchange, introducing waterbirds and their habitats etc.
Subtotal 03 parameters
Large floods Frequency, mean peak flow (maximum flow during the event), and mean duration of large flood events during each water year
Shaping floodplain habitats, disburse riparian seeds and fruits, flushing foods and debris, creation of new habitats as secondary channels, prolonging soil moisture, helping colonization, balancing species of aquatic and riparian communities etc.
21
Table 4.6.1. Ecologically relevant characteristics of flow-regime (based on The Nature Conservancy, 2009)
ERCs Hydrologic parameters Ecosystem influences on/in Reversals of
water conditions
Rise and fall rates, and number of reversals
Wet-dry dynamics and related stress on biota, entrapment due to floodplain disconnection, mobility and coverage of aquatic organisms etc.
Subtotal 03 parameters
Total 47 parameters
4.6.1. Monthly water conditions
Inter-month variations of a given period of record in mean-monthly discharge were determined for all the stations and presented for within-cluster and among-clusters comparison to reveal monthly water conditions.
4.6.2. Annual water extremes
The 1-, 3-, 7-, and 30-day minima and maxima were computed from moving averages of the appropriate length calculated for every period for all the stations under investigation.
4.6.3. Monthly low flows
Mean values of low flows for each calendar month were determined for all the years in a given period of record for each station and presented cluster-wise for comparison. Low-flow threshold was set at 50th percentile of daily flows (according to The Nature Conservancy, 2009). All flows less than or equal to this threshold were classified as low flow events.
4.6.4. Extremely low flows
Frequency, mean peak flow (minimum flow during the event), and mean duration of extremely low flow events for each water year in a given period of record were determined for each station and presented cluster-wise for comparison. Extremely low-flow threshold was set at 10th percentile of daily low flows (according to The Nature Conservancy, 2009). All flows less than or equal to this threshold were classified as extremely low flow events.
22
4.6.5. High flow pulses
Frequency, mean peak flow (maximum flow during the event), and mean duration of high flow events for each water year in a given period of record were determined for each station and presented cluster-wise for comparison. High-flow threshold was set at 75th percentile of daily flows before small flood (according to The Nature Conservancy, 2009). All flows greater than this threshold and less than small-flood threshold were classified as high flow pulses.
4.6.6. Small floods
Frequency, mean peak flow (maximum flow during the event), and mean duration of small flood events for each water year in a given period of record were determined for each station and presented cluster-wise for comparison. Small-flood threshold was set at 50th percentile of the peaks of high flow events before large flood (according to The Nature Conservancy, 2009). All high flows greater than or equal to this threshold and less than large flood threshold were classified as small floods.
4.6.7. Large floods
Frequency, mean peak flow (maximum flow during the event), and mean duration of large flood events for each water year in a given period of record were determined for each station and presented cluster-wise for comparison. Large-flood threshold was set at 90th percentile of the peaks of high flow events (according to The Nature Conservancy, 2009). All high flows greater than or equal to this threshold were classified as large floods.
4.6.8. Rate and frequency of water condition changes
Rate and frequency of water condition changes were calculated by dividing the hydrologic record into "rising" and "falling" periods, which correspond to periods in which daily changes in flows were either positive or negative, respectively. The number of hydrologic reversals was determined as the number of times that flow switches from rising to falling or vice-versa. Reversals were analyzed on a water year by water year basis, so the first change in flow of the water year could not be counted as a reversal, since no rising or falling trend existed before then.
23 4.7. Programming language / tool used
All the computations of the aforementioned ecologically relevant hydrological statistics were carried out using R programming language. Direct use of the 'Indicators of Hydrologic Alteration' (IHA) software of The Nature Conservancy for such computations was not possible because of irregular data type and not having any pre-post alteration cut point in the current study. Manual estimation by R programming language coding, although took huge computing works and hours, did not impact the result quality of the measurements, rather paved the way to deal with such type of data series for ecohydrological analyses similar to IHA.
24 5. RESULTS
The ecologically relevant characteristics of flow-regime were calculated for Rufiji basin in Tanzania. The list of these hydrological parameters was chosen from The Nature Conservancy (2009) and selections from that list for the analysis for this study were made with proper justifications and ecosystem influences. All the results from those analyses are presented here.
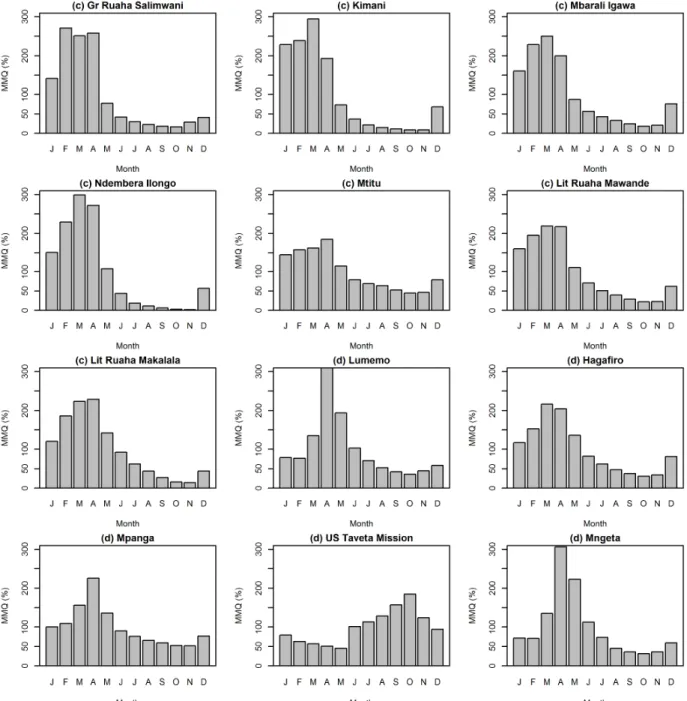
5.1. Mean-monthly discharge
Mean-monthly discharge at Figure 5.1.1 shows the long-term flow behavior and the annual cycle of discharge within each cluster.
Fig 5.1.1. Mean-monthly discharge (a = Ruaha sub-basin in 1961-1980, b = Ruaha sub-basin in 1981-1997)
25
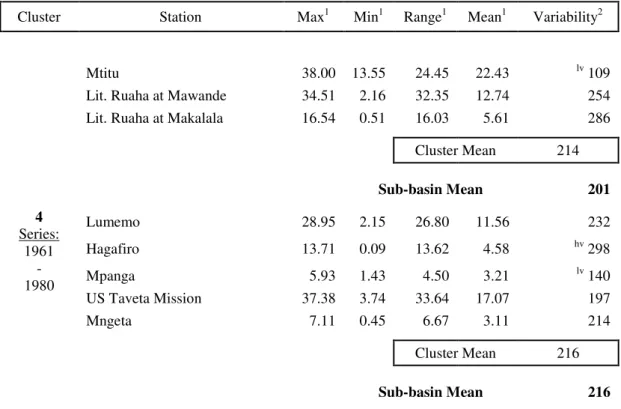
The patterns are clearly visible and there were peaks around the month of Mar-Apr and drops around Oct-Nov at annual cycles for almost all stations of the Rufiji basin in Tanzania. The exception of this pattern was noticed for the station at US Taveta Mission at Kilombero sub-basin where the average peak shifted to Oct and the drop to May. The magnitude of the peaks and drops at the stations were varied in extent where two exceptional variations were noticed in the time series '1961-1980' at Ruaha sub-basin and even the flows at these stations were lower than the stations of Kilombero sub-basin in the same time series. Flows at Great Ruaha (Trace) were found to be much higher and the flows at Urobo (Great North Road - GNR) were found to be much lower comparative to other station of the Ruaha sub-basin in the same
26
time series '1961-1980'. General observations showed that the flows at the stations of Ruaha sub-basin were higher in the time series '1998-2013' than '1981-1997' and '1961-1980'.
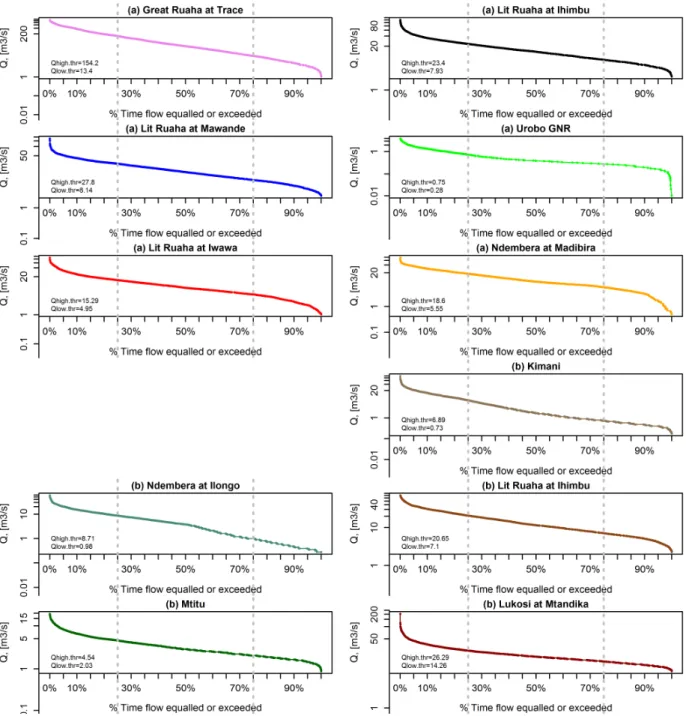
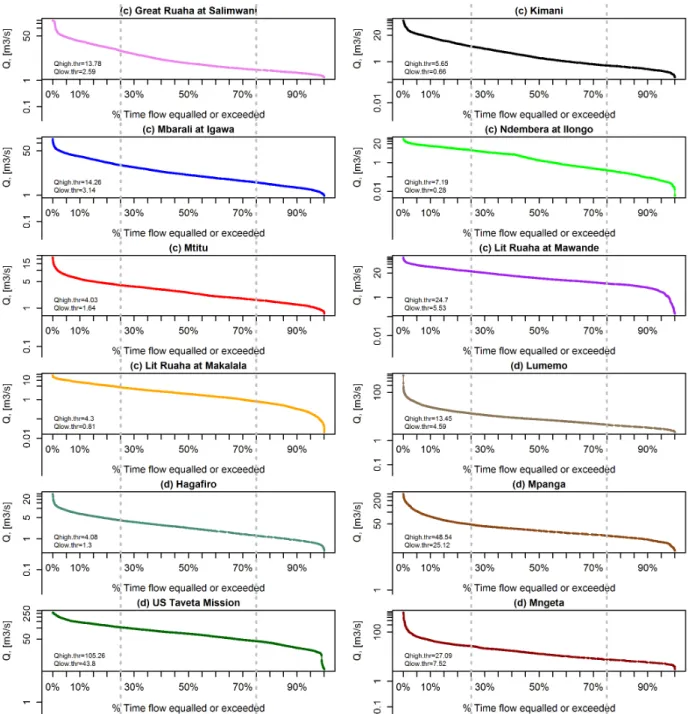
5.2. Flow-duration curve
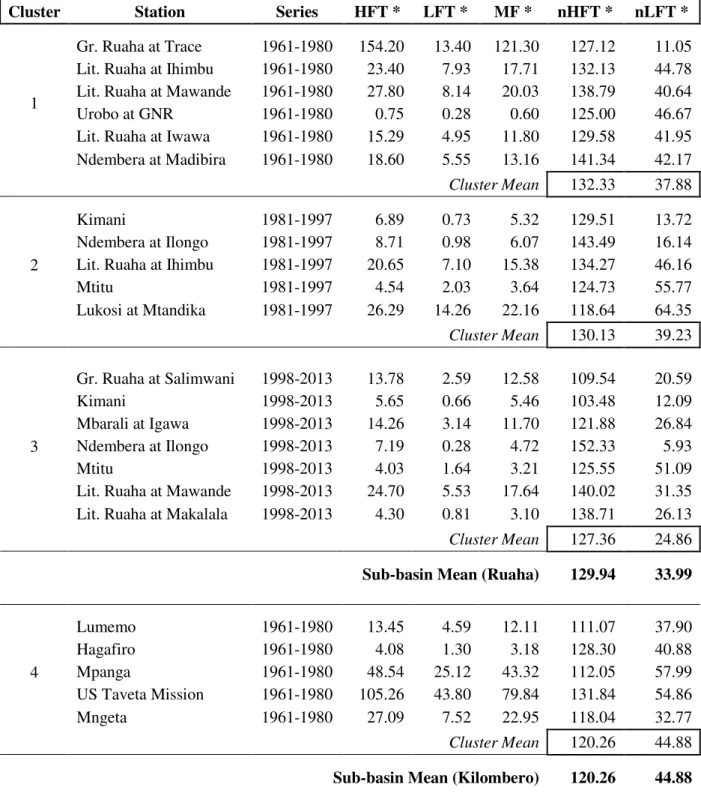
Flow-duration curves at Figure 5.2.1 visualize the percent time flow equaled or exceeded during the considered period of record. High and low flow thresholds from Figure 5.2.1 were compiled in Table 5.2.1 and the values were normalized for comparison. It was possible to follow the ranking of inter-station moistness and dryness within each cluster as well as each sub-basin.
27
Flows at high flow threshold or 25% flows equalled or exceeded 18.60 m3/s, 8.71 m3/s, 7.19
m3/s, and 105.26 m3/s at Ndembera (Madibira), Ndembera (Ilongo), again Ndembera
(Ilongo), and Mnyera (US Taveta Mission) stations within Ruaha '1961-1980', Ruaha '1981-1997', Ruaha '1998-2013', and Kilombero '1961-1980' clusters respectively which were the highest variations of flows to the respective means within respective clusters (according to the normalized values of high flow threshold). On the contrary, flows at low flow threshold
or 75% flows equalled or exceeded 0.28 m3/s, 14.26 m3/s, 1.64 m3/s, and 25.12 m3/s at Urobo
(GNR), Lukosi (Mtandika), Mtitu, and Mpanga stations within Ruaha '1961-1980', Ruaha '1981-1997', Ruaha '1998-2013', and Kilombero '1961-1980' clusters respectively which were
28
the highest variations of flows to the respective means within respective clusters (according to the normalized values of low flow threshold). Cluster mean reveals that, among all the four clusters, Ruaha '1961-1980' and Kilombero '1961-1980' had the highest variations to the means at high and low flow thresholds respectively. Between sub-basins, on an average, Ruaha showed higher variations at high flow threshold and Kilombero showed higher variations at low flow threshold.
Table 5.2.1. Flow durations in Rufiji Basin
Cluster Station Series HFT * LFT * MF * nHFT * nLFT *
1
Gr. Ruaha at Trace 1961-1980 154.20 13.40 121.30 127.12 11.05 Lit. Ruaha at Ihimbu 1961-1980 23.40 7.93 17.71 132.13 44.78 Lit. Ruaha at Mawande 1961-1980 27.80 8.14 20.03 138.79 40.64 Urobo at GNR 1961-1980 0.75 0.28 0.60 125.00 46.67 Lit. Ruaha at Iwawa 1961-1980 15.29 4.95 11.80 129.58 41.95 Ndembera at Madibira 1961-1980 18.60 5.55 13.16 141.34 42.17
Cluster Mean 132.33 37.88
2
Kimani 1981-1997 6.89 0.73 5.32 129.51 13.72 Ndembera at Ilongo 1981-1997 8.71 0.98 6.07 143.49 16.14 Lit. Ruaha at Ihimbu 1981-1997 20.65 7.10 15.38 134.27 46.16
Mtitu 1981-1997 4.54 2.03 3.64 124.73 55.77 Lukosi at Mtandika 1981-1997 26.29 14.26 22.16 118.64 64.35 Cluster Mean 130.13 39.23 3 Gr. Ruaha at Salimwani 1998-2013 13.78 2.59 12.58 109.54 20.59 Kimani 1998-2013 5.65 0.66 5.46 103.48 12.09 Mbarali at Igawa 1998-2013 14.26 3.14 11.70 121.88 26.84 Ndembera at Ilongo 1998-2013 7.19 0.28 4.72 152.33 5.93 Mtitu 1998-2013 4.03 1.64 3.21 125.55 51.09
Lit. Ruaha at Mawande 1998-2013 24.70 5.53 17.64 140.02 31.35 Lit. Ruaha at Makalala 1998-2013 4.30 0.81 3.10 138.71 26.13
Cluster Mean 127.36 24.86
Sub-basin Mean (Ruaha) 129.94 33.99
4 Lumemo 1961-1980 13.45 4.59 12.11 111.07 37.90 Hagafiro 1961-1980 4.08 1.30 3.18 128.30 40.88 Mpanga 1961-1980 48.54 25.12 43.32 112.05 57.99 US Taveta Mission 1961-1980 105.26 43.80 79.84 131.84 54.86 Mngeta 1961-1980 27.09 7.52 22.95 118.04 32.77 Cluster Mean 120.26 44.88
Sub-basin Mean (Kilombero) 120.26 44.88