Triacylglycerols profile as a chemical tool to identify mushrooms
submitted to gamma or electron beam irradiation
Ângela Fernandesa,b, João C.M. Barreiraa,b, Amilcar L. Antonioa,c,d, Anabela Martinsa,
Isabel C.F.R. Ferreiraa,*, M. Beatriz P.P. Oliveirab
a
Centro de Investigação de Montanha, ESA, Instituto Politécnico de Bragança, Campus de
Santa Apolónia, Apartado 1172, 5301-855 Bragança, Portugal.
b
REQUIMTE/ Depto. de Ciências Químicas, Faculdade de Farmácia, Universidade do
Porto, Rua Jorge Viterbo Ferreira n.º 228, 4050-313 Porto, Portugal.
c
IST/ITN, Instituto Tecnológico e Nuclear , Estrada Nacional 10, 2686-953 Sacavém,
Portugal.
d
Departamento de Física Fundamental, Universidade de Salamanca, Plaza de la Merced,
37008 Salamanca, Spain.
*Author to whom correspondence should be addressed (I.C.F.R. Ferreira: [email protected],
Abstract
In order to define irradiation treatment as a routine conservation methodology, it is
imperative to develop chemometric indicators with the ability to distinguish irradiated
from unirradiated foodstuffs. Electron spin resonance, photostimulated luminescence and
thermoluminescence methods were employed to monitor radiation-induced markers, as
well as different chemical compounds produced from the lipidic fraction of different
foodstuffs. Otherwise, the specificity of triacylglycerol profiles was previously detected in
mushroom species, as also the effect of irradiation treatment in the triacylglycerol profiles
of chestnut. Accordingly, its feasibility as chemometric indicator of irradiated mushrooms
was evaluated. In line with the obtained results, the effects of each type of irradiation were
significantly different, as it can be concluded from the correlations among discriminant
functions and variables within each statistical test. Triacylglycerol profile proved to be a
useful tool to detect irradiated mushrooms, independently of the species or irradiation
source, especially for doses above 1 kGy.
1. Introduction
Mushrooms are widely appreciated foods due to their nutritional, organoleptic (Kalač,
2009) and pharmacological properties (Lindequist, Niedermeyer & Jülich, 2005).
Nevertheless, mushrooms shelf life is very short due to several postharvest changes related
to the high respiration rate and lack of physical protection to avoid water loss or bacteria
and moulds attack, which results in weight loss and browning (Fernandes, Antonio,
Oliveira, Martins, & Ferreira, 2012). Irradiation is a conservation/preservation technique
that can minimize the mentioned losses, contributing to extend foods shelf life and
reducing health hazards (Soika & Delincée, 2000).
The specific effects of radiation on mushrooms chemical composition and antioxidant
activity have been progressively studied by our research group, either using gamma
irradiation (Fernandes et al., 2013a) or electron beam treatment (Fernandes et al., 2013b).
The existence of tests capable of distinguishing irradiated from unirradiated foodstuffs is
imperative, in order to regulate international trade and guarantee freedom of choice to the
consumer (Ndiaye, Jamet, Miesch, Hasselmann, & Marchioni, 1999). The European
Committee for Standardization validated methods to identify irradiated foods; these
methods are based on the study of primary radiolytic products by Electron Paramagnetic
Resonance (EPR) and thermoluminescence, or on the analysis of certain chemical
compounds (e.g., volatile hydrocarbons and 2-alkylcyclobutanones) formed by the radiolysis of triglycerides (Ndiaye et al., 1999). The European Union (EU) adopted
Directives 1999/2/EC and 1999/3/EC to standardize the rules of processing and marketing
of irradiated foods in countries of EU for consumer protection and information (Alberti et
al., 2011). At the European level, there are official protocols for the electron spin
resonance (ESR) detection of irradiated foodstuffs containing bone structures (EN 1786,
sugar (EN 13708, 2001; Alberti et al., 2011). Several ESR studies were made for the
identification of irradiated seafood: fishes, crustacean, shrimps and mollusks (Alberti et al.,
2011). Regarding fatty foods, the main methods are based on the chemical determination
of compounds formed from the irradiation of lipid components; 2-alkylcyclobutanones
(2-ACBs) are produced by the irradiation of fatty acids and glycerides (Crews, Driffield, &
Thomas, 2012). 2-Dodecylcyclobutanone (2-DCB) (Blanch, Caja, Flores, & Castillo,
2009), produced from palmitic acid specifically by radiolysis (Ndiaye et al., 1999) and the
alkane hydrocarbons were used as irradiation markers in sliced dry-cured ham. These two
compounds were evaluated by solid phase microextraction (SPME)-gas
chromatography-mass spectrometry (GC-MS) (Blanch et al., 2009). Otherwise, gamma irradiation of
papaya resulted in the appearance of a new peak in the GC-MS, which was identified as
phenol, functioning as a marker of this irradiated food (Chatterjee, Variyar, & Sharma,
2012). Photostimulated luminescence (PSL) and thermoluminescence (TL) methods were
also employed to monitor radiation-induced markers in gamma ray and electron beam
irradiated wheat after different processing treatments (Kim, Akram, Ahn, & Kwon, 2012).
Triacylglycerols (TAG) profile is specific of each natural matrix and it has been used for
detecting adulteration of fats and oils, crystallization and recognition of oil origins, being
one of the prime determinants in the study of oil oxidation (Zeb, 2012; Barreira et al.
2013). It can also act as a quality marker in roasted coffee (Toci, Neto, Torres, & Farah,
2013) and was also pointed out as a chemical taxonomical marker for mushrooms
(Barreira, Ferreira, Oliveira, & 2012).
Therefore, the potential of using TAG profile as a marker for detecting irradiated foods
and, in particular, mushrooms, was evaluated. In order to achieve a high broad irradiation
marker, samples from mushrooms submitted to different industrial processing, irradiation
2. Materials and methods
2.1. Standards and reagents
Triacylglycerols tripalmitoylglycerol (PPP), tristearoylglycerol (SSS),
1,2,3-trilinolenoylglycerol (LnLnLn), and 1,2,3-tripalmitoleoylglycerol (PoPoPo), of purity >
98%, and 1,2,3- trioleoylglycerol (OOO), 1,2,3-trilinoleoylglycerol (LLL), 1,2-dilinoleoyl-
3-palmitoyl-rac-glycerol (PLL), dilinoleoyl-3-oleoylrac- glycerol (OLL),
1,2-dipalmitoyl-3-oleoyl-rac-glycerol (PPO), 1,2-dioleoyl-3-stearoyl-rac-glycerol (SOO),
1-palmitoyl-2-oleoyl-3-linoleoylglycerol (POL), and 1,2-dioleoyl-3-palmitoyl-racglycerol
(POO), of ≈99% purity, were purchased from Sigma (St. Louis, MO, USA). Petroleum
ether was analytical grade and obtained from Fisher Scientific (Leicestershire, UK).
Acetonitrile and acetone were HPLC grade and obtained from Merck (Darmstadt,
Germany). The code letters used for the fatty acids are: L, linoleic; Ln, linolenic; O, oleic;
P, palmitic; Po, palmitoleic; S, stearic.
2.2. Samples
Macrolepiota procera, Boletus edulis, Russula delica and Boletus pinophilus were collected in Trás-os-Montes, in the Northeast of Portugal; the first two mushroom species were collected in November 2011 and the other species were collected in November 2012.
B. edulis fruiting bodies were divided in two groups with twelve mushrooms per group, and further submitted to drying (at 30 ºC in an oven) or kept fresh (stored at 4 ºC in a
refrigerator). Drying samples group was then subdivided in three subgroups submitted to
gamma irradiation: control (non-irradiated, 0 kGy), sample 1 (irradiated with 1 kGy) and
was subdivided in four subgroups treated with electron-beam irradiation: control
(non-irradiated, 0 kGy), sample 1 (irradiated with 2 kGy), sample 2 (irradiated with 6 kGy) and
sample 3 (irradiated with 10 kGy) with 3 mushrooms per subgroup.
M. procera fruiting bodies were divided in three groups with nine mushrooms per group, and further submitted to different processing technologies: freezing (at -20º C in a freezer),
drying (at 30 ºC in an oven) and the third group was kept fresh (stored at 4 ºC in a
refrigerator). Each group was further subdivided in three subgroups: control
(non-irradiated, 0 kGy); sample 1 (irradiated with 0.5 kGy) and sample 2 (irradiated with 1
kGy).
Besides the former mushrooms, which stand among the species producing in highest
quantity, two additional species were studied. A second Boletus species (B. pinophilus) was studied following the same sampling used for B. edulis fresh samples, except the intermediate dose, which was not tested.
A brittlegill mushroom (R. delica) was also studied as an example of a less appreciated, despite edible, species. The same sampling as that used for B. edulis dried samples was followed, except for the higher number (6) of samples per group.
All the samples were lyophilized (FreeZone 4.5 model 7750031, Labconco, Kansas, USA),
reduced to a fine dried powder (20 mesh) and mixed to obtain homogenized samples for
subsequent analysis.
2.3. Samples irradiation 2.3.1. Gamma irradiation
The irradiation of the samples was performed in a Co-60 experimental chamber with four
sources, total activity 198 TBq (5.33 kCi), in November 2012 (Precisa 22, Graviner
the Fricke dosimeter and the procedure described in the standards (ASTM, 1992), all
groups were placed in Poly(methyl methacrylate) (PMMA) box, or acrylic glass, and
irradiated at ambient atmosphere and temperature (15 ºC). To monitor the process during
the irradiation, 4 routine dosimeters were used for each group for the higher dose (Amber
Perspex dosimeters, batch V, from Harwell company, U.K.). The samples were rotated
upside down (180º) at half of the time, to increase the dose uniformity. The Amber Perspex
dosimeters were read in a UV-VIS Spectrophotometer (Shimadzu mini UV 1240
spectrophotometer) at 603 nm, two readings for each, to estimate the dose according to a
previous calibration curve.
The estimated doses after irradiation for M. procera were 0.6±0.1 kGy and 1.1±0.1 kGy for samples 1 and 2, respectively, at a dose rate of 2.3 kGy h-1. The estimated doses and
dose rates were: 1.14±0.23 kGy, 1.71 kGy h-1 and 1.99±0.32 kGy, 1.49 kGy h-1 for B. edulis sample 1 and 2 respectively; for B. pinophilus, the estimated doses and dose rates were: 2.09±0.16 kGy and 1.57 kGy h-1.
2.3.2. Electron beam irradiation
For B. edulis and R. delica the irradiation was performed at the INCT - Institute of Nuclear Chemistry and Technology, in Warsaw, Poland. To estimate the dose during the irradiation
process three types of dosimeters were used a standard dosimeter, graphite calorimeter, and
two routine dosimeters, Gammachrome YR and Amber Perspex, from Harwell Company
(UK). The irradiation took place in an e-beam irradiator of 10 MeV of energy with pulse
duration of 5.5 µs, a pulse frequency of 440 Hz, and an average beam current of 1.1 mA;
the scan width was 68 cm, the conveyer speed was settled to the range 20-100 cm/min and
the scan frequency was 5 Hz. The estimated absorbed doses were 2.5, 6.2 and 10.9 kGy,
spectrophotometric methods were used at 603 nm and at 530 nm, respectively, to estimate
the dose from the value of absorbance according to a previous calibration curve. For the
Graphite calorimeter dosimeter the electrical resistance was read and converted in dose
according to a previous calibration curve (Carocho et al., 2012).
2.4. Triacylglycerols analysis
Each sample (~3 g) was then submitted to an extraction with petroleum ether (40-60 ºC)
performed in Soxhlet apparatus for 1.5 h. The chromatographic analyses were carried out
according to the procedure previously described (Barreira, Casal, Ferreira, Oliveira, &
Pereira, 2009), with a Jasco (Tokyo, Japan) HPLC system, equipped with a PU-1580
quaternary pump and a Jasco AS-950 automatic sampler with a 10 µL loop. Detection was
performed with an evaporative light-scattering detector (ELSD) (model 75-Sedere,
Alfortville, France). The chromatographic separation of the compounds was achieved with
a Kromasil 100 C18 (5 µm; 250 mm × 4.6 mm) column (Teknokroma, Barcelona, Spain)
operating at room temperature (≈20 ºC). The mobile phase was a mixture of acetone and
acetonitrile (70:30), in an isocratic mode, at an elution rate of 1 mL/min. Detection was
performed with an evaporative light-scattering detector (ELSD) (model 75-Sedere,
Alfortville, France) with the following settings: evaporator temperature 40 ºC, air pressure
3.5 bar and photomultiplier sensitivity 6. Taking into account the selectivities (R, relative
retention times to LLL), peaks were identified according to the logarithms of R in relation
to homogeneous TAG standards. Quantification of the peaks was made by internal
normalization of chromatographic peak area, and the results were expressed in relative
percentage, assuming that the detector response was the same for all the compounds within
each analysis. Data were analyzed using the Borwin-PDA Controller Software (JMBS,
2.5. Statistical analysis
For each combination of processing technology, irradiation type and dose, three samples
were analysed, with all the assays being also carried out in triplicate. Data were expressed
as mean ± standard deviation. All statistical tests were performed at a 5% significance
level using SPSS software, version 18.0.
2.5.1. Analysis of variance
The fulfilment of the one-way ANOVA requirements, specifically the normal distribution
of the residuals and the homogeneity of variance, was tested by means of the Shapiro
Wilk’s and the Levene’s tests, respectively. All dependent variables were compared using
Tukey’s honestly significant difference (HSD) or Tamhane’s T2 multiple comparison tests,
when homoscedasticity was verified or not, respectively. Results obtained for B. pinophilus
were classified using a simple t-test for equality of means (after checking the equality of variances through a Levene’s test), since there were fewer than three groups.
2.5.2. Stepwise Linear Discriminant Analysis (LDA)
LDA was used to check for significant differences in TAG profiles in result of being
submitted to different processing technologies, irradiation types and doses. A stepwise
technique, using the Wilks’ λ method with the usual probabilities of F (3.84 to enter and 2.71 to remove), was applied to select variables. This procedure follows a combination of
forward selection and backward elimination steps; i.e., before a new variable is selected to be included, it is verified whether all previously selected variables remain significant
(Cunha & Oliveira, 2006; Hill & Lewicki, 2006). The combination of varieties is defined
the second provides the second most, and so on (López, García, & Garrido, 2008). To
verify which canonical discriminant functions were significant, the Wilks’ λ test was
applied. To keep a more realistic data modulation, a leave-one-out cross-validation
procedure was carried out to assess the model performance. Moreover, the sensibility and
specificity of the discriminant model were computed from the number of individuals
correctly predicted as belonging to an assigned group (Benitez, Nogales, Campos, &
Ruano, 2006). Sensibility was calculated by dividing the number of samples of a specific
group correctly classified by the total number of samples belonging to that specific group.
Specificity was calculated by dividing the number of samples of a specific group classified
as belonging to that group by the total number of samples of any group classified as
belonging to that specific group.
3. Results and discussion
In a previous work conducted to evaluate the usefulness of mushrooms’ triacylglycerol
(TAG) profile as a chemical fingerprint for different taxonomic ranks, the highest intrinsic
differences were found among mushroom species, indicating a high degree of specificity,
possibly derived from the genetic control of the stereospecific distribution of fatty acids on
the glycerol molecule (Barreira, Ferreira, & Oliveira, 2012). In addition, the effects of
gamma and electron-beam irradiation on TAG profiles were also reported as being
significant, especially with the highest doses (1 and 3 kGy in both cases), in a study
performed on chestnut samples.
Accordingly, TAG profiles in mushrooms submitted to different irradiation types and
doses were characterized. Four mushroom species were selected, using samples processed
according to the most common industrial availability (fresh, dried and frozen) for wild
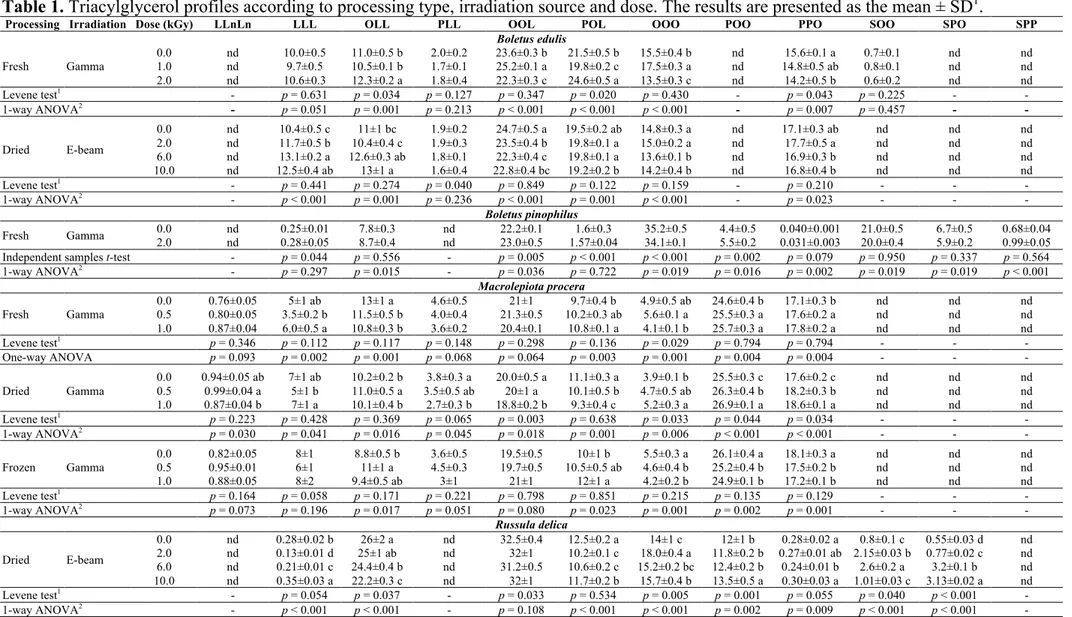
Table 1 shows the mean values obtained for TAG profiles of each mushroom species,
according to the processing type and irradiation treatment. The values are presented in
relative percentage due to limitations in the availability of high-purity standards.
Nevertheless, the peak areas might be readily converted into relative TAG concentration,
assuming linearity and uniformity of the detector signal, regardless of the TAG molecule
and absolute concentration (Rombaut, De Clercq, Foubert, & Dewettinck, 2009). The usual
chromatographic elution order is ttt, stt, mtt, stt, ddt, mdt, sdt, ddd, mmt, smt, mdd, sst,
sdd, mmd, smd, mmm, ssd, smm, ssm and sss (s = saturated, m = monoenoic, d = dienoic
and t = trienoic acids (Fuchs et al., 2011). TAGs quantified in Table 1 followed the
expected order: LLnLn (dtt), LLL (ddd), OLL (mdd), PLL (sdd), OOL (mmd), POL (smd),
OOO (mmm), POO (smm), PPO (ssm), SPO (ssm) and SPP (sss), except for SOO (smm).
In this first set of data, mean values were calculated for each irradiation dose, irradiation
source and processing type. As a preliminary overview, it is possible to conclude that the
effect of electron-beam irradiation is more pronounced than that obtained for gamma
irradiation (except for dried M. procera samples), as it can be observed by the p-values for 1-way ANOVA test. However, this result might be explained by the higher doses used in
electron-beam irradiation, instead of the irradiation source. Following the same reasoning,
changes in dried samples were more evident than those verified in fresh or frozen samples.
Regarding some particular changes, the Levene test showed that the assumption of equality
among variances could be made in most cases, allowing applying Tukey test as a multiple
comparison test. In the remaining cases samples were classified by means of the
Tamhanes’ T2 test.
Fresh B. edulis samples submitted to gamma irradiation presented higher percentages of OLL and POL and less OOL, OOO and PPO, especially for 1 kGy dose. The effects of
and 10 kGy doses, which produced similar changes: higher percentages in LLL and OLL
and lower percentages in OOL, OOO and PPO.
Results obtained for B. pinophilus were classified using a simple t-test for equality of means (after checking the equality of variances through a Levene’s test), since less than
three groups were available. OLL, OOL and POO showed to be significantly higher in
irradiated samples, while OOO, PPO, SOO and SPO presented higher values in
unirradiated samples.
Concerning M. procera, the effects of gamma irradiation were more marked in dried samples, since the mean value of at least one dose differs from the others for all TAG.
Among fresh samples, irradiation tended to increase LLL, POL, POO and PPO
percentages; the same effect was observable for LLL, OOO, POO and PPO in dried
samples and OLL and POL in frozen samples. On the other hand, fresh unirradiated
samples presented higher contents in OLL, PLL, dried unirradiated samples in OOL and
POL, and unirradiated frozen samples in OOO, POO and PPO.
In line with the observed for B. edulis, the effects of electron-beam irradiation were significant for most TAG molecules quantified in R. delica samples: LLL, POO and SPO had maximum percentages in samples irradiated with a 10 kGy dose, while OLL and POL
were highest in unirradiated samples, which simultaneously presented the least values in
OOO, SOO and SPO.
The significant differences found among the mean values for each TAG were a good
preliminary indicator of TAG profiles’ ability to act as an irradiation treatment indicator.
This assumption was checked by applying different linear discriminant analyses (LDA),
chosen as a supervised classification technique. Primarily, it was intended to verify if the
significant differences among irradiated and unirradiated samples could be enough to
general state of mushrooms (fresh, dried or frozen), irradiation type (gamma or
electron-beam) and irradiation doses (0, 0.5, 1.0, 2.0, 6.0 or 10.0, depending on each case).
Since the driving force was finding differences among irradiated and unirradiated samples
in a general way, and the assayed mushrooms presented qualitative and quantitative
differences in their TAG profiles, the set of data was normalized to overcome unrealistic
results derived from biased results such as differences in TAG profiles of each control. The
applied normalization consisted of calculating relative differences among each quantified
value (irradiated samples) and its respective control (unirradiated samples). Hence, LDA
was applied to the relative differences found for all measurements and not to the absolute
values presented in Table 1.
The significant independent variables (TAG) were selected using the stepwise procedure of
the LDA, according to the Wilks’ ë test. Only variables with a statistically significant
classification performance (p < 0.05) were kept in the analysis.
In the first approach, all doses (for both irradiation types) were used as grouping variables.
In this case, 5 significant functions were defined, from which the first three were plotted
(Figure 1). The three plotted functions integrated 95.1% of the observed variance (first,
68.1%; second, 16.5%; third, 10.5%). As can be observed, the naturally occurring groups
(each assayed dose) were not individually clustered. Nevertheless, the classification
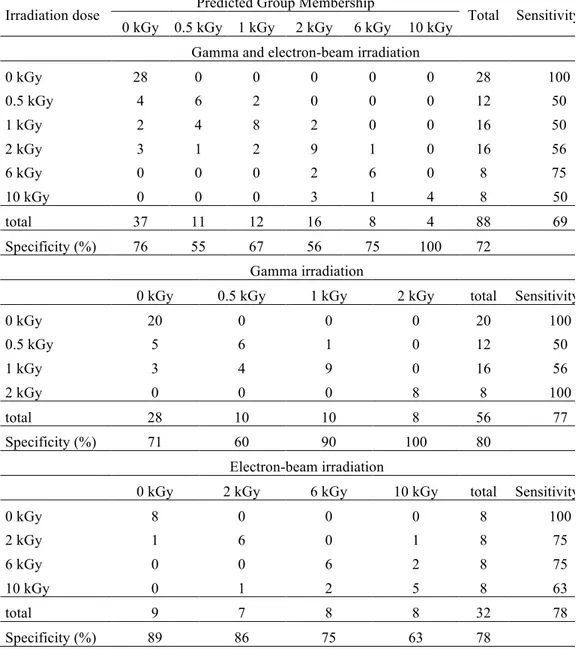
performance was satisfactory, resulting in 69% of correctly classified samples (sensitivity)
within the leave-one-out cross-validation procedure (Table 2). All unirradiated samples
were correctly classified and none of samples irradiated with 6 or 10 kGy resulted in a
false negative (unirradiated). Hence, the obtained model seems to be effective to detect
irradiation treatment above 2 kGy, independently of irradiation source. The satisfactory
performance of the proposed classification procedure is also confirmed by the overall
LLL, PLL, SPP, OOL and SOO in the final discriminant model, being verified that OOL
and SPO were the variables with highest correlation with function 1, SPO and SPP with
function 2 and PLL and LLL with function 3.
In order to abolish the effect of irradiation type, two additional LDA were applied fixing
the results obtained for gamma and electron-beam irradiation treatment. In the first case,
the discriminant model was defined with 3 significant functions (Figure 2a), which
included 100.0% of the observed variance (function 1: 92.7%, function 2: 5.0%, function
3: 2.3%). The model showed a better classification performance (sensitivity = 77%). In
fact, as can be observed from Table 2, all unirradiated samples were correctly classified
and none of samples irradiated with 2 kGy resulted in a false negative (unirradiated).
Hence, the obtained model seems to be effective to detect gamma irradiation treatment
above 1 kGy. The satisfactory performance of the proposed classification procedure is also
confirmed by the overall specificity (80%) achieved for the cross-validation procedure.
SPP, POL (more correlated with the first function), LLL, PPO (more correlated with the
second function), LLnLn, OOL and POO (more correlated with the third function) were
the variables kept in the final discriminant model.
Regarding e-beam irradiation, the discriminant model selected also 3 significant functions
(Figure 2b), which included 100.0% of the observed variance (function 1: 76.2%, function
2: 16.2%, function 3: 7.6%). The model showed a similar classification performance
(sensitivity = 78%). Once again, the unirradiated samples were correctly classified in all
cases; furthermore, none of samples irradiated with 6 or 10 kGy resulted in a false
negative, allowing considering the feasibility of the model to detect electron-beam
irradiation treatment above 2 kGy. The performance of the proposed classification
procedure is also confirmed by the overall specificity (78%) achieved for the
PPO (more correlated with the second function), were the variables kept in the final
discriminant model.
Overall, TAG profile might be a practical tool to detect irradiated mushrooms,
independently of mushroom species or irradiation source. The effects of each type of
irradiation were significantly different, as it can be concluded from the correlations among
discriminant functions and variables within each statistical test. The suggested
chemometric parameter was more reliable for the higher assayed doses, indicating that the
lowest doses had only a slight effect on TAG profiles. Other mushrooms species might be
scrutinized in order to increase the broadness of application of this particular chemometric
indicator.
Acknowledgements
Authors are grateful to the Foundation for Science and Technology (FCT, Portugal) for
financial support to research centres CIMO (PEst-OE/AGR/UI0690/2011) and
REQUIMTE (PEst-C/EQB/LA0006/2011). Â. Fernandes, J.C.M. Barreira and A.L.
Antonio thank FCT, POPH-QREN and FSE for their grants (SFRH/BD/76019/2011,
SFRH/BPD/72802/2010 and SFRH/PROTEC/67398/2010, respectively). The authors also
thank Prof. A. Chmielewski and Dr. A. Rafalski, from Institute of Nuclear Chemistry and
Technology, Warsaw, Poland, for electron beam irradiations.
References
Alberti, A., Chiaravalle, E., Fuochi, P., Macciantelli, D., Mangiacotti, M., Marchesani, G.,
ASTM, American Society for Testing and Materials. (1992). Practice for Using the Fricke
Reference Standard Dosimetry System, ASTM E1026. Annual Book of ASTM
Standards, 12.02, Philadelphia, PA.
Barreira, J.C.M., Casal, S., Ferreira, I.C.F.R., Oliveira, M.B.P.P., & Pereira, J.A. (2009).
Nutritional, fatty acid and triacylglycerol profiles of Castanea sativa Mill. cultivars: a compositional and chemometric approach. Journal of Agricultural and Food Chemistry,57, 2836-2842.
Barreira, J.C.M, Ferreira, I.C.F.R., & Oliveira, M.B.P.P. (2012). Triacylglycerol profile as
a chemical fingerprint of mushroom species: evaluation by principal component and
linear discriminant analyses. Journal of Agricultural and Food Chemistry, 60,
10592-10599.
Barreira, J.C.M., Carocho, M., Ferreira, I.C.F.R., Antonio, A.L., Kaluska, I., Botelho, M.
L., Bento, A., & Oliveira, M.B.P.P. (2013). Effects of gamma and electron beam
irradiations on the triacylglycerol profile of fresh and stored Castanea sativa Miller samples. Postharvest Biology and Technology, 81, 1-6.
Benitez, E., Nogales, R., Campos, M., & Ruano, F. (2006). Biochemical variability of
olive-orchard soils under different management systems. Applied Soil Ecology, 32, 221-231.
Blanch, G.P., Caja, M.M., Flores, G., & Castillo, M.L.R. (2009). Identification of
2-dodecylcyclobutanone and linear-alkanes as irradiation markers in sliced dry-cured
ham. Food Chemistry, 113, 616-620.
Carocho, M., Barreira, J.C.M., Antonio, A.L., Bento, A., Kaluska, I., & Ferreira, I.C.F.R.
(2012). Effects of Electron Beam Radiation on Nutritional parameters of Portuguese
Chatterjee, S., Variyar, P.S., & Sharma, A. (2012). Post-irradiation identification of papaya
(Carica papaya L.) fruit. Radiation Physics and Chemistry, 81, 352-353.
Crews, C., Driffield, M., & Thomas, C. (2012). Analysis of 2-alkylcyclobutanones for
detection of food irradiation: Current status, needs and prospects. Journal of Food Composition and Analysis, 26, 1-11.
Cunha, S.C., & Oliveira, M.B.P.P. (2006). Discrimination of vegetable oils by
triacylglycerols evaluation of profile using HPLC/ELSD. Food Chemistry, 95, 518-524.
EN 1786. (1996). Foodstuffs: detection of irradiated food containing bone - method by
ESR spectroscopy. European Committee of Standardization (CEN), Brussels.
EN 1787. (2000). Foodstuffs: detection of irradiated food containing cellulose by ESR
spectroscopy. European Committee of Standardization (CEN), Brussels.
EN 13708 (2001). Foodstuffs: detection of irradiated food containing crystalline sugar by
ESR spectroscopy. European Committee of Standardization (CEN), Brussels.
Fernandes, Â., Antonio, A.L., Oliveira, M.P.P., Martins, A., & Ferreira, I.C.F.R. (2012).
Effect of gamma and electron beam irradiation on the physico-chemical and
nutritional properties of mushrooms: A review. Food Chemistry, 135, 641-650. Fernandes, Â., Antonio, A.L., Barreira, J.C.M., Botelho, L., Oliveira, M.B.P.P., Martins,
A., & Ferreira, I.C.F.R. (2013a). Effects of gamma irradiation on the chemical
composition and antioxidant activity of Lactarius deliciosus L. wild edible mushroom. Food and Bioprocess Technology, 6, 2895-2903.
Fernandes, Â., Barreira, J.C.M., Antonio, A.L., Oliveira, M.B.P.P., Martins, A., &
Ferreira, I.C.F.R. (2013b). Combined effects of electron-beam irradiation and storage
Fuchs, B., Rosmarie, Suss R., Teuber, K., Eibisch, M., & Schiller, J. (2011). Lipid analysis
by thin-layer chromatography- A review of the current state. Journal of Chromatography A, 1218, 2754-2774.
Hill, T., & Lewicki, P. (2006). Statistics: Methods and Applications. A Comprehensive
Reference for Science, Industry, and Data Mining; StatSoft: Tulsa, OK, USA.
Kalač, P. (2009). Chemical composition and nutritional value of European species of wild
growing mushrooms: A review. Food Chemistry, 113, 9-16.
Kim, G.-R., Akram, K., Ahn, J.-J., & Kwon, J.-H. (2012). Identification of gamma ray and
electron-beam irradiated wheat after different processing treatments. Journal of Cereal Science, 56, 347-351.
Lindequist, U., Niedermeyer, T.H.J., & Jülich, W.-D. (2005). The Pharmacological
Potential of Mushrooms - review. eCAM, 3, 285-299.
López, A., García, P., & Garrido, A. (2008). Multivariate characterization of table olives
according to their mineral nutrient composition. Food Chemistry, 106, 369-378. Ndiaye, B., Jamet, G., Miesch, M., Hasselmann, C., & Marchioni, E. (1999).
2-Alkylcyclobutanones as markers for irradiated foodstuffs II. The CEN (European
Committee for Standardization) method: field of application and limit of utilization.
Radiation Physics and Chemistry, 55, 437-445.
Rombaut, R., De Clercq, N., Foubert, I., & Dewettinck, K. (2009). Triacylglycerol analysis
of fats and oils by evaporative light scattering detection. Journal of the American Oil Chemists’ Society, 86, 19-25.
Soika, C., & Delincée, H. (2000). Thermoluminescence analysis for detection of irradiated
food - luminescence characteristics of minerals for different types of radiation and
Toci, A.T., Neto, V.J.M.F., Torres, A.G., & Farah, A. (2013). Changes in triacylglycerols
and free fatty acids composition during storage of roasted coffee. LWT - Food Science and Technology, 50, 581-590.
Zeb, A. (2012). Triacylglycerols composition, oxidation and oxidation compounds in
Figure 1. Mean scores of different gamma and electron beam irradiation doses (all
assembled) projected for the three rotated discriminant functions defined from TAG
profiles.
Figure 2. Mean scores of different gamma (a) or electron beam (b) irradiation doses
Table 1. Triacylglycerol profiles according to processing type, irradiation source and dose. The results are presented as the mean ± SD1.
Processing Irradiation Dose (kGy) LLnLn LLL OLL PLL OOL POL OOO POO PPO SOO SPO SPP
Boletus edulis
Fresh Gamma
0.0 nd 10.0±0.5 11.0±0.5 b 2.0±0.2 23.6±0.3 b 21.5±0.5 b 15.5±0.4 b nd 15.6±0.1 a 0.7±0.1 nd nd
1.0 nd 9.7±0.5 10.5±0.1 b 1.7±0.1 25.2±0.1 a 19.8±0.2 c 17.5±0.3 a nd 14.8±0.5 ab 0.8±0.1 nd nd
2.0 nd 10.6±0.3 12.3±0.2 a 1.8±0.4 22.3±0.3 c 24.6±0.5 a 13.5±0.3 c nd 14.2±0.5 b 0.6±0.2 nd nd
Levene test1
- p = 0.631 p = 0.034 p = 0.127 p = 0.347 p = 0.020 p = 0.430 - p = 0.043 p = 0.225 - -
1-way ANOVA2 -
p = 0.051 p = 0.001 p = 0.213 p < 0.001 p < 0.001 p < 0.001 - p = 0.007 p = 0.457 - -
Dried E-beam
0.0 nd 10.4±0.5 c 11±1 bc 1.9±0.2 24.7±0.5 a 19.5±0.2 ab 14.8±0.3 a nd 17.1±0.3 ab nd nd nd
2.0 nd 11.7±0.5 b 10.4±0.4 c 1.9±0.3 23.5±0.4 b 19.8±0.1 a 15.0±0.2 a nd 17.7±0.5 a nd nd nd
6.0 nd 13.1±0.2 a 12.6±0.3 ab 1.8±0.1 22.3±0.4 c 19.8±0.1 a 13.6±0.1 b nd 16.9±0.3 b nd nd nd
10.0 nd 12.5±0.4 ab 13±1 a 1.6±0.4 22.8±0.4 bc 19.2±0.2 b 14.2±0.4 b nd 16.8±0.4 b nd nd nd
Levene test1 -
p = 0.441 p = 0.274 p = 0.040 p = 0.849 p = 0.122 p = 0.159 - p = 0.210 - - -
1-way ANOVA2 -
p < 0.001 p = 0.001 p = 0.236 p < 0.001 p = 0.001 p < 0.001 - p = 0.023 - - -
Boletus pinophilus
Fresh Gamma 0.0 nd 0.25±0.01 7.8±0.3 nd 22.2±0.1 1.6±0.3 35.2±0.5 4.4±0.5 0.040±0.001 21.0±0.5 6.7±0.5 0.68±0.04
2.0 nd 0.28±0.05 8.7±0.4 nd 23.0±0.5 1.57±0.04 34.1±0.1 5.5±0.2 0.031±0.003 20.0±0.4 5.9±0.2 0.99±0.05
Independent samples t-test - p = 0.044 p = 0.556 - p = 0.005 p < 0.001 p < 0.001 p = 0.002 p = 0.079 p = 0.950 p = 0.337 p = 0.564
1-way ANOVA2 -
p = 0.297 p = 0.015 - p = 0.036 p = 0.722 p = 0.019 p = 0.016 p = 0.002 p = 0.019 p = 0.019 p < 0.001
Macrolepiota procera
Fresh Gamma
0.0 0.76±0.05 5±1 ab 13±1 a 4.6±0.5 21±1 9.7±0.4 b 4.9±0.5 ab 24.6±0.4 b 17.1±0.3 b nd nd nd
0.5 0.80±0.05 3.5±0.2 b 11.5±0.5 b 4.0±0.4 21.3±0.5 10.2±0.3 ab 5.6±0.1 a 25.5±0.3 a 17.6±0.2 a nd nd nd 1.0 0.87±0.04 6.0±0.5 a 10.8±0.3 b 3.6±0.2 20.4±0.1 10.8±0.1 a 4.1±0.1 b 25.7±0.3 a 17.8±0.2 a nd nd nd Levene test1
p = 0.346 p = 0.112 p = 0.117 p = 0.148 p = 0.298 p = 0.136 p = 0.029 p = 0.794 p = 0.794 - -
-One-way ANOVA p = 0.093 p = 0.002 p = 0.001 p = 0.068 p = 0.064 p = 0.003 p = 0.001 p = 0.004 p = 0.004 - -
-Dried Gamma
0.0 0.94±0.05 ab 7±1 ab 10.2±0.2 b 3.8±0.3 a 20.0±0.5 a 11.1±0.3 a 3.9±0.1 b 25.5±0.3 c 17.6±0.2 c nd nd nd 0.5 0.99±0.04 a 5±1 b 11.0±0.5 a 3.5±0.5 ab 20±1 a 10.1±0.5 b 4.7±0.5 ab 26.3±0.4 b 18.2±0.3 b nd nd nd 1.0 0.87±0.04 b 7±1 a 10.1±0.4 b 2.7±0.3 b 18.8±0.2 b 9.3±0.4 c 5.2±0.3 a 26.9±0.1 a 18.6±0.1 a nd nd nd Levene test1
p = 0.223 p = 0.428 p = 0.369 p = 0.065 p = 0.003 p = 0.638 p = 0.033 p = 0.044 p = 0.034 - -
-1-way ANOVA2
p = 0.030 p = 0.041 p = 0.016 p = 0.045 p = 0.018 p = 0.001 p = 0.006 p < 0.001 p < 0.001 - -
-Frozen Gamma
0.0 0.82±0.05 8±1 8.8±0.5 b 3.6±0.5 19.5±0.5 10±1 b 5.5±0.3 a 26.1±0.4 a 18.1±0.3 a nd nd nd
0.5 0.95±0.01 6±1 11±1 a 4.5±0.3 19.7±0.5 10.5±0.5 ab 4.6±0.4 b 25.2±0.4 b 17.5±0.2 b nd nd nd
1.0 0.88±0.05 8±2 9.4±0.5 ab 3±1 21±1 12±1 a 4.2±0.2 b 24.9±0.1 b 17.2±0.1 b nd nd nd
Levene test1
p = 0.164 p = 0.058 p = 0.171 p = 0.221 p = 0.798 p = 0.851 p = 0.215 p = 0.135 p = 0.129 - -
-1-way ANOVA2 p = 0.073 p = 0.196 p = 0.017 p = 0.051 p = 0.080 p = 0.023 p = 0.001 p = 0.002 p = 0.001 - -
-Russula delica
Dried E-beam
0.0 nd 0.28±0.02 b 26±2 a nd 32.5±0.4 12.5±0.2 a 14±1 c 12±1 b 0.28±0.02 a 0.8±0.1 c 0.55±0.03 d nd
Table 2. Contingency matrix obtained using LDA based on TAG profiles of m species.
Irradiation dose Predicted Group Membership Total Sensitivity
0 kGy 0.5 kGy 1 kGy 2 kGy 6 kGy 10 kGy
Gamma and electron-beam irradiation
0 kGy 28 0 0 0 0 0 28 100
0.5 kGy 4 6 2 0 0 0 12 50
1 kGy 2 4 8 2 0 0 16 50
2 kGy 3 1 2 9 1 0 16 56
6 kGy 0 0 0 2 6 0 8 75
10 kGy 0 0 0 3 1 4 8 50
total 37 11 12 16 8 4 88 69
Specificity (%) 76 55 67 56 75 100 72
Gamma irradiation
0 kGy 0.5 kGy 1 kGy 2 kGy total Sensitivity (
0 kGy 20 0 0 0 20 100
0.5 kGy 5 6 1 0 12 50
1 kGy 3 4 9 0 16 56
2 kGy 0 0 0 8 8 100
total 28 10 10 8 56 77
Specificity (%) 71 60 90 100 80
Electron-beam irradiation
0 kGy 2 kGy 6 kGy 10 kGy total Sensitivity (
0 kGy 8 0 0 0 8 100
2 kGy 1 6 0 1 8 75
6 kGy 0 0 6 2 8 75
10 kGy 0 1 2 5 8 63
total 9 7 8 8 32 78
Figure 2.
(a)