Effect of gamma irradiation and extended storage on selected
chemical constituents and antioxidant activities of sliced mushroom
^
Angela Fernandes
a,b, Jo~
ao C.M Barreira
a,b, Tu
gba Günaydi
c, Hasan Alkan
c,
Amilcar L. Antonio
a, M. Beatriz P.P. Oliveira
b, Anabela Martins
a, Isabel C.F.R. Ferreira
a,* aCentro de Investigaçao de Montanha (CIMO), ESA, Instituto Polit~ ecnico de Bragança Campus de Santa Apolonia, 1172, 5301-855, Bragança, Portugal bREQUIMTE/LAQV, Faculdade de Farmacia, Universidade do Porto, Rua Jorge Viterbo Ferreira no. 228, 4050-313, Porto, PortugalcGamma-Pak Sterilizasyon San. ve Tic. A.S¸, O.S.B 2. Cad. Gazi Osman Pas¸a Mah., no. 6, 59500, Çerkezk€oy, Tekirdag, Turkey
a r t i c l e
i n f o
Article history:
Received 16 March 2015 Received in revised form 22 April 2016
Accepted 25 April 2016 Available online 26 April 2016
Keywords:
Wild mushrooms
Boletus edulis
Slicing Extended storage Gamma irradiation
a b s t r a c t
Due to its exquisite odor and taste, Boletus edulis Bull.: Fr. mushroom is being increasingly used throughout the world. However, the availability of this product is highly restrained by its seasonality and perishability, demanding special care to keep its quality. Furthermore, mushrooms are often distributed in sliced form, and the slicing operation requires special treatments, besides augmenting the possibility of microbial contamination. Some techniques are currently applied to sliced mushrooms, but these processes had adverse effects on nutrients, odor, texture and taste, besides requiring expensive equip-ment. Food irradiation is being studied as an alternative technology to improve the quality and durability of determined products, having been previously applied in several mushroom species. Herein, gamma irradiation was applied to dried and sliced samples ofB. edulis, at high doses (2, 6 and 10 kGy), and the effects on nutritional, chemical and antioxidant parameters were evaluated throughout storage (6 and 12 months). The results obtained for the chemical parameters do not advised storingB. edulisfor such extended periods, since some relevant changes were detected, especially in samples stored for 12 months. In general, the gamma irradiation treatment did not cause further changes in the chemical composition, besides having a slightly positive effect in keeping the antioxidant activity and most of the bioactive compounds profiled in this work, contributing to maintain the potential health effects of this exquisite food, even after extended storage periods.
©2016 Elsevier Ltd. All rights reserved.
1. Introduction
Boletus edulisBull.: Fr. (king bolete), is a popular edible mush-room in Europe, North America and Asia. Fresh and dried samples are available in occidental and oriental restaurants, as also in gourmet and healthy food stores. Theflavor (considering its odor and taste) of the dried king, in particular, is marvelous-nutty, earthy and meaty (Tsai, Tsai,&Mau, 2008).
The availability of B. edulis is seasonal and, like other edible mushrooms, it is highly perishable, mainly due to the high water content (approximately 90%), high level of enzyme activity and presence of micro-flora (Jaworska&Bernas, 2009). In fact, mush-rooms need a special care to keep their quality along the marketing and distribution either in fresh, frozen and dried forms, but mostly
when minimally processed, such as in the case of slicing (Iqbal, Rodrigues, Mahajan, & Kerry, 2009; Oliveira, Sousa-Gallagher, Mahajan,& Teixeira, 2012). In fact, slicing mushrooms requires special treatments to remove soil fragments and to reduce high microbial populations, in order to keep their sensorial and hygienic quality (Simon, Gonzalez-Fandos,&Vazquez, 2010). This process can spread bacteria over the cut surfaces because they have a greater contact area, which amplifies spoilage problems, such as dehydration, enzymatic browning and microbial spoilage (Brennan, Port, Pulvirenti,&Gormley, 1999).
The shelf life of sliced mushrooms has been studied by the sci-entific community in order tofind preservation and conservation alternatives. There are many methods and different processing techniques that can be applied to sliced mushrooms, such as so-dium metabisulfite (Brennan et al., 1999), citric acid or hydrogen peroxide (Brennan, Port,&Gormley, 2000), chitosan coating and modified atmosphere packaging (MAP) (Kim, Ko, Lee, Park, & *Corresponding author.
E-mail address:iferreira@ipb.pt(I.C.F.R. Ferreira).
Contents lists available atScienceDirect
Food Control
j o u r n a l h o m e p a g e : w w w . e l s e v i e r . c o m / l o c a t e / f o o d c o n t
http://dx.doi.org/10.1016/j.foodcont.2016.04.044
Hanna, 2006), washing and combinations of chlorine dioxide and hydrogen peroxide (Cliffe-Byrnes&O'Beirne, 2008), microwave-drying (Lombrana, Rodríguez,~ &Ruiz, 2010), washing with citric acid and MAP (Simon et al., 2010 ). However, some of these tech-niques can interact with specific nutrients, impair the odor and texture, produce unpleasant taste and can require expensive equipment (Junqueira et al., 2009).
Food irradiation (gamma rays or electron beam) has been applied for decades to destroy pathogenic and spoilage microor-ganisms without compromising the safety, nutritional and sensory quality (Inamura, Uehara, Teixeira,&Mastro, 2012). This technol-ogy is considered safe, wholesome, efficient, and reliable to obtain product improvements (Ehlermann, 2014). Our research group has been using gamma (Fernandes et al., 2013a, 2013b) and electron beam (Fernandes et al., 2014a, 2014b) irradiation in wild mush-rooms (non-sliced/whole samples), concluding about its suitability to maintain the chemical profile of several species (e.g.,Lactarius deliciosus L., Macrolepiota procera (Scop.) Singer, B. edulis Bull., Hydnum repandumL. Fr.,Russula delicaFr.). In the present work, gamma irradiation irradiation was applied to dried and sliced samples ofB. edulis, at high doses (2, 6 and 10 kGy), and the effects on nutritional, chemical and antioxidant parameters were evalu-ated during one year of storage (6 and 12 months).
2. Materials and methods
2.1. Standards and reagents
Acetonitrile 99.9%, n-hexane 95% and ethyl acetate 99.8% were of HPLC grade from Lab-Scan (Lisbon, Portugal). The fatty acids methyl ester (FAME) reference standard mixture 37 (standard 47885-U) was purchased from Sigma (St. Louis, MO, USA), as also other individual fatty acid isomers, tocopherol and sugar standards. Racemic tocol, 50 mg/mL, was purchased from Matreya (PA, USA). 2,2-Diphenyl-1-picrylhydrazyl (DPPH) was obtained from Alfa Aesar (Ward Hill, MA, USA). Standards trolox (6-hydroxy-2,5,7,8-tetramethylchroman-2-carboxylic acid) and gallic acid were from Sigma (St. Louis, MO, USA). Methanol and all other chemicals were of analytical grade and obtained from common sources. Standards of phenolic compounds (protocatechuic and p-hydroxybenzoic acids), cinnamic acid and organic acids (oxalic acid and fumaric acid) were from Sigma Chemical Co. (St. Louis, MO, USA).
Water was treated in a Mili-Q water purification system (TGI Pure Water Systems, USA).
2.2. Samples and gamma irradiation
B. edulisdried and sliced samples were obtained in a local store (Bragança, Northeast of Portugal), in May 2013, packed in hermetic sealed polyethylene bags and labeled as“Porcini mushrooms”, with the indication of species“B. edulis”below the commercial desig-nation. Subsequently, the content of 10 packages (20 g each) was mixed and four individual samples were separated: control (non-irradiated, 0 kGy); sample 1 (2 kGy); sample 2 (6 kGy) and sample 3 (10 kGy).
The irradiation was performed at Gamma-Pak Sterilizasyon, Çerkezk€oy, Turkey. To estimate the dose during the irradiation process routine dosimeters were used (Amber Perspex batch V, Harwell Company, Oxfordshire, UK), further read by spectropho-tometric methods. The routine dosimeters were previously cali-brated against ceric-cerous dosimeters following the standards, with a maximum uncertainty of 4.44% (ASTM, 2015).
Before analysis, the samples were reduced to a fine dried powder (20 mesh) and mixed to obtain homogenized samples.
3. Chemical parameters
3.1. Nutritional value
Protein, fat, carbohydrates and ash were determined following the AOAC procedures (AOAC, 1995). The crude protein content (N4.38) of the samples was estimated by the macro-Kjeldahl method; the crude fat was determined by extracting a known weight of powdered sample with petroleum ether, using a Soxhlet apparatus; the ash content was determined by incineration at 600 ± 15 C. Total carbohydrates were calculated by difference.
Energy was calculated according to the following equation: Energy (kcal)¼4(gproteinþgcarbohydrate)þ9(gfat).
3.2. Free sugars
Free sugars were determined by high performance liquid chromatography coupled to a refraction index detector (HPLC-RI) after the extraction procedure described byHeleno, Barros, Sousa, Martins, and Ferreira (2009), using raffinose as internal standard (IS). The equipment consisted of an integrated system with a pump (Knauer, Smartline system 1000), degasser system (Smartline manager 5000), auto-sampler (AS-2057 Jasco) and a RI detector (Knauer Smartline 2300). Data were analyzed using Clarity 2.4 Software (DataApex). The chromatographic separation was ach-ieved with a Eurospher 100-5 NH2column (4.6250 mm, 5 mm, Knauer) operating at 30C (7971 R Grace oven). The mobile phase
was acetonitrile/deionized water, 70:30 (v/v) at aflow rate of 1 mL/ min. The compounds were identified by chromatographic com-parisons with authentic standards. Quantification was performed using the internal standard method and sugar contents were further expressed in g per 100 g of dry weight (dw).
3.3. Fatty acids
Fatty acids were determined by gaseliquid chromatography withflame ionization detection (GC-FID), after the extraction and derivatization procedures previously described by Heleno et al. (2009). The analysis was carried out with a DANI model GC 1000 instrument equipped with a split/splitless injector, a FID at 260C
and a MachereyeNagel column (30 m0.32 mm ID0.25
mm d
f). The oven temperature program was as follows: the initial tem-perature of the column was 50C, held for 2 min, then a 30C/minramp to 125C, 5C/min ramp to 160C, 20C/min ramp to 180C,
3C/min ramp to 200C, 20C/min ramp to 220C and held for
15 min. The carrier gas (hydrogen) flow-rate was 4.0 mL/min (0.61 bar), measured at 50C. Split injection (1:40) was carried out
at 250 C. Fatty acid identi
fication was made by comparing the relative retention times of FAME peaks from samples with stan-dards. The results were recorded and processed using the Clarity DataApex 4.0 Software and expressed in relative percentage of each fatty acid.
3.4. Tocopherols
Tocopherols were determined after an extraction procedure previously described by Heleno, Barros, Sousa, Martins, and Ferreira (2010), using tocol as IS. The analysis was carried out in the HPLC system described above connected to afluorescence de-tector (FP-2020; Jasco) programmed for excitation at 290 nm and emission at 330 nm. The chromatographic separation was achieved with a Polyamide II normal-phase column (2504.6 mm; YMC Waters) operating at 30C. The mobile phase used was a mixture of
with authentic standards. Quantification was based on the fl uo-rescence signal response, using the internal standard method, and tocopherols content was further expressed in
mg per 100 g of dry
weight (dw).3.5. Organic acids
Organic acids were determined following a procedure previ-ously optimized and described by the authors (Barros, Pereira,& Ferreira, 2013). Analysis was performed by ultrafast liquid chro-matograph (UFLC) coupled to photodiode array detector (PDA), using a Shimadzu 20A series UFLC (Shimadzu Cooperation). Detection was carried out in a PDA, using 215 nm and 245 as preferred wavelengths. The organic acids were quantified by comparison of the area of their peaks recorded at 215 nm with calibration curves obtained from commercial standards of each compound. The results were expressed in mg per 100 g of dry weight (dw).
3.6. Phenolic compounds
Phenolic compounds were determined in the UFLC system mentioned above, as previously described by the authors (Barros, Duenas, Ferreira, Baptista,~ &Santos-Buelga, 2009). DAD detection was carried out using 280 nm and 370 nm as preferred wave-lengths. The phenolic compounds were characterized according to their UV spectra and retention times, and comparison with authentic standards. For quantitative analysis, calibration curves were prepared from different standard compounds. The results were expressed in
mg per 100 g dw.
4. Antioxidant parameters
4.1. Extraction procedure
The lyophilized powder (1.5 g) was stirred with methanol (30 mL) at 25C at 150 rpm for 1 h and
filtered through Whatman No. 4 paper. The residue was then extracted with an additional portion of methanol. The combined methanolic extracts were evaporated under reduced pressure (rotary evaporator Büchi R-210; Flawil, Switzerland), re-dissolved in methanol at 20 mg/mL (stock solution), and stored at 4C for further use. Successive
di-lutions were made from the stock solution and submitted toin vitro assays already described by the authors (Barros, Baptista, Correia, SaMorais,&Ferreira, 2007) to evaluate the antioxidant activity of the samples. The sample concentrations providing 50% of antioxi-dant activity or 0.5 of absorbance (EC50) were calculated from the graphs of antioxidant activity percentages (DPPH,
b-carotene/
linoleate and TBARS assays) or absorbance at 690 nm (reducing power assay) against sample concentrations. Trolox was used as standard.4.2. DPPH radical scavenging activity
This methodology was performed using an ELX800 Microplate Reader (Bio-Tek). The reaction mixture in each one of the 96-wells consisted of one of the different concentrations of the extracts (30
mL) and methanolic solution (270
mL) containing DPPH radicals
(610 5mol/L). The mixture was left to stand for 60 min in the dark. The reduction of the DPPH radical was determined by measuring the absorption at 515 nm. The radical scavenging ac-tivity (RSA) was calculated as a percentage of DPPH discoloration using the equation: % RSA¼[(ADPPH- AS)/ADPPH]100, where ASis the absorbance of the solution when the sample extract has been added at a particular level and ADPPHis the absorbance of the DPPHsolution.
4.3. Reducing power
Two different procedures were used to evaluate the reducing power:
A) Thefirst methodology was performed using the Microplate Reader described above. The different concentrations of the extracts (0.5 mL) were mixed with sodium phosphate buffer (200 mmol/L, pH 6.6, 0.5 mL) and potassium ferricyanide (1% w/v, 0.5 mL). For each concentration, the mixture was incu-bated at 50C for 20 min, and trichloroacetic acid (10% w/v,
0.5 mL) was added. The mixture (0.8 mL) was poured in the 48-wells, as also deionized water (0.8 mL) and ferric chloride (0.1% w/v, 0.16 mL), and the absorbance was measured at 690 nm.
B) The second methodology followed the Folin-Ciocalteu assay. The extract solution (1 mL) was mixed with Folin-Ciocalteu reagent (5 mL, previously diluted with water 1:10, v/v) and sodium carbonate (75 g/L, 4 mL). The tubes were vortex mixed for 15 s and allowed to stand for 30 min at 40C for
color development. Absorbance was then measured at 765 nm. Gallic acid was used to obtain the standard curve (0.0094e0.15 mg/mL), and the results were expressed as mg of gallic acid equivalents (GAE) per g of extract.
4.4. Inhibition of
b
-carotene bleachingb-carotene (2 mg) was dissolved in chloroform (10 mL) and 2 mL
of this solution were pipetted into a round-bottomflask. After the chloroform was removed at 40 C under vacuum, linoleic acid(40 mg), Tween 80 emulsifier (400 mg), and distilled water (100 mL) were added to theflask with vigorous shaking. Aliquots (4.8 mL) of this emulsion were transferred into different test tubes containing different concentrations of the extracts (0.2 mL). The tubes were shaken and incubated at 50C in a water bath. As soon
as the emulsion was added to each tube, the zero time absorbance was measured at 470 nm
b-Carotene bleaching inhibition was
calculated using the following equation: (absorbance after 2 h of assay/initial absorbance)100.4.5. TBARS (thiobarbituric acid reactive substances) assay
Porcine brains were obtained from official slaughtered animals, dissected, and homogenized with a Polytron in ice cold TriseHCl buffer (20 mM, pH 7.4) to produce a 1:2 w/v brain tissue homog-enate which was centrifuged at 3000g for 10 min. An aliquot (100
mL) of the supernatant was incubated with the different
con-centrations of the samples solutions (200mL) in the presence of
FeSO4(10 mM; 100mL) and ascorbic acid (0.1 mM; 100
mL) at 37
C for 1 h. The reaction was stopped by the addition of trichloroacetic acid (28% w/v, 500mL), followed by thiobarbituric acid (TBA, 2%, w/
v, 380mL), and the mixture was then heated at 80
C for 20 min.After centrifugation at 3000gfor 10 min to remove the precipitated protein, the color intensity of the malondialdehyde (MDA)-TBA complex in the supernatant was measured by its absorbance at 532 nm. The inhibition ratio (%) was calculated using the following formula: Inhibition ratio (%)¼[(A - B)/A]100%, where A and B were the absorbance of the control and the sample solution, respectively.
A. Fernandes et al. / Food Control 72 (2017) 328e337
5. Statistical analysis
All the extractions were performed in triplicate; each replicate was also measured thrice. Data were expressed as means±standard deviations.
An analysis of variance (ANOVA) with type III sums of squares was performed using the GLM (General Linear Model) procedure of the SPSS software version 22.0 (IBM Corp., Armonk, NY: USA). The dependent variables were analyzed using 2-way ANOVA, with the factors “storage time” (ST) and “gamma irradiation dose” (GI). When a statistically significant interaction (STGI) was detected, the two factors were evaluated simultaneously by the estimated marginal means plots for all levels of each single factor. Alterna-tively, if no statistical significant interaction was verified, means within each factor were compared using Tukey's honestly signifi -cant difference (HSD) multiple comparison test.
Furthermore, a linear discriminant analysis (LDA) was used to study the influence of both factors in an integrated manner, simultaneouslyfinding the parameters with the highest changes caused by ST or GI. A stepwise technique, using the Wilks'
l
method with the usual probabilities ofF(3.84 to enter and 2.71 to remove), was applied for variable selection. This procedure uses a combi-nation of forward selection and backward elimicombi-nation processes, where the inclusion of a new variable is preceded by ensuring that all variables selected previously remain significant (Maroco, 2003; Zielinski et al., 2014).With this approach, it is possible to determine which of the independent variables account most for the differences in the average score profiles of the differentB. edulisextracts. To verify the significance of canonical discriminant functions, the Wilks'
l
test was applied. A leaving-one-out cross-validation procedure was carried out to assess the model performance.6. Results and discussion
The effects of electron beam (2, 6 and 10 kGy) and gamma irradiation (1 and 2 kGy) on chemical and antioxidant parameters were previously assayed in dried (Fernandes et al., 2014b; 2015) and fresh (Fernandes et al., 2013b) samples of wild B. edulis, respectively. Herein, the study was extended by applying higher doses (2, 6 and 10 kGy) of gamma irradiation to dried sliced sam-ples of the same species obtained in a commercial retailer. In addition, the storage time (ST) was prolonged up to 12 months. Besides studying the effect of each factor (GI and ST) individually, the interaction among both effects (GIST) was also evaluated. This approach allows verifying if the effect of thefirst factor is ruled by a specific trend, independently of the variation of the second factor. The tabled values were presented as the mean value of each GI dose considering the results for all ST, as well as the mean value of each ST, calculated considering all the GI doses. Every time the interaction among factors was significant (p <0.05), acting as a
source of variability per se, the results could not be compared through any multiple comparison test. Alternatively, these cases were analysed considering the estimated marginal means (EMM) plots produced in the GLM. In all cases, the equality of variances was verified through the Levene's test (data not shown).
6.1. Effects on nutritional parameters
Table 1shows the nutritional composition and energetic value. When compared with previous works, despite being treated in fresh form (Fernandes et al., 2013b; Heleno et al., 2011), the ob-tained profiles presented lower amounts in fat, proteins and ash, and as expected (since carbohydrates are calculated by difference), higher amounts of carbohydrates. However, differences in macro-nutrients (as those further highlighted in Sections 6.2 and 6.3) might, in part, be explained by some specific factors, such as har-vesting year or geographical origin. Nevertheless, that is not a critical factor, since the main objective was verifying the effect of irradiation treatment and the sampling procedure followed in this work certainly assures the homogeneity of the samples used in any of the assayed conditions, thereby allowing to obtain some accurate conclusions.
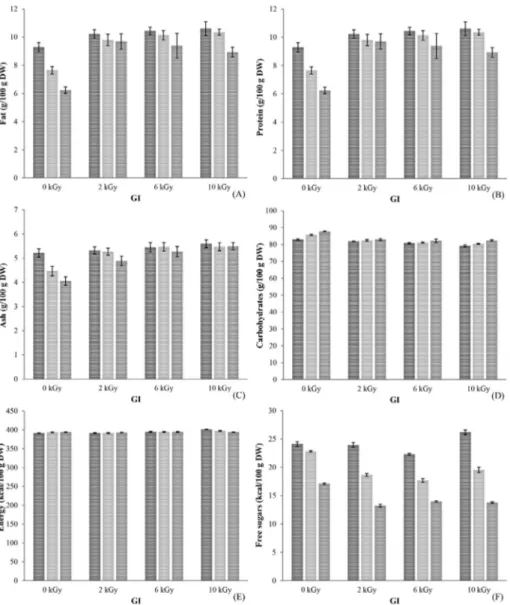
The GIST interaction was significant in all cases indicating that the influence of each assayed dose was not the same for all ST and vice-versa. In fact, considering the EMM plots (Fig. 1), it is obvious that fat contents were only significantly affected by storage in non-irradiated samples and those treated with 10 kGy; using 2 or 6 kGy resulted to be a good way to maintain fat levels along storage. All the other nutritional parameters were maintained throughout ST, independently of the applied GI.
6.2. Effects on chemical parameters
In line with previous studies (Fernandes et al., 2013b), trehalose was the main free sugar (Table 2), but the detected profiles pre-sented some differences in comparison to those reported for different B. edulis species, particularly the absence of glucose (Fernandes et al., 2013b) and the presence of fructose (Heleno et al., 2011). Furthermore, the samples studied herein gave higher free sugar contents. Some differences were also observed among organic acids profiles, specifically the lack of citric acid (Fernandes et al., 2013b), which was previously reported as the main organic acid inB. edulis, comprising a strong indicator of the variability induced by the collecting year/location, despite some uncertainty regarding the species might always be considered when acquiring dried mushrooms (the morphological features are obviously different from the fresh form). The interaction among factors (GIST) was once more significant. According to the EMM plots (shown only for total amounts), the 2 kGy dose allowed higher fructose contents, but only in samples stored for 6 months; at the end of storage, none of the applied doses was effective in
Table 1
Proximate composition of slice B. edulis submitted to different gamma irradiation doses (GI) and stored during distinct periods (ST). The results are presented as mean±SD.
Fat (g/100 g dw) Proteins (g/100 g dw) Ash (g/100 g dw) Carbohydrates (g/100 g dw) Energy (kcal/100 g dw)
ST 0 months 3±1 10±1 5.4±0.2 81±2 395±4
6 months 3.0±0.5 10±1 5.2±0.4 82±2 394±2
12 months 2.7±0.5 9±1 4.9±0.5 84±2 394±1
p-value (n¼36) <0.001 <0.001 <0.001 0.001 0.404
GI 0 kGy 2.2±0.2 8±1 4.6±0.5 85±2 393±1
2 kGy 2.5±0.2 9.9±0.5 5.2±0.2 82±1 392±1
6 kGy 3.2±0.1 10±1 5.4±0.2 81±1 395±1
10 kGy 3.9±0.5 10±1 5.5±0.2 81±1 397±3
preventing fructose decay. The effects on mannitol were quite similar, except for the overall tendency to lower values when the 6 kGy dose was applied. Regarding trehalose, the effects were identical to those observed for total sugars (Fig. 1F), indicating that GI was ineffective to maintain their levels during the assayed storage periods. In fact, the applied doses were also insufficient to keep the organic acid amounts (Fig. 1G).
The profiles in phenolic acids and tocopherols, which are usually regarded as powerful antioxidants, are given inTable 3. Phenolic acid levels were in the same range as those detected inB. edulis samples from a different year (Heleno et al., 2011). The contents detected in the control (0 months) showed a slight variability, but it was evident that phenolic acids decreased throughout ST, and this negative effect could not be prevented by none of the assayed GI doses (Fig. 1H). In fact,p-hydroxybenzoic acid, cinnamic acid and
a-tocopherol, did not reveal significant differences for each of the applied doses. The tocopherol vitamers tended to be higher in irradiated samples (Fig. 1I), with an obvious dose-dependent specificity (a-tocopherol in samples irradiated with 6 kGy, b-tocopherol in those irradiated with 2 kGy andg-tocopherol in
samples irradiated with 10 kGy); the higher levels detected in irradiated samples are in agreement with previous results(Fernandes et al., 2013b).
Among the quantified fatty acids, only those in a relative abundance higher than 0.2% were tabled (Table 2). Besides these, C6:0, C8:0, C10:0, C12:0, C14:0, C14:1, C15:0, C17:0, C17:1, C18:3n3, C20:2, C20:3n3, C20:5n3, C22:0, C22:1n9, C23:0, C24:0 and C24:1 were also detected. The detected profiles are similar to those re-ported in wildB. edulisspecies, except for the lower oleic acid and higher linoleic acid levels detected herein (Heleno et al., 2011; Yilmaz, Solmaz, Türkekul,&Elmastas¸, 2006). Like it was observed with all the previous parameters, the interaction among ST and GI was significant in all cases, such as the effect of each factorper se, except in the case of C18:0. Samples irradiated with 2 kGy showed the highest contents in C16:0, C16:1 and SFA. The latter is a striking example of the STGI interaction, since non-stored samples had the maximal value of SFA for non-irradiated samples and the minimum for those irradiated with 0 kGy (Fig. 1J). The contents in MUFA, especially due to the C18:1 contribution, were favoured by the 6 kGy dose, showing also a significant decrease after 12 months of storage (Fig. 1K). On the other hand, PUFA contents, which were mainly dictated by C18:2n6, were particularly higher in samples irradiated with 10 kGy (Fig. 1L).
Fig. 1.Estimated marginal mean plots representing the effects of ST and GI on fat (A), protein (B), ash (C), carbohydrates (D), energy (E), free sugars (F), organic acids (G), phenolic acids (H), tocopherols (I), SFA (J), MUFA (K) and PUFA (L).
A. Fernandes et al. / Food Control 72 (2017) 328e337
6.3. Effects on antioxidant parameters
In generalB. edulisextracts were more effective in hydrophilic
tests (DPPH scavenging activity and reducing power) than in those conducted in lipophilic environment (TBARS formation inhibition and
b-carotene bleaching inhibition), when compared to previously
Table 2
Free sugars and organic acids composition of slice B. edulis submitted to different gamma irradiation doses (GI) and stored during distinct periods (ST). The results are presented as mean±SD.
Fructose (g/100 g dw)
Mannitol (g/100 g dw)
Trehalose (g/100 g dw)
Free sugars (g/ 100 g dw)
Oxalic acid (mg/ 100 g dw)
Fumaric acid (mg/ 100 g dw)
Organic acids (mg/ 100 g dw) ST 0 months 0.8±0.2 3.2±0.5 20±1 24±1 302±35 63±9 365±41
6 months 0.7±0.1 2.8±0.5 16±2 20±2 254±28 47±5 302±28 12 months 0.5±0.1 1.9±0.3 12±2 15±1 162±21 37±8 199±23
p-value (n¼36)
<0.001 <0.001 <0.001 <0.001 <0.001 <0.001 <0.001
GI 0 kGy 0.7±0.2 2.7±0.5 18±2 21±3 215±39 52±7 267±42 2 kGy 0.7±0.2 3.1±0.5 15±4 19±4 238±44 44±9 282±52 6 kGy 0.6±0.1 1.8±0.4 15±3 18±3 251±89 50±17 301±105 10 kGy 0.6±0.1 2.8±0.5 16±4 20±5 253±70 52±14 304±76
p-value (n¼27)
<0.001 <0.001 <0.001 <0.001 0.122 0.055 0.239
STGIp-value (n¼108)
<0.001 <0.001 <0.001 <0.001 <0.001 <0.001 <0.001
reported results (Fernandes et al., 2013b; Heleno et al., 2011). Non-stored samples, with no exception, showed the highest antioxidant activity in all performed assays (Table 5). On the other hand, irradiation treatment did not induce particularly noticeable effects, despite the slightly lower EC50values found in irradiated samples.
Overall, the assayed factors showed to act cooperatively, as indicated by the obtained interaction significances. This indicates that the effect of a determined GI (or ST) is strongly dependent on the period of storage (or applied dose, respectively). For the ma-jority of parameters listed inTables 1e5, the applied irradiation
doses were not enough to avoid their decrease, probably due to the extended storage time.
Nevertheless, the effects of each level of the assayed factors might act in a specific manner when considering all the assayed parameters simultaneously. In addition, the selection of a deter-mined dose should be based in all assayed parameters. Thereby a linear discriminant analysis was applied in order to evaluate all the results in an integrated manner, allowing a more knowledgeable choice, and also to verify which of the assayed parameters suffer
the most relevant changes for each level of the assayed factors.
6.4. Linear discriminant analysis
The purpose of the performed discriminant analysis was esti-mating the association between a single categorical dependent variable (ST or GI) and a set of quantitative independent variables (results for all assayed parameters). A total of 53 (all fatty acids were used) parameters were included as independent variables, among which some were selected as significant, according to the Wilks'
l
test (only variables with a statistically significant classifi -cation performance,p<0.05, were kept in the analysis).Regarding the effect of ST, the discriminant model selected 2 significant functions, which included 100% of the observed vari-ance. Their graph representation (Fig. 2A) indicates the association of the analyzed ST and the selected independent variables (fat, ash, trehalose, organic acids,p-hydroxybenzoic acid, cinnamic acid,
g-tocopherol, C14:0, C17:1, C18:3n3, C20:0, C20:2, C20:3n3, C22:0, C24:0, DPPH scavenging activity, reducing power). The tested groups were completely individualized (100% of correctly classifiedTable 5
Antioxidant activity (EC50 values in mg/mL) and phenols content (mg GAE/g extract) of slice B. edulis submitted to different gamma irradiation doses (GI) and stored during distinct periods (ST). The results are presented as mean±SD.
DPPH scavenging activity Reducing power Lipid peroxidation inhibition
Ferricyanide/Prussian blue assay Folin-ciocalteu assayb-Carotene bleaching inhibition TBARS formation inhibition
ST 0 months 3.6±0.2 0.63±0.05 135±13 0.19±0.05 0.13±0.05
6 months 7±1 3±1 93±9 2±1 0.7±0.2
12 months 15±2 6±1 40±12 3±1 1.4±0.5
p-value (n¼36) <0.001 <0.001 <0.001 <0.001 0.001
GI 0 kGy 10±5 4±3 74±38 3±2 1.3±0.5
2 kGy 9±5 4±3 84±31 2±1 0.7±0.4
6 kGy 8±4 3±2 97±39 2±1 0.6±0.4
10 kGy 7±4 2±1 102±39 1±0.5 0.5±0.3
p-value (n¼27) <0.001 <0.001 <0.001 <0.001 <0.001 STGIp-value (n¼108)<0.001 <0.001 <0.001 <0.001 <0.001
Table 4
Major (relative abundance>0.25%) fatty acids composition of slice B. edulis submitted to different gamma irradiation doses (GI) and stored during distinct periods (ST). The results are presented as mean±SD.
C16:0 C16:1 C18:0 C18:1n9 C18:2n6 C20:0 C20:1 SFA MUFA PUFA
ST 0 months 10±1 0.65±0.05 2.4±0.1 32±1 51±1 0.31±0.03 0.35±0.05 14±1 34±1 52±1 6 months 11±1 0.66±0.05 2.4±0.1 32±2 52±2 0.40±0.05 0.40±0.05 15±1 33±2 52±2 12 months 10±1 0.73±0.05 2.4±0.2 31±1 53±1 0.39±0.05 0.43±0.05 14±1 32±1 54±1
p-value (n¼36) <0.001 <0.001 0.276 <0.001 <0.001 <0.001 <0.001 <0.001 <0.001 <0.001 GI 0 kGy 10±1 0.62±0.05 2.4±0.2 32±1 52±2 0.39±0.05 0.45±0.05 14±1 33±1 53±2 2 kGy 11±1 0.79±0.05 2.4±0.1 31±1 51±1 0.29±0.05 0.33±0.02 15±1 32±1 52±1 6 kGy 10±1 0.65±0.04 2.4±0.2 33±1 50±2 0.41±0.05 0.39±0.04 14±1 34±1 51±2 10 kGy 10±1 0.66±0.05 2.4±0.1 31±1 54±1 0.37±0.04 0.40±0.02 14±1 32±1 54±1
p-value (n¼27) <0.001 <0.001 0.599 <0.001 <0.001 <0.001 <0.001 <0.001 <0.001 <0.001 STGI p-value (n¼108) <0.001 <0.001 <0.001 <0.001 <0.001 <0.001 <0.001 <0.001 <0.001 <0.001
Table 3
Phenolic acids, cinnamic acid and tocopherols composition (mg/100 g dw) of slice B. edulis submitted to different gamma irradiation doses (GI) and stored during distinct periods (ST). The results are presented as mean±SD.
Protocatechuic acid p-Hydroxybenzoic acid Phenolic acids Cinnamic acid a-Tocopherol b-Tocopherol g-Tocopherol Tocopherols ST 0 months 272±104 477±56 749±87 286±72 20±1 41±14 28±3 89±14
6 months 170±83 75±45 245±137 71±7 11±3 35±12 21±6 67±6 12 months 140±56 37±21 176±88 78±10 8±2 20±2 18±4 46±4
p-value (n¼36) <0.001 <0.001 <0.001 <0.001 <0.001 <0.001 <0.001 <0.001 GI 0 kGy 290±84 233±132 523±214 188±95 14±3 21±3 25±3 60±9 2 kGy 136±37 171±121 307±148 132±58 13±6 45±16 18±8 76±26 6 kGy 101±45 198±140 299±185 137±65 15±4 34±12 20±2 69±18 10 kGy 248±77 184±131 431±203 123±42 11±5 27±6 26±4 65±16
p-value (n¼27) <0.001 0.724 <0.001 0.114 0.062 <0.001 <0.001 0.030 STGI p-value (n¼108) <0.001 <0.001 <0.001 <0.001 <0.001 <0.001 <0.001 <0.001
A. Fernandes et al. / Food Control 72 (2017) 328e337
samples for originally grouped cases and cross-validated cases), confirming the strong effect exerted by ST in the studied parame-ters. According to the within-groups correlations between
discriminating variables and standardized canonical discriminant functions (data not shown), function 1, which separated non-stored from stored samples, was mostly correlated top-hydroxybenzoic
(A)
(B)
acid contents and EC50values of reducing power and DPPH scav-enging activity. This result highlights the significant effect of ST in these specific parameters. Concerning the main differences among maintainingB. edulissamples during 6 or 12 months, the variables with highest correlation with function 2 were organic acids, to-copherols, p-hydroxybenzoic acid, reducing power and DPPH. In fact, extending the ST up to 12 months aggravated the decrease in antioxidant activity and in the levels of the previous compounds, leading to the individualization of the corresponding groups.
In the case of GI effect, the three defined functions (Fig. 2B) also included 100% of the observed variance. The selected variables were fat, protein, mannitol, fumaric acid, protocatechuic acid, cin-namic acid,
a-tocopherol,
b-tocopherol,
g-tocopherol, C12:0, C16:1,
C17:1, C18:3n3, C20:0, C20:5n3, C22:0, C23:0, C24:0, DPPH scav-enging activity, reducing power and TBARS formation inhibition, whose association with the defined function allowed the complete individualization of groups corresponding to each of the applied doses (100% of correctly classified samples for originally grouped cases and cross-validated cases). The correlations between discriminating variables and standardized canonical discriminant functions (data not shown), indicated that function 1, which was particularly effective in separating non-irradiated samples and those irradiated with 2 kGy, was more strongly correlated to b-tocopherol, C16:1, C22:0 and C24:0, which tended to be present in higher levels in samples irradiated with the 2 kGy dose. On the other hand, function 2 separated groups corresponding to samples irradiated with 6 and 10 kGy from those irradiated with 2 kGy and non-irradiated. This function was mostly correlated to fat, protein, C18:3n3 and TBARS formation inhibition. Finally, function 3 indi-vidualized samples irradiated with 6 kGy from the ones treated with 10 kGy, being more strongly correlated to fat, mannitol, pro-tocatechuic acid (higher in samples irradiated with 10 kGy), C12:0 and C23:0 (higher in samples irradiated with 6 kGy).In comparison, to the results obtained in the evaluation of ST effect, the parameters with the highest contribution to discriminate the GI doses might be considered as having lower relevance from the biological activity point of view, besides revealing less signifi -cant differences.
7. Conclusions
Overall, storingB. edulisfor the extended periods assayed herein does not seem to be advised. In fact, some relevant changes were detected in samples stored for 6 and 12 months, with more dele-terious effect for the longer period. In addition, the applied GI doses do not seem to be enough to prevent this adverse occurrence, since a relevant decrease in several chemical parameters was also observed in samples submitted to irradiation. Nevertheless, treat-ing samples with gamma irradiation induced a slight improvement in the antioxidant activity and some of the bioactive compounds profiled in this work.
Acknowledgments
The authors are grateful to the Foundation for Science and Technology, COMPETE/QREN/EU - strategic projects PEst-OE/AGR/ UI0690/2014 (CIMO) and PEst-C/EQB/LA0006/2014 (REQUIMTE), FCT/MEC through national funds and co-financed by FEDER, under the Partnership Agreement (PT2020UID/QUI/50006/2013 - POCI/ 01/0145/FERDER/007265). A. Fernandes and J.C.M. Barreira thank FCT for their grants SFRH/BD/76019/2011 and SFRH/BPD/72802/ 2010, respectively.
References
AOAC. (1995).Official methods of analysis(16thed.). Arlington VA, USA: Association of Official Analytical Chemists.
ASTM ISO/ASTM51707-15. (2015).Standard guide for estimation of measurement uncertainty in dosimetry for radiation processing. West Conshohocken, PA: ASTM International. available inhttp://www.astm.org/Standards/ISOASTM51707.htm.
Barros, L., Baptista, P., Correia, D. M., Sa Morais, J., & Ferreira, I. C. F. R. (2007). Effects of conservation treatment and cooking on the chemical composition and antioxidant activity of Portuguese wild edible mushrooms.Journal of Agricul-tural and Food Chemistry, 55, 4781e4788.
Barros, L., Due~nas, M., Ferreira, I. C. F. R., Baptista, P., & Santos-Buelga, C. (2009). Phenolic acids determination by HPLC-DAD-ESI/MS in sixteen different Portu-guese wild mushrooms species.Food and Chemical Toxicology, 47, 1076e1079.
Barros, L., Pereira, C., & Ferreira, I. C. F. R. (2013). Optimized analysis of organic acids in edible mushrooms from Portugal by ultra fast liquid chromatography and photodiode array detection.Food Analytical Methods, 6, 309e316.
Brennan, M., Port, G. L., & Gormley, R. (2000). Post-harvest treatment with citric acid or hydrogen peroxide to extend the shelf life of fresh sliced mushrooms. Lebensmittel-Wissenschaft&Technologie, 33, 285e289.
Brennan, M., Port, G. L., Pulvirenti, A., & Gormley, R. (1999). The effect of sodium metabisulphite on the whiteness and keeping quality of sliced mushrooms. Lebensmittel-Wissenschaft&Technologie, 32, 460e463.
Cliffe-Byrnes, V., & O'Beirne, D. (2008). Effects of washing treatment on microbial and sensory quality of modified atmosphere (MA) packaged fresh sliced mushroom (Agaricus bisporus).Postharvest Biology and Technology, 48, 283e294.
Ehlermann, D. A. E. (2014). Safety of food and beverages: safety of irradiated foods. Encyclopedia of Food Safety, 3, 447e452.
Fernandes, A., Antonio, A. L., Barreira, J. C. M., Oliveira, M. B. P. P., Martins, A., & Ferreira, I. C. F. R. (2013a). Effects of gamma irradiation on physical parameters ofLactarius deliciosuswild edible mushroom.Postharvest Biology and Technol-ogy, 6, 2895e2903.
Fernandes,A., Barreira, J. C. M., Antonio, A. L., Morales, P., F^ ernandez-Ruiz, V., Martins, A., et al. (2015). Exquisite wild mushrooms as a source of dietaryfiber: analysis in electron-beam irradiated samples.LWTeFood Science and Tech-nology, 60, 855e859.
Fernandes,^A., Barreira, J. C. M., Antonio, A. L., Oliveira, M. B. P. P., Martins, A., & Ferreira, I. C. F. R. (2014a). Combined effects of electron-beam irradiation and storage time on the chemical and antioxidant parameters of wildMacrolepiota proceradried samples.Food Bioprocess Technology, 7, 1606e1617.
Fernandes,^A., Barreira, J. C. M., Antonio, A. L., Oliveira, M. B. P. P., Martins, A., & Ferreira, I. C. F. R. (2014b). Feasibility of electron-beam irradiation to preserve wild dried mushrooms: effects on chemical composition and antioxidant ac-tivity.Innovative Food Science and Emerging Technologies, 22, 158e166.
Fernandes, A., Barreira, J. C. M., Antonio, A. L., Santos, P. M. P., Oliveira, M. B. P. P., Martins, A., et al. (2013b). Study of chemical changes and antioxidant activity variation induced by gamma-irradiation on wild mushrooms: comparative study through principal component analysis.Food Research International, 54, 18e25.
Heleno, S. A., Barros, L., Sousa, M. J., Martins, A., & Ferreira, I. C. F. R. (2009). Study and characterization of selected nutrients in wild mushrooms from Portugal by gas chromatography and high performance liquid chromatography. Micro-chemical Journal, 93, 195e199.
Heleno, S. A., Barros, L., Sousa, M. J., Martins, A., & Ferreira, I. C. F. R. (2010). To-copherols composition of Portuguese wild mushrooms with antioxidant ca-pacity.Food Chemistry, 119, 1443e1450.
Heleno, S. A., Barros, L., Sousa, M. J., Martins, A., Santos-Buelga, C., & Ferreira, I. C. F. R. (2011). Targeted metabolites analysis in wildBoletusspecies. LWTeFood Science and Technology, 44, 1343e1348.
Inamura, P. Y., Uehara, V. B., Teixeira, C. A. H. M., & Mastro, N. L. (2012). Mediate gamma radiation effects on some packaged food items.Radiation Physics and Chemistry, 81, 1144e1146.
Iqbal, T., Rodrigues, F. A., Mahajan, P. V., & Kerry, J. P. (2009). Effect of time, tem-perature, and slicing on respiration rate of mushrooms.Journal of Food Science, 74, 298e303.
Jaworska, G., & Bernas, E. (2009). The effect of preliminary processing and period of storage on the quality of frozenBoletus edulis (Bull: Fr.) mushrooms. Food Chemistry, 113, 936e943.
Junqueira, M. S., Soares, N. F. F., Reis, R. C., Carneiro, J. D. S., Benício, R. T., & Yokota, R. C. (2009). Efeito de embalagens ativas no escurecimento enzimatico de batatas (solanum tuberosum) fatiadas e minimamente processadas.Ci^encias Agrarias, Londrina, 30(3), 613e618.
Kim, K. M., Ko, J. A., Lee, J. S., Park, H. J., & Hanna, M. A. (2006). Effect of modified atmosphere packaging on the shelf-life of coated, whole and sliced mushrooms. LWT-Food Science and Technology, 39, 364e371.
Lombra~na, J. I., Rodríguez, R., & Ruiz, U. (2010). Microwave-drying of sliced mush-room. Analysis of temperature control and pressure.Innovative Food Science and Emerging Technologies, 11, 652e660.
Maroco, J. (2003). Analise Estatística, com utilizaç ~ao do SPSS. Lisboa, Portugal: Ediç~oes Sílabo.
Oliveira, F., Sousa-Gallagher, M. J., Mahajan, P. V., & Teixeira, J. A. (2012). Evaluation of MAP engineering design parameters on quality of fresh-sliced mushrooms. Journal of Food Engineering, 108, 507e514.
Simon, A., Gonzalez-Fandos, E., & Vazquez, M. (2010). Effect of washing with citric A. Fernandes et al. / Food Control 72 (2017) 328e337
acid and packaging in modified atmosphere on the sensory and microbiological quality of sliced mushrooms (Agaricus bisporusL.).Food Control, 21, 851e856.
Tsai, S.-Y., Tsai, H.-L., & Mau, J.-L. (2008). Non-volatile taste components ofAgaricus blazei, Agrocybe cylindraceaand Boletus edulis.Food Chemistry, 107, 977e983.
Yilmaz, N., Solmaz, M., Türkekul,_I., & Elmastas¸, M. (2006). Fatty acid composition in some wild edible mushrooms growing in the middle Black Sea region of Turkey.
Food Chemistry, 99, 168e174.