330
THE EFFECTS OF CUSTOMER SATISFACTION, SERVICE QUALITY
AND PERCEIVED VALUE ON BEHAVIOURAL INTENTIONS IN
RETAIL INDUSTRY
Claudia Miranda Veloso
UNIAG; Institute Polytechnic of Bragança; ESTAG; University of Aveiro, Portugal [email protected]; [email protected]
Daniel Margaca Magueta
ESTAG; University of Aveiro, Portugal [email protected]
Paula Odete Fernandes
UNIAG; NECE; Institute Polytechnic of Bragança; Portugal [email protected]
Humberto Ribeiro
GOVCOPP; ESTAG; University of Aveiro, Portugal [email protected]
ABSTRACT
The retail industry has in the last decades assumed a preponderant role in the Portuguese economy, similar to that of other European countries, and is definitely one of the biggest and more vibrant industries nowadays. The significance of the retail industry for the Portuguese economy, a central sector for its growth and dynamic, and the relationship between service quality and efficiency of business are the motivations for this study. In a highly competitive industry, as is the retailing sector, it is crucial that organizations have a good knowledge of the business aspects that are important to their customers. The purpose of this study is to identify the dimensions of service quality and to evaluate the interrelationships among customer satisfaction, perceived value and behavioural intentions and service quality in the modern retail industry. A multi-level and hierarchical model is used as an instrument to synthesize the effects of customer satisfaction, service quality and perceived value on behavioural intentions of customers at retail stores. The results shown that, service perceived quality significantly influences customer satisfaction. Also perceived value and quality service are the main determinants of customer satisfaction. Additionally, customer satisfaction, retail service quality and perceived value significantly affect behavioural intentions towards the act of buying. Keywords: Customer Satisfaction, Perceived Value, Retail Service Quality, Behavioural intentions, Portugal
1. INTRODUCTION
331
The modern retail industry is not indifferent to customer loyalty and satisfaction regarding the service. Although most customers do not immediately associate a commercial surface with a service, the service is one of the main tools in obtaining consumer satisfaction and loyalty (Yuen & Chan, 2010). Retail store must find a way to differentiate itself so it can stand apart from other retailers and drive more consumers to its store. Service quality is one way to accomplish this. Retailers need an efficient way to assess the service quality of their store (Simmers & Keith, Measuring retail store service quality: the disparity between the retail service quality Scale (RSQS) and Comment Cards, 2015). However, the focus on customer retention in this area of business is one of the right strategies to generate profits (Sirohi, McLaughlin, & Wittink, A model of consumer perceptions and store loyalty intentions for a supermarket retailer, 1998). Loyalty is an important step in ensuring that consumers perform something that is beneficial to the firm, whether through purchase or simple word of mouth (WOM). It is believed that satisfaction is a consequence of the quality of the service, and guaranteeing it, increases the likelihood of involving the customer and loyalty. Several studies have shown that there is a positive relationship between quality of service and consumer loyalty (Zaibaf, et al., 2013; Al Khattab & Aldehayyat, 2012; Yuen & Chan, 2010; Mohsin & Lockyer, 2009; Ekinci, et al., 2008). Moreover, in a highly competitive industry, as is the retailing sector, it is critical that organizations have a good knowledge of the business aspects that are important to their customers (Yuen & Chan, 2010). Only with a deep understanding, is it possible to respond positively to the expectations of customers regarding the services offered. In this sense, the main purpose of this paper is to know the effects of customer satisfaction, service quality and perceived value on behavioural intentions in Portuguese modern retail industry. More specifically, this study proposes a conceptual model that allows for the examination of the antecedents and consequences of customer satisfaction, in retailing sector in North of Portugal. Additionally, intend to present a conceptual model is used as a framework to identify the dimensions of service quality and examining the interrelationships among customer satisfaction, value perceived and behavioural intentions and service quality in the modern retail industry. Also, the multi-level and hierarchical model is used as an instrument to synthesize the effects of customer satisfaction, service quality and perceived value on behavioural intentions of customers in modern retail stores. With the purpose of assisting the managers of the modern distribution of the North of Portugal in the pursuit and effectiveness of the competitiveness and sustainability of the modern distribution. In this paper, after this present introduction, a review of the main literature on retail service quality, customer satisfaction, perceived value and their behavioural intention is made, then we propose the conceptual model and research hypotheses, after presented the findings and discussion, ending with the presentation of the conclusion and the contribution of the research.
2. THEORETICAL BACKGROUND 2.1. Service Quality
In these last decades, there has been several research in the area of service quality, and it is discussed lots for the aim that no consensus has been reached thus far on its definition and measurement. Early studies on service quality defined it as a measure to which a service provides customer needs, and implicates a comparison of customer expectations with their perceptions of actual service performance (Parasuraman, et al., 1985; Parasuraman, et al., 1988). Gronroos (1984) definite perceived service quality to be the outcome of consumer expectations of a service and the actual service perceived by them. There are two basic ways to define quality: one from the viewpoint of the service provider and the other from the client’s perspective. The quality from the customer’s perspective is the central objective of this study because it reorients the
retail managers to the customer’s needs. Firstly, it should be noted that the measurement of
332
special prominence after the contribution of various authors (Parasuraman, Zeithaml, & Berry, A conceptual model of service quality and its implications for future research, 1985). These authors, who represent the American school, have designed an instrument for measuring quality of service, called SERVQUAL. Parasuraman, et al., (1988) suggested five dimensions: Tangibles, Reliability, Responsiveness, Assurance and Empathy. SERVQUAL has higher diagnostic power to help managers with practical decision-making. Researcher have advised the customization of existing service quality scales depending on the industry to which they are applied as retail industry (Schneider & White, 2004; Amin, et al., 2013).
2.2. Retail service quality
The retail industry is settled on actions, such as interaction, negotiation, and supplying that make a combination between services and products during the service meeting process (Mahfooz, Relationship between Service Quality and Customer Satisfaction in Hypermarkets of Saudi Arabia, 2014). The retail service combined a mix between services and goods wherefore it is crucial to look at service quality from the angle of services and from the angle of products, and develop a set of items that correctly measure this construct (Mehta, et al., 2000). This creates the service quality in retailing diverse from any other pure product or pure service setting (Finn, 2004; Mehta, et al., 2000; Vazquez, et al., 2001). Service quality in retail industry has a hierarchical structure with five dimensions: physical aspects, reliability, personal interaction, problem solving, and policy (Dabholkar, Thorpe, & Rentz, A measure of service quality for retail stores: Scale development and validation, 1996). According to Dabholkar, et al. (1996) the Physical Aspects dimension has a wider meaning than does the tangibles dimension of the SERVQUAL. The Reliability dimension is similar to the both scales, SERVQUAL reliability
dimension and includes the store’s ability to keep promises and do things right. The dimension
of personal interaction dimension is a combination of the SERVQUAL dimensions of responsiveness and assurance. Problem Solving evaluate the store’s ability to handle possible
problems like discards, commercial exchanges and complaints. The Policy is aspects of service quality that are directly influenced by store policy. For the final version of RSQS, 17 items were adapted from SERVQUAL scale and 11 items were created based on literature review and research conducted by (Dabholkar, Thorpe, & Rentz, A measure of service quality for retail stores: Scale development and validation, 1996). The total items in the RSQS scale were 28, which included 6 for physical aspects, 5 for reliability, 9 for personal interaction, 3 for problem solving, and 5 for policy. However the scale offered by Dabholkar, et al. (1996) has a great construct reliability and validity, was tested and was applied in different regions and countries of the world, requires that in its application be adjusted to the reality of each country, because each environment have its particular single set of quality dimensions (Amin, et al., 2013). Therefore, this scale is adopted in this study.
2.3. Perceived Value
Nowadays the retailers are more worried with the pricing strategy attached the effectiveness and the competitiveness of the market. A broad pricing model is largely a crucial requirement for achieving a unique corporate success, this argument has been supported by many researchers as Ailawadi & Keller (2004). These authors proved that the application of a pricing strategy improves the volume of sales and profit margin. Also, the study developed by Hinz, et al. (2011) showed up to 20% rise in revenue due to the execution of a price setting, thus strengthening customers’ satisfaction and loyalty. According to Matzler, et al. (2006) the pricing strategy is a
main determinant to strengthen and improve the customers’ satisfaction and loyalty, indeed in
333
a suitable pricing model and a favourable perceived value positively strengthen the business’s
global success in the retail industry (Nikhashemi S. R., Paim, Sidin, M., & A., 2014). Some research have also related that perceived value variation has beyond the close relationship with
quality service adopts a significant relationship with product delivery and customers’
expectations and loyalty (Hellstrand, 2010). Several authors have also found numerous perceived value influences on quality service. This does not mean that the perceived value will have be low to exist satisfaction, but that the value perceived by the customer will take into account the received and its relationship with the price paid. Previous studies on goods have showed that the perceived value relationship was considered enough important for customer satisfaction (Qin & Prybutok, 2008).
2.4. Customer satisfaction
Customer satisfaction is the outcome of the customer’s perception of the value received in a
transaction or relationships, where value equals perceived service quality, compared to the value expected from transactions or relationships with competing vendors (Zeithaml, et al., 1990).
Several studies have reported that customers’ satisfaction is a crucial requirement for the achievement of customers’ loyalty (Cronin, et al., 2000; Sivadas & Baker-Prewitt, 2000 Zeithaml, et al., 1996). Customer satisfaction is a mighty immaterial asset like to service quality and can be attained through the compliance of customer expectations (Homburg, et al., 2006; Jayasankaraprasad & Kumar, 2012). More value for customer incomes great satisfaction, which can benefit the retail enterprise in the long term (Zeithaml, et al., 1996; Cronin, et al., 2000) and generate higher profits. Customer satisfaction is found to be dependent on the quality of service presented to the customer and is one of the instruments to enhancedvalue for customers (Sivadas & Baker-Prewitt, 2000). The major challenges for service industry are service quality and customer satisfaction (Hung, et al., 2003). As Valdani (2009) points out, enterprises exist because they have a customer to serve. The key to customer satisfaction lies in identifying and anticipating customer needs and especially in being able to satisfy them. Enterprises which are able to rapidly understand and to satisfy customers’ needs, make greater profits than those which fail to understand and satisfy them (Dominici & Guzzo, 2010). On the other hand Bennett & Rundle-Thiele, 2002, argued that for customers to escalate their loyalty, their perceived value of the good or service presented need be at par with reality, forming an integral part of the corporate
aims of the organization. Additionally, Sirdeshmukh, et al. (2002) reported that customers’
satisfaction has close relationship to brand loyalty as well as service quality. Analogous claim is presented by Hoq and Amin (2010) who postulated that customer satisfaction is the emotional tendency of a customer towards repurchase of products and services offered by a retail store. In order to be successful, especially in the retail industry, managers must concentrate on retaining existing customers by implementing effective strategies towards customer satisfaction and loyalty, since the cost of attracting new customers is higher than the cost of retaining existing ones (Dominici & Guzzo, 2010).
2.5. Behavioural Intentions
334
Chan, 2010). Service providers are increasingly developing loyalty, as they consider that it helps to rise income, and leads to largest market share, effectiveness and profitability. In this sense,
behavioural intentions can be defined as the customer’s judgment about the likeliness to
repurchase in this firm or the willingness to recommend the firm to others. We conceptualize behavioural intentions as a higher-order construct consisting of (1) positive word of mouth, (2) willingness to recommend, and (3) intentions to continue buying from a particular service provider. Based on previous definition, behavioural intention in this study may be described as a stated likelihood to repurchase in a retail store in the North of Portugal and to recommend it to family, friends and others in the future. Research has established the many benefits of behavioural intention, such as making it a tendency for retailers to follow, as well as developing and maintaining a loyal customer base (Yuen & Chan, 2010). There is also ample evidence of the influence of service quality on behavioural intentions, a huge body of research has demonstrated the significant relationship between service quality and customers’ behavioural intentions (Parasuraman, et al., 2005). Zeithaml, et al. (1996) compiled a list of specific positive behavioural intentions, included loyalty, switching intentions, willingness to pay more, external response, and internal response. Zeithaml, et al. (1996) and Fullerton (2005) find a positive relationship between service quality and behavioural intentions. Moreover, preceding research has demonstrated associations between service quality and particular dimensions of behavioural intentions, like as Parasuraman, et al. (1988) find a favourable relationship between service quality and willingness to recommend the firm, and Boulding, et al. (1993) find a positive correlation between service quality and repurchase intentions, saying positive things, and willingness to recommend. Several authors point out that customers may not necessarily buy the greater quality service and that there may be other factors that define consumer choice, such as satisfaction Wang, et al. (2004) and Ryu & Han (2010). Therefore, we expect customers who perceive the quality of the service as high to be more likely to demonstrate intentions, and we again believe that this relationship will hold regardless of the buyers’ collectivist orientation.
Loyal customers are main assets to firms, they make proportionally more purchases at their’ first choice’ store than customers who shift. It is supposed that positive perceptions of service quality
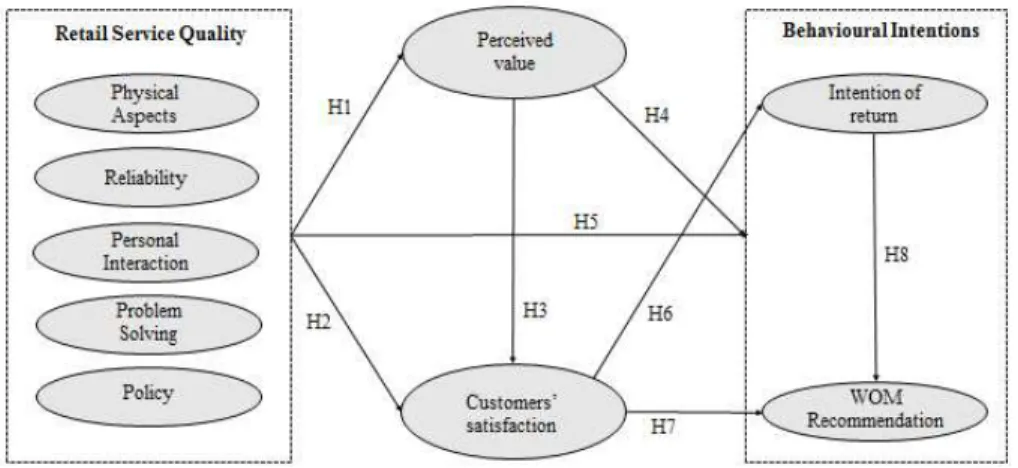
enhances the possibility of customers being dedicated in supporting the company and developing and strengthening loyalty behaviour (Yuen & Chan, 2010). According to this theoretical background, the aim of this study is to, as Error! Reference source not found. indicates, propose a model that consists of five major constructs: Retail Service Quality, Customer Satisfaction, Value Perceived and two Levels of Behavioural Intentions (Intention to return and WOM recommendation), as illustrated in Error! Reference source not found..
335
The proposed model consists on evaluating the impact of: (1) Retail Service Quality on Customer Satisfaction and Value Perceived; (2) Value Perceived on Customer Satisfaction; (3) Value Perceived on Customer Satisfaction on behavioural intentions (intention to return and WOM recommendation); (4), Value Perceived and satisfaction value on behavioural intentions (intention to return and WOM recommendation) and (5) Intention to Return on WOM recommendation. In line with this aims the following researches hypotheses are proposed in the present study (see table 1).
Hypotheses Preposition
H1 The perceived service quality by the customers has a positive influence on their satisfaction
H2 The perceived service quality by the customers has a positive influence on the perceived
value
H3 The value perceived by the customers has a positive influence on their satisfaction
H4 The value perceived by the customers has a positive influence on behavioural intentional
H5 Service quality has a positive effect on customer behavioural intentions
H6 Customer satisfaction positively influences intention to return
H7 Customer satisfaction positively influences WOM recommendations.
H8 Intention to return positively influences WOM recommendations
Table 1. - Research hyphotesis
3. RESEARCH METHODOLOGY
A questionnaire was designed which comprise all the constructs of the proposed model, and used to study the researches hypotheses. The questions in the questionnaire were based on a review of the literature in the area of the retail industry. This study was applied to retail stores customers in the north of Portugal during the month of February, 2017. It was used a non-probabilistic sampling using convenience technique. The questionnaires were distributed online and the answers came from several cities and places of the north of Portugal. In this study, respondents were required to fill out a three-page three sections. The first section consisted of a standard demographic profile of respondents. The second section contained the characterization of purchase process. The last section includes the statements of dimensions and their sub dimensions. The measurement items to measure primary and sub-dimensions of service quality were adapted from several researchers (Chen, et al., 2011; Clemes, et al., 2011; Dabholkar, et al., 1996; Wu, et al., 2011) and a series of items focusing on the behavioural intentions, customer satisfaction, perceived value and service quality, which were adapted on the basis of several
researchers’ results (Brady & Cronin, 2001; Zeithaml, et al., 1996; Wu, 2013). Respondents
were asked to use a five-point Likert scale (1 = “strongly disagree” until 5 = “strongly agree”)
to record their perceptions. Construct reliability was assessed by using the Cronbach’s alpha
coefficient. Reliabilities ranged from 0,717 to 0,955, suggesting that the construct could be used with confidence. For the descriptive analysis it was used absolute and relative frequency tables. In order to measure the intensity of the linear correlation between variables it was used the Spearman correlation coefficient. Multiple linear regression was used in order to estimate models that could identify the determinants of the behaviour of the variables under analysis. The significance level of 5% was used.
4. DATA ANALYSIS AND FINDINGS 4.1. Demographic Profile
336
It is verified most of respondents had higher education qualifications, as 41.7% (90) were graduates. As for the professional occupation mostly, 71.8% (155) were employees. In the activity sector, banking stood out with 41.2% (89) of the respondents, followed by health with 11.1% (24) of the individuals. Regarding the average annual income, it is observed that 30.6%
(66) annually earn between 40 001€ to 80 000€.
4.2. Purchase Process
The most popular commercial area among respondents is Continente with 56.5% (122) of the individuals claiming that it is the store where they buy, followed by Pingo Doce with 26.4% (57) of the registers. The remaining chains have few costumers, the highest is Lidl with 14. It was verified that 94.4% (204) of the respondents made purchases in those stores from longer than 12 months. The most popular frequency of purchases registered was weekly, 75.9% (164) of the respondents go to the store once a week and 22.2% (48) do it monthly. Regarding the monthly spending average on purchases, it was found that 29.6% (64) of the respondents spend between
76€ to 150€ and 40.3% (87) spend more than 151€ per month.
4.3. Correlation and Regression Analyses
In the Table 2, it can be verified that the dimensions that constitute the RSQ have strong correlations and in the direct sense with the RSQ, namely the personal interaction dimension and the reliability dimension with very strong coefficient of correlation.
Dimensions Retail Service Quality
Physical Aspects 0,863
Reliability 0,881
Personal Interaction 0,911
Problem Solving 0,764
Policy 0,822
Table 2. - Spearman correlation between RSQ and its constituent dimensions
The correlation coefficients between the sub-dimensions and their dimensions are strong or very strong in each situation. Namely the sub-dimension appearance with the physical aspects dimension (r = 0.928); Doing it right with reliability (r = 0.972); Courteousness/helpfulness with personal interaction (r = 0.948) and intention to return with customer loyalty (r = 0.953). From the analysis of 4, it can be concluded that all the dimensions of the scale have statistically significant coefficients of correlation and in the direct sense. The intensity of the relationship between RSQ versus price; RSQ versus customer loyalty; Customer satisfaction versus price is moderate and among other combinations the correlation is strong (see 0).
Retail Service Quality
Customer Satisfaction
Perceived Value
Customer Loyalty
Retail Service Quality 1 0,774** 0,540** 0,661**
Customer Satisfaction 1 0,657** 0,755**
Perceived Value 1 0,754**
Customer Loyalty 1
337
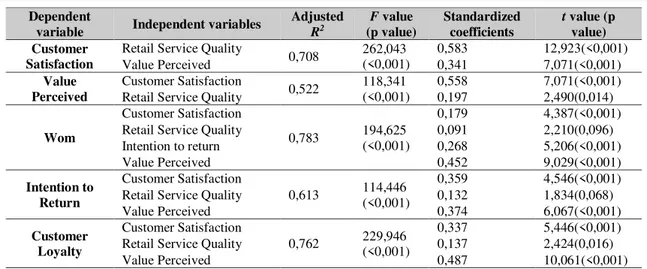
Ordinary least squares regression was used to analyse each path in the conceptual model. Statistical assumption tests were assessed for each of the five regression models prior to the analysis in order to ensure a robust result. Numerous researchers propose that a multi-level and hierarchical model of service quality must be measured-based multiple regression analysis (Chen, et al., 2011, Wu, 2013; Wu, et al., 2011). The results of the hypotheses tests are presented in Error! Reference source not found.. In the first regression model which tests the influence of retail service quality and perceived value on the variation of customer satisfaction is tested.
The model obtained is at a statistically significant level of significance of 1% (F = 262,043; p-value <0,001), that is, the variation of customer satisfaction is explained significantly by the
estimated model. By the application of the test t, we conclude that retail service quality (β =
0,583; p-value < 0,001) and value perceived (β = 0,341; p-value <0,001) determine significantly the behaviour of customer satisfaction. The adjusted coefficient of determination reveals that the model presented explains, on average, about 70,8% of the variation of customer satisfaction. Consequently, this model supports the first and third hypothesis.
The second regression model, that relates perceived value to the customer satisfaction and retail service quality, is statistically significant at a 1% level. The determinants of the model that significantly influence the variance of perceived value were the customer satisfaction with
coefficient β = 0,558 and p-value <0,001 and retail service quality with coefficient β = 0,197 and p-value <0,05. The estimated model explains, on average, about 52,2% of the variance of perceived value. Consequently, this model supports the second hypothesis. The third regression model that relates Wom with the regressors: customer satisfaction, retail service quality, perceived value and intention to return is at a significance level of 1% statistically significant. The determinants of the model influenced significantly the variation of Wom, as the test t,
customer satisfaction with coefficient β = 0,179 and p-value <0,001; intention to return with
coefficient β = 0,268 and p-value <0,001; perceived value with coefficient β = 0,452 and p-value <0,001; are statistically significant. The estimated model explains, on average, about 78,3% of the Wom variation.
The retail service quality regressor is not presented significantly in the variation of Wom. Thus, this model supports the seventh and the octave hypothesis. In the fourth regression model that relates intention to return with the regressors: customer satisfaction, retail service quality and perceived value is at a significance level of 1% statistically significant. The determinants of the model that significantly influence the variation of intention to return are: customer satisfaction
with coefficient β = 0,359 and p-value <0,001 and perceived value with coefficient β = 0,374 and p-value <0,001; the retail service quality regressor was not statistically significant. The estimated model explains, on average, about 61,3% of the variation of intention to return. So, this model supports the sixth hypothesis. The fifth regression model that relates behavioural intentions with the regressors: customer satisfaction, retail service quality and perceived value is at a significance level of 1% statistically significant.
The determinants of the model influence significantly the variation of behavioural intentions,
because by the test t customer satisfaction with coefficient β = 0,337 and p-value <0,001; retail
338
Dependent
variable Independent variables
Adjusted R2 F value (p value) Standardized coefficients
t value (p value) Customer
Satisfaction
Retail Service Quality
0,708 262,043
(<0,001)
0,583 12,923(<0,001)
Value Perceived 0,341 7,071(<0,001)
Value Perceived
Customer Satisfaction
0,522 118,341
(<0,001)
0,558 7,071(<0,001)
Retail Service Quality 0,197 2,490(0,014)
Wom
Customer Satisfaction
0,783 194,625
(<0,001)
0,179 4,387(<0,001)
Retail Service Quality 0,091 2,210(0,096)
Intention to return 0,268 5,206(<0,001)
Value Perceived 0,452 9,029(<0,001)
Intention to Return
Customer Satisfaction
0,613 114,446
(<0,001)
0,359 4,546(<0,001)
Retail Service Quality 0,132 1,834(0,068)
Value Perceived 0,374 6,067(<0,001)
Customer Loyalty
Customer Satisfaction
0,762 229,946
(<0,001)
0,337 5,446(<0,001)
Retail Service Quality 0,137 2,424(0,016)
Value Perceived 0,487 10,061(<0,001)
Table 4. -A summary of regression models
5. DISCUSSION AND CONCLUSION
The objective of this study was to identify the dimensions of service quality and examining the interrelationships among customer satisfaction, perceived value and behavioural intentions and service quality in the modern retail industry, in additionally to investigate the effect of customer satisfaction, service quality and perceived value on behavioural intentions of customers in the modern retail stores in the North of Portugal. The results from exploratory factor analysis indicate that service quality consists of five dimensions (physical aspects, reliability, personal interaction, problem solving, and policy). For stores in the North of Portugal, personal interaction plays an important role in determining service quality, and are followed by reliability, physical aspects, policy and problem solving. The results of this study add support to using a multi-level and hierarchical model as a framework in order to conceptualize and measure the customer perception of service quality, perceived value, customer satisfaction and behavioural intentions in the modern retail stores. This methodological approach is similar to that used by some researchers, mentioned in the theoretical background to analyse those constructs in other service industries. The results of this study demonstrate that service quality has a direct influence on
customers’ perceptions of value, which in turn, influence satisfaction. Increased perceived value
339
The present research identifies five primary dimensions of service quality in the retailing industry in the north of Portugal. For example, management can use the information from this study to improve their understanding of the factors that create a pleasant purchasing experience
and act to increase customers’ favourable behavioural intentions. Furthermore, the customers who return or revisit a specific retail store can help management to establish a good reputation through the positive word-of-mouth. In addition, retail management should know and resource the customer-important sub-dimensions to improve their supermarkets’ competitiveness in this lucrative market, as the sub-dimensions are similar to the benefit bundle. This information will
enable management to accurately measure customers’ perceptions of their overall experiences
in the retailing industry. Therefore, management should realize that service quality in the retailing industry definitely influences customers’ future favourable behavioural intentions through satisfaction and perceived value. As observed in this research, the main purpose was studied the relationships among higher order constructs such as behavioural intentions, customer satisfaction, perceived value, and service quality in modern retail industry in the north of Portugal. Nevertheless, the interrelationships among these constructs and their supporting dimensional structures have not attracted a lot of attention in the retailing literature of Portugal.
The findings in this study show that improving customers’ perceptions of service quality can
effectively increase satisfaction levels through high levels of value perceived. Thus, the findings of this investigation help retailing management to identify that both customer satisfaction and value perceived directly affect behavioural intentions. Consequently, retail management should make more effort to increase perceptions of satisfaction and value perceived in order to build the
favourable customers’ behavioural intentions.
ACKNOWLEDGMENT: The preparation of the paper was supported by FCT - Portuguese Foundation for the Development of Science and Technology, Ministry of Science, Technology
and Higher Education; “Project Code Reference UID/GES/4752/2016”
LITERATURE:
1. Ailawadi, K. & Keller, K. (2004). Understanding retail branding: conceptual insights and research priorities. Journal of Retailing, Volume 80(4), pp. 331-342.
2. Al Khattab, S. A. & Aldehayyat, J. S. (2012). Perceptions of Service Quality in Jordanian Hotels. International Journal of Business and Management, Volume 6(7), pp. 226-233. 3. Amin, M. et al. (2013). Service quality dimension and customer satisfaction: An empirical
study in the Malaysian Hotel Industry. Services Marketing Quarterly, Volume 34(2), pp. 115-125.
4. Bennett, R. & Rundle-Thiele, S. (2002). A comparison of attitudinal loyalty measurement approaches. The Journal of Brand Management, Volume 9(3), pp. 193-209.
5. Boulding, W., Kalra, A., Staelin, R. & Zaithaml, V. A. (1993). A dynamic process model of service quality: From expectations to behavioral intentions. Journal of Marketing Research, Volume 30(1), pp. 7-27.
6. Brady, M. & Cronin, J. (2001). Some new thoughts on conceptualizing perceived service quality: a hierarchical approach. Journal of Marketing, Volume 65(3), pp. 34-49.
7. Caruana, A., Money, A. & Berthon, P. (2000). Service quality and satisfaction: the moderating role of value. European Journal of Marketing, Volume 34(11/12), pp. 1338-1353.
340
9. Clemes, M., Gan, C. & Ren, M. (2011). Synthesizing the effects of service quality, value and customer satisfaction on behavioral intentions in the motel industry: an empirical analysis. Journal of Hospitality & Tourism Research, Volume 35(4), pp. 530-568.
10.Cronin, J. J., Brady, M. K. & Hult, G. T. M. (2000). Assessing the effects of quality, value, and customer satisfaction on consumer behavioral intentions in service environments.
Journal of Retailing, Volume 76(2), pp. 193-218.
11.Cronin, J. J. J. & Taylor, S. A. (1994). SERVPERF versus SERVQUAL: Reconciling performance-based and perceptions-minus-expectations measurement of service quality.
Journal of Marketing, Volume 58, pp. 125-131.
12.Dabholkar, P., Shepherd, C. & Thorpe, D. (2000). A comprehensive framework for service quality: An investigation of critical conceptual and measurement issues through a longitudinal study. Journal of Retailing, Volume 76(2), pp. 139-173.
13.Dabholkar, P., Thorpe, D. I. & Rentz, J. O. (1996.) A measure of service quality for retail stores: Scale development and validation. Journal of the Academy of Marketing Science, Volume 24(1), pp. 3-16.
14.Das, A., Kumar, V. & Saha, G. C. (2010). Retail service quality in context of CIS countries.
International Journal of Quality & Realibility Management,, Volume 27(6), pp. 658-683. 15.Dominici, G. & Guzzo, R. (2010). Customer satisfaction in the hotel industry: a case study
from Sicily. International Journal of Marketing Studies, Volume 2(2), pp. 3-12.
16.Ekinci, Y., Dawes, P. & Massey, G. (2008). An extended model of the antecedents and consequences of consumer satisfaction for hospitality service. European Journal of Marketing, Volume 42(1/2), pp. 33-68.
17.Finn, A. (2004). A reassessment of the dimensionality of retail performance: A multivariate generalizability theory perspective. Journal of Retailing and Consumer Services, Volume 11(4), pp. 235-245.
18.Fullerton, G. (2005). The impact of brand commitment on loyalty to retail service brands.
Canadian Journal of Administrative Sciences, Volume 22(2), pp. 97-110.
19.Gronroos, C. (1984). A service quality model and its marketing implications. European Journal of Marketing, Volume 18(4), pp. 36-44.
20.Hellstrand, P. (2010). Price Impact on Guest Satisfaction: SQ Insight Hospitality Consulting. Sherman Oaks: s.n.
21.Hinz, O., Hann, I. & Spann, M. (2011). Price discrimination in E-commerce? an examination of dynamic pricing in name-your-own price markets. MIS Quarterly, Volume 35-1, pp. 81-98.
22.Homburg, C., Koschate, N. & Hoyer, W. D. (2006). The role of cognition and affect in the formation of customer satisfaction: A dynamic perspective. A dynamic perspective. Journal of Marketing, Volume 70(3), pp. 21-31.
23.Hoq, M. Z. & Amin, M. (2010). The role of customer satisfaction to enhance customer loyalty. African Journal of Business Management, Volume 4(12), pp. 2385-2392.
24.Hung, Y. H., Huang, M. L. & Chen, K. S. (2003). Service quality evaluation by service quality performance matrix. Total Quality Management and Business Excellence, Volume 14(1), pp. 79-89.
25.Jayasankaraprasad, C. & Kumar, P. V. V. (2012). Antecedents and consequences of customer satisfaction in food & grocery retailing: An empirical analysis. Decision, Volume 39(3), pp. 101-140.
341
27.Matzler, K., Bidmon, S. & Grabner-Kräuter, S. (2006). Individual determinants of brand affect: the role of the personality traits of extraversion and openness to experience. Journal of Product & Brand Management, Volume 15(7), pp. 427-434.
28.Mehta, S., Lalwani, A. K. & Han, S. L. (2000). Service quality in retailing: Relative efficiency of alternative measurement scales for different product-service environments.
International Journal of Retail and Distribution Management, Volume 28(2), pp. 62-72. 29.Mohsin, A. & Lockyer, T. (2009). Consumer perceptions of service quality in luxury hotels
in New Delhi, India: a exploratory study. International Journa of Contemporary Hospitality Management, Volume 22(2), pp. 160-173.
30.Nikhashemi, S. R. et al. (2014). Driving Forces of Hypermarket’s Customer Loyalty: An Empirical Study in Malaysia. Australian Journal of Basic and Applied Sciences, Volume 8(3), pp. 377-386.
31.Parasuraman, A., Zeithaml, V. & Berry, L. (1985). A conceptual model of service quality and its implications for future research. Journal of Marketing, Volume 49(1), pp. 41-50. 32.Parasuraman, A., Zeithaml, V. & Berry, L. (1988). SERVQUAL: A multiple-item scale for
measuring consumer perceptions of service quality. Journal of Retailing, Volume 64(1), pp. 12-40.
33.Parasuraman, A., Zeithaml, V. & Malhorta, A. (2005). E-S-QUAL: a multiple-item scale for assessing electronic service quality. Journal of Retailing, Volume 64(1), pp. 12-40. 34.Qin, H. & Prybutok, V. (2008). Determinants of customer-perceived service quality in fast
food restaurants (FFRs) and their relationship to customer satisfaction and behavioural intentions. Quality Management Journal, 15(2), 35-50., Volume 15(2), pp. 35-50.
35.Ryu, K. & Han, H. (2010). Influence of the quality of food, service, and physical environment on customer satisfaction and behavioural intention in quick-casual restaurants: moderating role of perceived price. Journal of Hospitality & Tourism Research, Volume 34(3), pp. 310-329.
36.Schneider, B. & White, S. (2004). Service Quality: Research Perspectives. London: Sage Publications.
37.Simmers, C. & Keith, N. (2015). Measuring retail store service quality: the disparity between the retail service quality Scale (RSQS) and Comment Cards. International Academy of Marketing Studies Journal, Volume 19(2), pp. 117-126.
38.Sirdeshmukh, D., Singh, J. & B., S. (2002). Consumer trust, value, and loyalty in relational exchanges. The Journal of Marketing, Volume 66 (January), pp. 15-37.
39.Sirohi, N., McLaughlin, E. W. & Wittink, D. R. (1998). A model of consumer perceptions and store loyalty intentions for a supermarket retailer. Journal of Retailing, Volume 74(2), pp. 223-245.
40.Sivadas, E. & Baker-Prewitt, J. (2000). An examination of the relationship between service quality, customer satisfaction, and store loyalty. International Journal of Retail & Distribution Management, Volume 28(2), pp. 73-82.
41.Sumaedi, S., Bakti, I. & Yarmen, M. (2012). The empirical study of public transport
passengers’ behavioral intentions: the roles of service quality, perceived sacrifice, perceived
value, and satisfaction (case study: paratransit passengers in jakarta, indonesia).
International Journal for Traffic and Transport Engineering, Volume 2(1), pp. 83-97. 42.Valdani, E. (2009). Cliente & Service Management. Milan: Egea.
43.Vazquez, R., Rodriguez-Del Bosque, I., Diaz, A. & Ruiz, A. (2001). Service quality in supermarket retailing: Identifying critical service experiences. Journal of Retailing and Consumer Services, Volume 8, pp. 1-14.
342
45.Wu, H. (2013). An empirical study of the effects of service quality, perceived value, corporate image and customer satisfaction on behavioral intentions in the Taiwan quick service restaurant industry. Journal of Quality Assurance in Hospitality & Tourism, Volume 14(4), pp. 364-390.
46.Wu, H. & Cheng, C. (2013). A multi-dimensional and hierarchical model of service quality in the airline industry. Journal of Hospitality and TourismManagement, Volume 20(1), pp. 13-22.
47.Wu, H. & Ko, Y. (2013). Assessment of service quality in the hotel industry. Journal of Quality Assurance in Hospitality & Tourism, Volume 14(3), pp. 218-244.
48.Wu, J., Lin, Y. & Hsu, F. (2011). An empirical analysis of synthesizing the effects of service quality, perceived value, corporate image and customer satisfaction on behavioral intentions in the transport industry: a case of Taiwan high-speed rail. Innovative Marketing, Volume 7(3), pp. 80-100.
49.Yuen, E. F. & Chan, S. S. (2010). The Effect of Retail Service Quality and Product Quality on Customer. Journal of Database Marketing & Customer Strategy Management, Volume 17(3), 222-240.
50.Zaibaf, M., Taherikia, F. & Fakharian, M. (2013). Effect of perceived service quality on
costumer satisfaction in hospitality industry: Gronroos’ service quality model development. Journal of Hospitality Marketing & Management, Volume 22(5), pp. 409-504.
51.Zeithaml, V., Berry, L. & Parasurama, A. (1996). The behavioral consequences of service quality. Journal of Marketing, Volume 60(2), pp. 31-46.