An Approach for Customer Satisfaction:
Evaluation, Validation and Modeling By A
Markov Chain
Amina EL KEBBAJDepartment of Mathematics and Computer Science, Hassan2-MohammediaUniversity, Casablanca, Morocco Email: [email protected]
Abdelwahed NAMIR
Department of Mathematics and Computer Science, Hassan2-MohammediaUniversity, Casablanca, Morocco Email: [email protected]
---ABSTRACT--- The main objective of this work is to develop a practical approach to improve customer satisfaction, which is generally regarded as the pillar of customer loyalty to the company. Today, customer satisfaction is a major challenge. In fact, listening to the customer, anticipating and properly managing his claims are stone keys and fundamental values for the company. From a perspective of the quality of the product, skills, and mostly, the service provided to the customer, it is essential for organizations to differentiate themselves, especially in a more competitive world, in order to ensure a higher level of customer satisfaction. Ignoring or not taking into account customer satisfaction can have harmful consequences on both the economic performances and the organization’s image. For that, it is crucial to develop new methods and have new approaches to the problematic customer dissatisfaction, by improving the services quality provided to the costumer. This work describes a simple and practical approach for modeling customer satisfaction for organizations in order to reduce the level of dissatisfaction using the decisional prediction that allows companies to anticipate and adapt to future changes in their environment to be able to make the best decisions to ensure their sustainability. This approach respects the constraints of the organization and eliminates any action that can lead to loss of customers and degradation of the image of the organization. The problem is mathematically modeled by a Markov chain and practical examples to illustrate the work are given.
Keywords -Approach, Khi2 test, Markov Chain, Satisfaction, Test of homogeneity.
--- Date of Submission: November 17, 2014 Date of Acceptance: December 29, 2014 ---
1. INTRODUCTION
D
oes the company have the most meaningful information at the right time to make the best possiblebusiness decisions?” is the question most companies want to answer. “The purpose of a company is to create and
keep a customer (Levitt, 1960)”: through this declaration,
the important phases of the life cycle of the customer management, which are acquiring costumers and ensuring their loyalty are clearly identified. Companies are moving
towards “customer oriented” management and focus on
the life cycle of their customers. The companies have complex data that will be analyzed to predict future changes following the past and present activities. The problem addressed consists in verifying that satisfaction can be modeled by a Markov chain. This is to anticipate the real; in this case we consider the data that gives predictions depend on the confidence that gives the vector used. Confidence resulting from a degree of probability because it is difficult for a company to fairly test what the future holds, the uncertainty is always present in the case of an unexpected change in the company. [6] A dashboard, in order to be an effective management tool, must give a comprehensive image of the status of the company, of a service, of a project at the right time. This is a
retrospective tool: I look back to see what we have achieved in the present, therefore, the present is a clear and distinct vision of the past, so it is sufficient to look at the present to predict the future. And it is also a prospective tool: strong on this information, I look forward where I project my company / department / project. In our case we will use an approach to maximize customer satisfaction and if it leads we will see an increase in the satisfaction in the dashboard, more the approach succeeded more the satisfaction is maximized and so more only the present allow us to predict the future.
This work is situated in this spirit; it consists to model customer satisfaction of the company using decision
prediction. It’s to provide a technique that is based on the
properties of Markov in order to measure customer satisfaction to conduct corrective actions based on two dimensions of quality:
The "perceived" quality : what level of satisfaction generated from the customer? It is defined by excellence of the product (Zeithaml, 1988). [2] [1] The ultimate goal is to have =
2.
PROPOSED APPROACH
2.1. STATEMENT
The customer satisfaction is not always reached. Within the company, quality is increasingly focused on customer satisfaction. To win contracts, business leaders rely more on quality than price advantages. Staff involvement, with listening to the customer, is a key element for the success of a quality approach.
Below the 6 best practices for customer satisfaction: a. To develop team’s skills: do additional training on IT
tools to mount the team’s skills.
b. To make customer satisfaction a challenge for all the company: the company can use the dissatisfaction of their customers to improve our products and services. Bill Gates, Microsoft CEO, said that "the unhappy customers are the best sources of information."[5] Because the customers who express dissatisfaction enable companies to identify and resolve defects services faster. Dissatisfied customers are very expensive for companies, the cost of recruiting a new customer is usually five times higher than the cost of acquired customer retention[3]. It is far better to work to keep its customers than to hire new ones to replace those who leave.
c. To motivate teams: to mark clearly the importance of customer satisfaction, some companies have introduced a variable part in pay for some employees, calculated on the basis of indicators related to customer satisfaction.
d. To facilitate contacts customers: there are 4 types of communications channels:
Phone: Availability (24/24 7/7), Saving time ;
Face to face: Immediate Response, Human Contact ;
E-mail: Traceability (written proof) ;
Website: simplicity;
e. To anticipate the dissatisfaction : Whatever the quality of claims processing, it may be better to move this claim and make a gesture to customers who had a bad experience product - or where this risk exists - without waiting for them to occur.
f. To measure customer satisfaction (evaluate to improve): today it is essential to regularly assess the level of achievement of the final goal of customer satisfaction. For example by sending to all customers who have experienced dissatisfaction after the close of the case, a satisfaction survey designed by the customer service and measuring the accessibility of the service, reception, understanding and treatment of dissatisfaction.
2.2. EVALUATION AND VALIDATION OF THE APPROACH
We consider the case of a service company that manages the work of many potential customers as "France Gas". the latter signed a contract with the host company specifying the clauses that must be respected and among the latter is the rate of customer satisfaction which should reach 90% and this percentage is established post-agreement between two parties, and if that percentage is not met, a penalty will be done due to customer dissatisfaction. A development team of the host company supports the realization of applications for "France Gas". This team should produce 23 applications monthly with the dissatisfaction rate should not exceed 10% (2 applications per month). The cause of client dissatisfaction is due to the following:
Application does not answer the need or generate unexpected errors after delivery
Timeout
To avoid these situations, companies have an interest in implementing continuous improvement process which ultimate goal is the elimination of all forms of waste, such as customer dissatisfaction. The problem to be solved is, for period, to maximize the number of satisfied customers. To evaluate the approach we will need to test it in a sample for evaluation and validation.
We start by making our Statistical hypothesis � and �). The first- the null hypothesis
�
: "
="
Qr: the proportion of customer satisfaction desired.
: the real percentages of satisfaction.
The second, the alternative hypothesis �
: "
< "2.2.1. BEFORE THE APPROACH
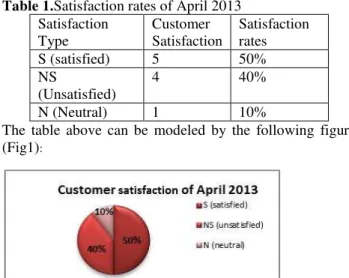
Example1: April 2013: The team was unable to process only 10 simple applications. The customer sent feedback to present his degree of satisfaction. There are 3 kinds of response: NS (Not Satisfied, S: Satisfied, N: Neutral) as described below in table 1.
Table 1.Satisfaction rates of April 2013 Satisfaction
Type
Customer Satisfaction
Satisfaction rates
S (satisfied) 5 50%
NS
(Unsatisfied)
4 40%
N (Neutral) 1 10%
The table above can be modeled by the following figure (Fig1):
� = P(� = S) = .
�� � = P(� = NS) = . and � � = P(� = N) = .
As = % , the hypothesis � : " = " and �: " < " we can use one-tailed left test. if p− r
√Qr −Qrn > −�′ so we accept the hypothesis� and we reject � with error risk α =5%.
“t” is calculated using the table of the normal distribution:
−�α≤ T ≤ �α =1-α = 0.95 =>�α =
. using the table of Student distribution. We have = % and from the example f=50%
f − Qr
√ r − r =
. − . √ . − .
= − .. = − . < − .
So we reject the hypothesis �: " = " and we accept� : " < " with error risk α= %. And the observed difference is significant.
2.2.2. AFTER THE APPROACH
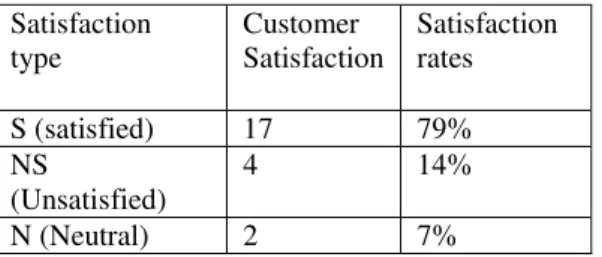
Example2: December2013: The team treated 23 applications as shown the following table (Table 2):
Table 2.Satisfaction rates of December 2013 Satisfaction
type
Customer Satisfaction
Satisfaction rates
S (satisfied) 17 79%
NS
(Unsatisfied)
4 14%
N (Neutral) 2 7%
The table above can be modeled by the following figure (Fig 2):
Fig2. Customer satisfaction of December 2013
� = P(� = S) = .
�� � = P(� = NS) = . and � � = P(� = N) = .
We have =90% and from the example f=79% f − P
√ −
= . − . √ . − .
=− .. = − . > − .
So we accept the hypothesisH and we reject H with error
riskα =5%. The difference between P and observed is due to sampling fluctuations.
Example3: January 2014: The team treated 21 applications as shown the following table (Table 3):
Table 3.Satisfaction rates of January 2014 Satisfaction
type
Customer satisfaction
Satisfaction rates
S (satisfied) 19 85%
NS
(Unsatisfied)
1 5%
N (Neutral) 2 10%
The table above can be modeled by the following figure (Fig 3):
Fig 3.Customer satisfaction of January 2014
� = P(� = S) = .
�� � = P(� = NS) = . and � � = P(� = N) = .
We have =90% and from the example f=85% f − P
√ −
= . − . √ . − .
= − . > − .
So we accept the hypothesis� and we reject � with error
riskα =5%. The difference between P and observed is due to sampling fluctuations.
2.3. TEST OF HOMOGENEITY
We are faced with two samples which are most often not known whether they are from the same source population. It is sought to test whether these samples have the same characteristic ℓ. Two values are observedℓ and
ℓ , the difference between these two values may be due either to sampling fluctuations or the difference of the characteristics of the two original populations. From the examination of two samples of sizen and n are respectively extracts of populationsp M ,α and p M ,α , these tests are used to decide between: H =" ℓ = ℓ ": (we conclude the homogeneity) and H =" ℓ ≠ ℓ ": (we conclude the heterogeneity). In our case we test the homogeneity of 2 proportions:
f = proportion of units having the calculated character X in sample 1;
79% 14%
9% S (satisfied) NS (unsatisfied)
f = proportion of units having the calculated character X in sample 2;
p = proportion of units having the character X in the populationp ;
p = proportion of units having the character X in the populationp ;
� : "� = � = p" and �: " ≠ "
P is replaced by the estimator
� =
f + f+
=
∗ . + ∗ .
= .
. − .√ . ∗ . +
= . > − .
So we conclude the homogeneity of the proposed solution. The proposed population is homogeneous and the difference observed is more significant and is due to sampling fluctuations.
3.
MARKOV MODELING
Let Markov Chain {�}∞defined by X = « Customer satisfaction at the moment t ». For each n, X is a random variable that takes the following states:
{E , E , E }:E : satisfied customer, E : Unsatisfied customer, E : Neutral customer.
We put P(E) = P (X = E) and P = [P E , P E , P E ]
Let M the transition matrix: M=(m,)1≤i ; j≤3
Som, = P(P+ = E / X = E)
According to Markov we have: P+ = P � So P∞= P∞�
[a b c]= [a b c](
m m m
m m m
m m m ) = [A B C]
The problem consists in solving the following system of three equations and three unknowns such as a constraint: a+b+c=1
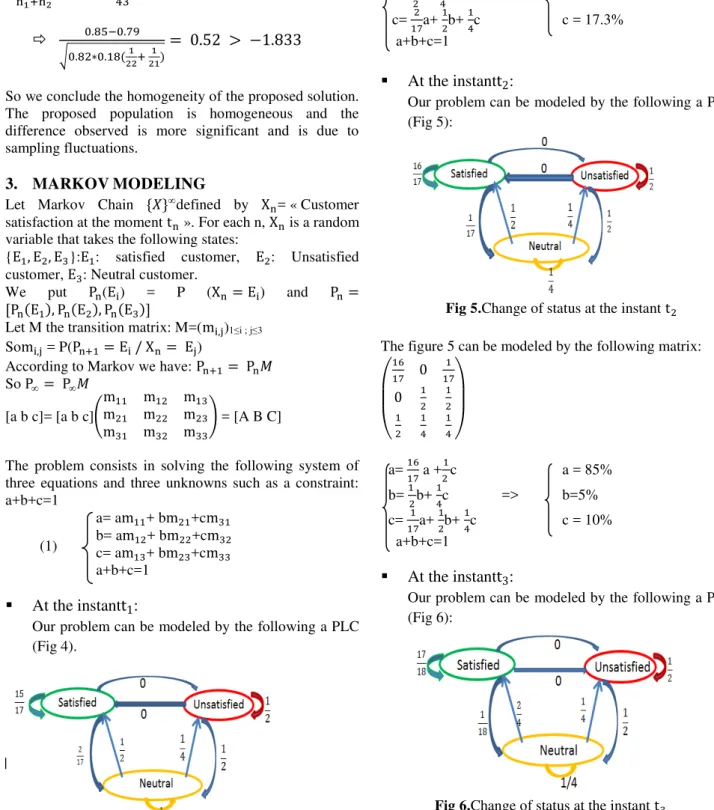
a= am + bm +cm b= am + bm +cm c= am + bm +cm
a+b+c=1
At the instant
t
:
Our problem can be modeled by the following a PLC (Fig 4).
Fig 4.Change of status at the instant t
The figure 4 can be modeled by the following matrix:
( )
a= a + c a = 73% b= b+ c => b=8.69% c= a+ b+ c c = 17.3% a+b+c=1
At the instant
t
:
Our problem can be modeled by the following a PLC (Fig 5):
Fig 5.Change of status at the instant t
The figure 5 can be modeled by the following matrix:
( )
a= a + c a = 85% b= b+ c => b=5% c= a+ b+ c c = 10% a+b+c=1
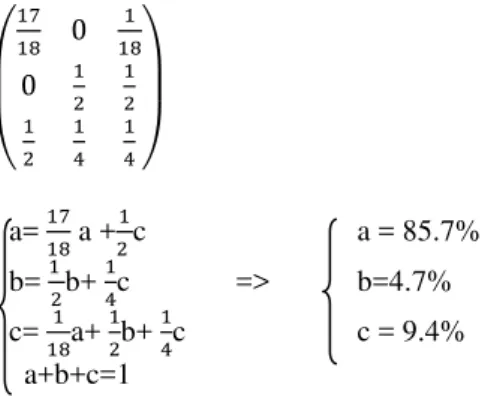
At the instant
t
:
Our problem can be modeled by the following a PLC (Fig 6):
Fig 6.Change of status at the instant t
( )
a= a + c a = 85.7% b= b+ c => b=4.7% c= a+ b+ c c = 9.4% a+b+c=1
After some iterations the transition matrix becomes substantially constant.
4.
TEST OF CONFORMITYThis is to compare an observed distribution of character on a given sample and a theoretical distribution of this character. The problem consists in "adjusting" an experimental distribution with a theoretical distribution. Generally, we do not know the probability law followed by the random variable X.
Let see the following example (Table 4): Table 4.Test of Conformity
Satisfied Unsatisfied Neutral
Theory 90 5 5
Observed 85 5 10
d = khi-2=∑ Oi − TTi i
�= =
−
+ − + − = 5.28 with v=(3-1)*(2-1)=2 the degrees of freedom.
Let t є IR and α the error risk which fixed on 5% with
Pr{�ℎ� − > �} = � (see the table of the Khi-2 law).
H : «Validity of the adjustment» H : « rejection of the adjustment»
From the table of khi-2 law we have t=5.99 and since d<t we accept the hypothesis H and we reject H with error risk 5%.
Using a program for calculating Khi-2, we gave the following result modeled below (Fig 7):
Fig 7.Result of khi-2 test
5. CONCLUSION
The work done is to develop a practical and pragmatic approach to maximize customer satisfaction in an organization for a given period P. Therefore, an approach has been proposed, evaluation, validation and modeling by Markov Chain of the latter are described above.
This work opens the way to our sense towards diverse perspectives of research which are situated on two plans: a plan of deepening of the realized research and a plan of extension of the domain of research.
In terms of deepening of the proposed work, it would be interesting at first to propose or develop practical tools for implementation of the proposed approach.
As for extension of the domain of the research, it would be interesting to connect this approach to governance of information systems and to drive decision-making system which consist to investigate the options and compare them to choose an action that help in making decision.
REFERENCES
[1] Z. Adhiri, S. Arezki, A. Namir, What is Application LifeCycle Management?, International Journal of Research and Reviews in Applicable Mathematics and Computer- Science, ISSN: 2249 – 8931, December 2011
[2] BUFFA, Elwood, Operations Management, 3rd Ed(John Wiley & Sons, 1972).
[3] FRITZSIMMONS, James A. and Mona J. FRITZSIMMONS. Service management: Operations, Strategy and Information Technology,3rd Ed.,
(
Irwin/McGraw-Hill, 2001)
. [4]http://hal.archives-ouvertes.fr/docs/00/71/95/35/PDF/201 CLF10335.pdf
[5]
STEVENSON, William J. Introduction to Management Science, 2e edition, Burr Ridge, (Richard D. Irwin, 1992).Authors Biography