Printed version ISSN 0001-3765 / Online version ISSN 1678-2690 http://dx.doi.org/10.1590/0001-3765201720150453
www.scielo.br/aabc | www.fb.com/aabcjournal
Thinning regimes and initial spacing for
Eucalyptus
plantations in Brazil
ANTONIO C. FERRAZ FILHO1
, BLAS MOLA-YUDEGO2,3
, JOSÉ R. GONZÁLEZ-OLABARRIA4
andJOSÉ ROBERTO S. SCOLFORO5
1
Departamento de Ciências Florestais, Universidade Federal do Piauí/UFPI, Campus Professora Cinobelina Elvas, Avenida Manoel Gracindo, Km 01, 64900-000 Bom Jesus, PI, Brazil 2
School of Forest Sciences, University of Eastern Finland/UEF, P.O. Box 111, FI-80101 Joensuu, Finland 3
Norwegian Forest and Landscape Institute, P.O. Box 115, N-1431 Ås, Norway 4
Forest Sciences Centre of Catalonia/CTFC, Ctra St. Llorenç de Morunys, Km 2, ES-25280 Solsona, Spain 5
Departamento de Ciências Florestais, Universidade Federal de Lavras/UFLA, Caixa Postal 3037, 37200-000 Lavras, MG, Brazil
Manuscript received on June 23, 2015; accepted for publication on April 15, 2016
ABSTRACT
This study focuses on the effects of different thinning regimes on clonal Eucalyptus plantations growth.
Four different trials, planted in 1999 and located in Bahia and Espírito Santo States, were used. Aside from
thinning, initial planting density, and post thinning fertilization application were also evaluated. Before canopy closure, and therefore before excessive competition between trees took place, it was found that stands planted under low densities (667 trees per hectare) presented a lower mortality proportion when compared to stand planted under higher densities (1111 trees per hectare). However, diameter growth prior
to thinning operations was not statistically different between these two densities, presenting an overall
mean of 4.9 cm/year. After canopy closure and the application of the thinning treatments, it was found that thinning regimes beginning early in the life of the stand and leaving a low number of residual trees presented the highest diameter and height growth. Unthinned treatments and thinning regimes late in the life of the stand (after 5.5 years), leaving a large number of residual trees presented the highest values of basal area production. The choice of the best thinning regime for Eucalyptus clonal material will vary according to the plantation objective.
Key words: growing space, forest management, solid wood products, stand density management.
Correspondence to: Antonio Carlos Ferraz Filho
E-mail: [email protected] INTRODUCTION
Of Brazil’s 7 million hectares of planted forests, 70% are constituted of Eucalyptus forests. The majority of these eucalypt forests are destined for energetic and pulping purposes, characterized by high planting densities, few silvicultural interventions after establishment and short rotation
lengths. Of the total Brazilian Eucalyptus industrial
round wood production in 2013 (138 million m3),
about 11% was destined to solid wood products
(plywood, sawn wood, and treated wood) with the remainder destined for paper and cellulose (41%),
charcoal (17%), and fire wood (30%) purposes
(IBÁ 2014). These plantations are destined for the
production of several goods, such as: charcoal, pulp
essential oil, ornamental, and solid wood products (Ferraz Filho et al. 2014).
The use of eucalyptus for the production of solid wood products is an attested possibility, with many successful commercial examples available.
Specifically in Brazil, the product Lyptus®
is a high quality eucalyptus kiln dried wood, which is used in the manufacture of furniture and floor desks (Teixeira et al. 2009).
According to the International Tropical Timber Organization - ITTO (2009), in 2009 Brazil produced circa 15.5 million cubic meters of tropical sawn wood, from which 93% was for domestic
use. These figures make Brazil the world’s largest
consumer of tropical sawn wood. The production of quality wood from planted eucalyptus forests for solid products purposes can help to alleviate the pressure of wood demand from native Brazilian forests.
There is no doubt that thinning leads to an increase in the growth rates of retained crop trees; however, there is little information that enables the prediction of the magnitude of these responses which are likely to vary with many factors including site and species (Forrester et al. 2010).
This research focuses on the analysis of the behavior of Eucalyptus grandis hybrids cultivated in the Brazilian Coastal Region of Bahia and
Espírito Santo States submitted to different initial
spacing and thinning regimes. This information is crucial for decision-making support in forestry, allowing the generation of optimal management schedules for eucalypt solid wood production.
MATERIALS AND METHODS
STAND ESTABLISHMENT
The data came from 188 plots in four different thinning experiments (A, B, C and D). Table I presents the characteristics of the different experiments. Trial A is located in Espírito Santo State (grid reference 19° 42’ S 40° 12’ W), the other
trials are located in Bahia State (all trials located in a 40 km radius from the central grid reference 17° 58’ S 39° 42’ W). Trials A, B, and C were established with initial spacing of 3x3m, while trial D was established under 6x2.5m. The sites of the trials can be considered of good quality, with site index values (mean height of the 100 thickest trees at age 12 years) of 34.6, 43.2, 36.3, and 39.2 for trial A, B, C, and D, respectively.
All the stands used in this study are planted in areas that were previously Eucalyptus forests. Silvicultural operations conducted before planting consisted in weed control using a glyphosate product and a sub soil ripping operation at 40 to 60 cm deeps.
The fertilization done at planting was roughly the same for all experiments, including the application of: 2 t/ha of dolomitic limestone, 14 kg/ha of nitrogen, 29 kg/ha of phosphorus, 11 kg/ ha of potassium, 56 kg/ha of phosphorous applied with the sub soiling operation. Two post-planting fertilizations were made, with applications of: 100 kg/ha of potassium at age 1 year 6 months; 20 kg/ ha of nitrogen and 50 kg/ha of potassium at age 2 years 9 months.
Weed competition was kept under control using glyphosate application and manual control. Manual control was carried out about three times and chemical control about five times in each experiment. When necessary, sprouting stumps of thinned trees were killed using glyphosate, usually one year after the stand’s thinning operation.
The trees of all treatments received two pruning operations at ages 1 year 8 months and 2 years 2 months. The pruning heights were 5 and 7.8
m at the first and second pruning, respectively.
TREATMENTS
The thinning treatments were unthinned, one or
two thinnings at different ages and number of trees
35 kg/ha of nitrogen, 61 kg/ha of phosphorous, 105 kg/ha of potassium and 1.5 t/ha of dolomitic limestone. After the second thinning treatment the fertilization was: 37 kg/ha of nitrogen and 111 kg/ ha of potassium.
Yearly measurements of diameter at breast height and height were made on all trees.
DATA PROCESSING METHODS
Mortality at the time of establishment
Using the number of trees planted per plot and
the number of trees present at the time of the first
measurement, mortality proportion was calculated for each plot. These values were used to check if a lower planting density presents lower mortality 667 (from here on referred to as low density) to
1111 (from here on referred to as high density) trees per hectare. Table I describes the thinning treatments carried out in the analyzed experiments.
All of the treatments presented in Table I consisted of four repetitions. The area of each plot depended on the number of remaining trees, with heavy thinning areas receiving larger plots. The areas of the plots varied from 438 m2 for the unthinned plots to 1034 m2 for the treatments with
150 trees/ha as a final density.
The experiments were divided into two blocks with two repetitions each, where a post thinning fertilization treatment was installed. After the
accomplishment of the first thinning treatment, the
following fertilizer application was implemented:
TABLE I
Thinning treatments applied to the Eucalyptus stands and mean basal area before and after the last thinning operation.
Age Density Basal area (m2
/ha)
Treatments (years) (trees/ha) Pre-thinning Post-thinning % removed
1* 0 1111 12.5 12.5 0.0
2 3.5 and 6.5 600 and 300 18.8 10.7 43.1
3 3.5 300 18.4 6.7 63.8
4 3.5 150 18.0 3.6 80.3
5 3.5 and 6.4 600 and 150 18.4 5.7 69.1
6 5 450 20.6 10.7 48.1
7 5 and 7 450 and 250 16.2 9.8 39.7
8 2.5 and 5.5 600 and 300 17.7 10.8 39.1
9 2.5 and 5.5 600 and 150 18.2 5.5 69.8
10 2.5 300 11.7 4.5 61.5
11 2.5 150 12.2 2.4 80.7
12 0 1111 12.5 12.5 0.0
1** 0 667 10.6 10.6 0.0
2 3.5 300 15.7 8.0 48.8
3 3.5 and 6.2 400 and 250 17.0 11.7 31.1
4 3.5 150 16.7 4.5 72.7
5 5 and 7 250 and 150 12.4 9.8 20.3
6 5 250 19.5 8.7 55.3
7 2.5 and 5.5 400 and 250 18.2 12.2 33.1
8 2.5 and 5.5 400 and 150 17.1 6.8 60.3
9 2.5 300 10.5 5.4 48.8
10 2.5 150 10.7 2.8 74.1
levels. Only plots with no thinning interventions and below 5 years of age where used for this analysis. All treatments were pooled for this analysis. The data was stratified considering two groups, low initial planting density (667 trees per hectare, trial D) and high initial planting density (1111 trees per hectare, trials A, B, and C).
Growth at the time of establishment
To determine the effect of the initial spacing in
plantation forests growth, a distinction was made between measurements taken before and after canopy closure. This distinction was made since early diameter growth is accelerated at very young ages. Thus, to establish the effect of treatments in tree size up to the time of thinning application only plot measurements younger than 5 years were chosen, picking the oldest possible measurement for each plot prior to any thinning intervention. All treatments were pooled for this analysis.
Model (1) was formulated to test for variation on mean tree diameter growth in relation to spacing as follows:
idlk = β0 + β1 * PD + ul + elk (1)
where id is tree diameter growth at or right after canopy closure (cm per year); β0 and β1 are the model’s parameters; PD is a factor variable of the initial planting density (trees/ha). Subscripts l and k refer to plot and tree, respectively. ul and elk are independent and identically distributed random between-plot and between-tree factors with a mean of 0 and constant variances of σ2pl, and σ2tr, respectively. This statistical model was parameterized using the program R (R Core Team 2012) and the nlme package (Pinheiro et al. 2012).
Post establishment growth
Analysis of variance (ANOVA) using a split plot in time scheme (as presented in Casella 2008)
was used to access the effect of thinning on tree
and stand growth. The variables analyzed were: diameter at breast height (DBH, measured at 1.3m from the ground), diameter at breast height of the 100 thickest trees per hectare (DBH100), diameter at breast height of the 200 thickest trees per hectare (DBH200), total height (H), dominant height (H100, mean height of the 100 thickest trees per hectare), stand basal area (G), stand basal area of the 100 thickest trees per hectare (G100), stand basal area of the 200 thickest trees per hectare (G200). The statistical software SISVAR (Ferreira 2008) was used to perform the ANOVA. A significant distinction between blocks in the ANOVA was
regarded as significant fertilizer effects.
RESULTS AND DISCUSSION
MORTALITY
Prior to any thinning operation, we found a higher mortality proportion in the high density plots (0.11 ± 0.10, n=148) compared to the low density plots (0.01 ± 0.12, n=40). These results clearly show that higher density initial spacing establishment presents higher mortality than lower densities. Higher mortality proportions found under higher density stands is consistent with other studies, such as Schneider et al. (2005) and Leite et al. (2006). This can be attributed to the lower competition
suffered by trees under low densities.
GROWTH AT THE TIME OF ESTABLISHMENT
The results presented in Table II account for the difference in initial diameter increment for the
different initial spacing tested (667 and 1111 trees
per hectare), prior to canopy closure or thinning operations (under 5 years of age).
The difference diameter growth values of the
statistical significance (Table II). This means
that the initial spacing will not influence overall
diameter growth as long as thinning takes place at the time of canopy closure. This high initial diameter growth under low planting density is consistent with the high diameter increment potential of many Eucalyptus species of 4 to 7 cm per year in the first 3 years (Nutto et al. 2006).
POST ESTABLISHMENT GROWTH
Table SI - Supplementary Material presents the results of the analysis of variance for all trials and variables analyzed. Thinning, age or the interaction between thinning and age were statistically
significant for all the variables analyzed.
The coefficients of variation associated with
the treatment variable in the ANOVA’s presented in Table SI were low, presenting a mean value of 3.6% and ranging from 1.3% (H100, trial C) to 8.9 (G200, trial D). All the variables tested were
influenced by the interaction of thinning and age or
by thinning and age alone when the interaction was
not significant. A post-hoc analysis using Fisher’s least significant difference (LSD) was carried out.
The results for the last measurement date (age 11.5) are presented in Table SII.
FERTILIZATION RESULTS
In the cases where post thinning fertilization
presented a significant difference for mean stand attributes (significance in the block factor, Table
SI), the differences in the overall means were small.
The trials did not present consistent responses to fertilization, where trials A, B, and C presented larger means in fertilized blocks and trial D smaller means. For the trials that presented elevated growth by extra fertilization, the range of response was of 0.4% to 0.9% in tree level variables (diameter and height) and of 1.2% to 2.4% in stand level variables
(basal area). In the case of trial D, a larger effect was found, with tree level attributes differences ranging
from 2.2% to 3.1% and stand level attributes 3.1% to 5.2%.
In trial A, all tested variables (except dominant
height) were affected by fertilization. Trial B, on
the other hand, did not have extra fertilization applications influencing the dominant stratum of the stand (DBH, height, and basal area of the
100 thickest trees), but did influence the overall
means of the other attributes. In this case, fertilizer
applications seemed to benefit trees other than the dominant ones. Trial C presented fertilizer effects
for all variables except mean DBH, indicating that
fertilizer effect was concentrated on the dominant
stratum of trees. The unusual response presented in trial D might have been due to fertilization enabling trees of the lower stratum to grow to larger sizes than the unfertilized plots. Hence, a more vigorous growth of these trees may have enabled them to give a greater degree of competition to trees of the dominant stratum of the stand, in detriment to whole stand growth. A similar hypothesis was used to explain larger stand growth for trees planted under rectangular spacing when compared to square spacing of the same size (Debell and Harrington 2002).
DIAMETER AT BREAST HEIGHT GROWTH
For the three trials planted under high initial density (A, B, and C), thinning regimes leaving 150 trees/ ha resulted in the largest mean DBH production values. Also, early thinning permitted high diameter
TABLE II
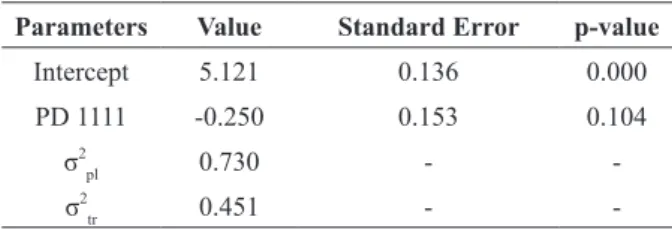
Estimates of the parameters and variance components of the initial establishment model (annual diameter increment as a function of planting density). The mean
intercept value represents the mean annual diameter increment in cm/year of 667 trees per hectare. Parameters Value Standard Error p-value
Intercept 5.121 0.136 0.000
PD 1111 -0.250 0.153 0.104
σ2
pl 0.730 -
-σ2
-growth rates. Thus, the largest diameter values were found in the thinning regime starting at age 2.5 years and leaving 150 trees/hectare (treatment 11). The largest 100 and 200 trees per hectare followed the same behavior as mean DBH results. Results for trials A, B, and C also showed that mean DBH values for treatments 4 (thinning at age 3.5 down to 150 trees/hectare) and 9 (2 thinnings
with final density of 150 trees/hectare) at age 11.5
years were statistically equal. This gives a greater amount of freedom when choosing between one or two thinning operations, as long as the second
thinning is conducted before final crop tress are
subject to excessive competition. Since treatment
5 was statistically different from treatment 9, it can
be inferred that, if second thinning is conducted
before age 5.5 years, final crop trees will not be
exposed to excessive competition.
The results found for trial D showed that trees planted under wide initial spacing (667 trees/ hectare) followed the same behavior as trees planted under close spacing (1111 trees/hectare). Here, early thinning operations (2.5 years) coupled with low residual density (150 trees/hectare) resulted in the highest DBH values (treatment 10). When more importance is given to intermediary production from thinning operations, the statistically equal productions of treatments 8 and 4 allow for a greater degree of freedom for the manager to achieve large diameter values leaving 150 trees/hectare applying one thinning operation (3.5 years) or two thinning
operations (first thinning at age 2.5 leaving 400
tress/hectare and second thinning at age 5.5). When a higher number of final crop trees is desired (250 instead of 150 trees/hectare), the results of Table SII showed that the largest diameter gain was achieved through two thinning operations
beginning at early ages (treatment 7, first thinning
at 2.5 years). Again, the statistically equal results of treatments 3 and 6 allow for similar diameter production either through 2 thinnings or one thinning down to 250 trees/hectare at age 5 years.
Late thinning operations leaving 150 trees/hectare at age 7 years and early thinning operations leaving 300 trees per hectare resulted in lower diameter production than the rest of the treatments (excepting unthinned control plot). Diameter production of the dominant trees followed the same general behavior as mean DBH results.
A 78% higher mean diameter value was found between the most intensive thinning treatment and the unthinned treatment, while this value was reduced to 46% for the dominant trees. This shows that as thinned stands get older, the dominant trees
of the stand are able to increasingly differentiate
themselves from the mean values trees.
HEIGHT GROWTH
Considering height growth, the same tendencies of diameter growth were found, namely higher height values for the low density and early thinned treatments. This was true for both the mean height and the dominant height. While a significant difference for mean height can be expected for Eucalyptus thinning trials (Muñoz et al. 2008, Scheeren et al. 2004), the significant difference found in dominant height is unusual. Several
works have reported no significant difference in
dominant height for Eucalyptus thinning trials, such as: Aguiar et al. (1995), Finger and Schneider (1999), and Zhang et al. (2003). However, in the trials planted with 1111 trees/hectare a mean
difference of 12.6m in mean dominant height was
found between the unthinned treatment and the most intensive thinning treatments (thin to 150 trees/hectare at age 2.5, treatment 11). Even if only plots with thinning application are considered, the
overall difference is still 9.2m between treatment
6 (thin to 450 trees/hectare at age 5) and treatment
11. These differences were smaller for trial D, of
BASAL AREA PRODUCTION
Total basal area production for trials A, B, and C were higher amongst the unthinned check plots. For all these trials, the next highest basal area values were found for thinning at age 5, down to 450 trees per hectare (treatment 6). While this treatment allowed for high total basal area production, the values for basal area of the 100 and 200 thickest trees per hectare were the lowest among the thinned treatments. The treatments consisting of 300 trees per hectare after thinning were ranked as the next highest in total basal area production. In terms of the dominant stratum of the stand, these treatments comprised the largest basal area production after the treatments leaving 150 trees per hectare.
When considering the trial under low initial planting density (D), aside from the unthinned check plot, treatments initiating thinning at age 2.5
years with 250 or 300 trees per hectare remaining
(treatments 7 and 9) presented the largest total
basal area production. These were followed by
the treatments with thinning beginning at age 3.5
years also leaving 250 or 300 trees per hectare.
When analyzing the basal area production of the
dominant stratum, the highest production came
from the treatments leaving 150 trees per hectare
and with early thinning interventions (treatments
4 and 10). Under the low initial planting density
of 667, two thinning operations at age 2.5 and 5.5
with residual densities of 400 and 250 trees per
hectare (treatment 7) produced a large amount of
total basal area (third ranked) while also producing
a large amount of basal area for the dominant trees
(fourth ranked).
MANAGEMENT IMPLICATIONS
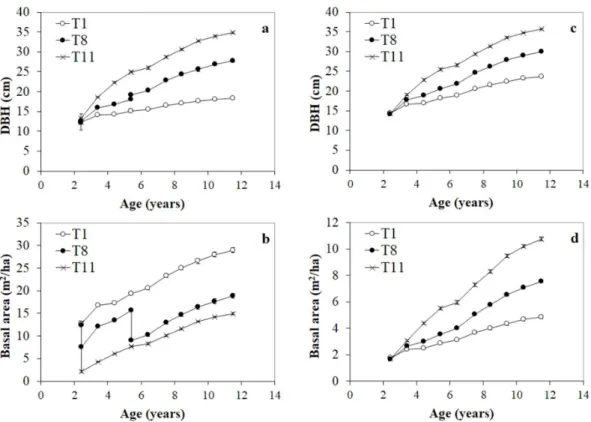
Figures 1 and 2 show the development of mean DBH and basal area as well as dominant DBH and basal area for three distinct management regimes considering two initial spacing options, high and low density, respectively.
Figures 1 and 2 demonstrate that the differences in thinning intensities provide a tradeoff between
large diametrical production and basal area production. In the most intensive thinning regime (T11 in Figure 1 and T10 in Figure 2, both thinned to 150 trees/hectare at age 2.5), large diameter trees (mean diameter of 35 cm and 38 cm for 1111 trees per hectare and 667 trees per hectare, respectively) are obtained in a short period of time (11.5 years). On the other hand, total basal area production is
lower than in other regimes, concentrating growth on a few selected crop trees of the stand. This type of regime characterizes an intensive management scheme, which aims to remove any growth strains (in this case competition from other trees) on selected trees to produce high value logs (Ferraz Filho et al. 2015, Fox 2000, Maestri 2003).
Thinning regimes with two thinning operations (T8 in Figure 1 and T7 in Figure 2) characterizes a multiproduct management scheme (Ferraz Filho et al. 2016). In this type of regime, growth
of the final crop trees are somewhat reduced, but
thinning operations provide wood of commercial
dimensions. Growth rate of the final crop dominant
trees are still elevated, especially when a low initial density is practiced.
Figure 3 shows volume production obtained
in the first and second thinning as well as standing
volume. This was done to better understand total volume production behavior in the different management regimes and productivities sites. Individual tree volume was calculated using a taper function, equivalent to a form factor of about 0.45. A few trends can be seen in Figure 3. Regardless of the thinning regime, total volume production was fairly constant among all treatments, with
differences between the most and least productive
treatments of 22% for trial A and 30% for the other trials. While the most productive treatment varied in all trials, the least productive treatment was to thin down to 150 trees per hectare at age 2.5 years in all trials.
Even if the volume production is fairly constant among all treatments (especially for the least intensive ones) the diameter of the harvested trees is dependent of the thinning regime chosen. For instance, for the most productive site (trial B), regardless of the number of trees, thinning regimes conducted at age 2.5 years yielded trees
with mean DBH class of 13 cm. If the first thinning
was postponed to 3.5 or 5 years, the harvested trees would be of DBH class of 18 cm. The same general behavior was found in the trial planted with the lower density of 667 trees per hectare. Trials A and D (planted with 1111 trees per hectare) yielded
trees with 13 and 18 cm DBH class in the first and
second thinning, regardless of the treatment. The choice of the best thinning regime for Eucalyptus clonal material will vary according to the objective of growing the plantation (Pinkard and Neilsen 2003). For cellulose or energy, planting at high initial spacing with no thinning interventions will maximize standing basal area. The decision is more complex if growing wood for solid wood products. For instance, Medhurst
et al. (2001) recommended a final density of 200
to 300 trees per hectare for thinning Eucalyptus nitens plantations, considering a rotation of 20 to
25 years. From the results of this study, shorter rotations (15 to 20 years) seem possible if early and intensive thinning regimes are used. Nutto et al. (2006) recommends wide initial spacing (500 to 800 trees per hectare) on sites of good to very good quality for high quality sawlog production for Brazilian Eucalyptus plantations. This assures that the high diameter increment potential of Eucalyptus
for the first 3 years is maintained and enables short final rotations of 15 years.
The use of large logs for solid wood products is advisable, since they provide a greater proportion of sawn timber recovery (Wardlaw et al. 2004) and tend to be more stable during drying process (Mckenzie and Hawke 1999) when compared to small diameter logs. For instance, the aforementioned authors recommend logs with minimum small-end diameter of 40 cm to reduce drying degrade in Eucalyptus regnans. The results presented in this study are still provisory, since a rotation of 15 years or more is required for many of the tested thinning treatments to produce considerable quantities of large scale timber. Economic analysis identifying
the most profitable thinning regime once the trials
reach a full rotation age will help elucidate the best thinning regime for the clones and sites tested.
CONCLUSIONS
Stands planted under high densities (1111 trees per hectare) presented a higher initial mortality proportion prior to thinning interventions than stands planted under low initial density (667 trees per hectare).
Diameter growth prior to canopy closure and
thinning operations was not influenced by planting
density, presenting an overall mean of 4.9 cm/year up to 5 years of age.
Post thinning fertilization permitted a small but
statistically significant growth advantage compared
Thinning treatments conducted early in the life
of the stand (2.5 years) and leaving a low number of trees (150 trees/ha) presented the highest values of mean DBH, DBH of the 100 and 200 thickest trees per hectare, mean height, height of the 100
and 200 thickest trees per hectare, and basal area of the 100 and 200 thickest trees per hectare.
Unthinned treatments and thinning treatments
conducted late in the life of the stand and leaving a high number of trees presented the highest values of total basal area.
ACKNOWLEDGMENTS
The authors are grateful to the Coordenação de Aperfeiçoamento de Pessoal de Nível Superior
(CAPES) for providing funding for this work and
Fibria S.A. for providing the data. This paper is
part of the first author’s thesis.
REFERENCES
AGUIAR IB, VALERI SV, SPINELLI P, SARTORI FILHO A AND PIRES CAM. 1995. Efeito de intensidades de desbaste sobre o crescimento em altura e diâmetro de
Eucalyptus citriodora Hook. IPEF 48-49: 1-7.
CASELLA G. 2008. Statistical design. Berlin: Springer Texts in Statistics, 307 p.
DEBELL DS AND HARRINGTON CA. 2002. Density and rectangularity of planting influence 20-year growth and development of red alder. Can J Forest Res 32: 1244-1253. FERRAZ FILHO AC, MOLA-YUDEGO B, GONZÁLEZ-OLABARRIA JR AND SCOLFORO JRS. 2016. Pruning effect in Eucalyptus grandis x Eucalyptus urophylla clone growth. Sci For 111: 729-738.
FERRAZ FILHO AC, SCOLFORO JRS AND MOLA-YUDEGO B. 2014. The coppice-with-standards
Figure 3 - Volume production in the first and second thinnings and standing volume (age 11.5 years) for thinning trials A, B, C,
silvicultural system as applied to Eucalyptus plantations - a review. J For Res 25: 237-248.
FERRAZ FILHO AC, SCOLFORO JRS, OLIVEIRA AD AND MELLO JM. 2015. Modeling growth and yield of loblolly pine stands under intensive management. Pesq Agropec Bras 50: 707-717.FERREIRA DF. 2008. SISVAR: um programa para análises e ensino de estatística. R Symposium 6: 36-41.
FINGER CAG AND SCHNEIDER PR. 1999. Determinação do peso do desbaste para florestas de Eucalyptus grandis
Hill ex Maiden, com base no índice de espaçamento relativo. Ciênc Florest 9: 79-87.
FORRESTER DI, MEDHURST JL, WOOD M, BEADLE CL AND VALENCIA JC. 2010. Growth and physiological responses to silviculture for producing solid-wood products from Eucalyptus plantations: An Australian perspective. For Ecol Manage 259: 1819-1835.
FOX TR. 2000. Sustained productivity in intensively managed forest plantations. For Ecol Manage 138: 187-202. IBÁ. 2014. Relatório da Indústria Brasileira de Árvores.
Brasília, 2014. Disponível em: <http://www.iba.org>. Acesso em 3 de Dezembro de 2014.
ITTO - INTERNATIONAL TROPICAL TIMBER ORGANIZATION. 2009. Annual review and assessment of the world timber situation. Yokohama, 58 p.
LEITE HG, NOGUEIRA GS AND MOREIRA AM. 2006. Efeito do espaçamento e da idade sobre variáveis de povoamentos de Pinus Taeda L. R Árvore 30: 603-612. MAESTRI R. 2003. Criterios de manejo forestal para la
producción de madera sólida: el caso Aracruz. In: Jornadas Forestales de Entre Ríos, 18. Anales… Concordia. MCKENZIE H AND HAWKE A. 1999. Growth response of
Eucalyptus regnans dominant trees to thinning in New Zealand. N Z J For Sci 29: 301-310.
MEDHURST JL, BEADLE CL AND NEILSEN WA. 2001. Early-age and later-age thinning affects growth, dominance, and intraspecific competition in Eucalyptus nitens plantations. Can J Forest Res 31: 187-197.
MUÑOZ F, RUBILAR R, ESPINOSA M, CANCINO J, TORO J AND HERRERA M. 2008. The effect of pruning and thinning on above ground aerial biomass of Eucalyptus nitens (Deane & Maiden) Maiden. For Ecol Manage 255: 365-373.
NUTTO L, SPATHELF P AND SELLING I. 2006. Management of individual tree diameter growth and implications for pruning for Brazilian Eucalyptus grandis Hill ex Maiden. Floresta 6: 397-413.
PINHEIRO J, BATES D, DEBROY S, SARKAR D AND R CORE TEAM. 2012. R Development Core Team. nlme:
Linear and Nonlinear Mixed Effects Models. R package version 3.1-105. Available in: <http://www.cran.rakanu. com/web/packages/nlme/>. Access on August 10, 2012. PINKARD EA AND NEILSEN WA. 2003. Crown and stand
characteristics of Eucalyptus nitens in response to initial spacing: implications for thinning. For Ecol Manage 172: 215-227.
R CORE TEAM. 2012. R: A language and environment for statistical computing. Vienna: R Foundation for Statistical Computing. Available in: <http://www.R-project.org/>. Access on August 10, 2012.
SCHEEREN LW, SCHNEIDER PR AND FINGER CAG. 2004. Crescimento e produção de povoamentos monoclonais de Eucalyptus saligna Smith manejados com desbaste, na região sudeste do Estado do Rio Grande do Sul. Ciênc Florest 14: 111-122.
SCHNEIDER PR, FORTES FO, SOUZA LHS, LÚCIO ADC, FINGER CAG AND SCHNEIDER PSP. 2005. Análise da mortalidade de Acacia mearnsii De Wild. Ciênc Florest 15: 137-143.
TEIXEIRA TOB, SILVA ML, JACOVINE LAG, VALVERDE SR, SILVA JC AND PIRES VAV. 2009. The perception of manufacturers of the furniture center of Ubá-MG about the use of Eucalyptus wood. R Árvore 33: 969-975.
WARDLAW TJ, PLUMPTON BS, WALSH AM AND HICKEY JE. 2004. Comparison of sawn timber recovery and defect levels in Eucalyptus regnans and E. globulus
from thinned and unthinned stands at Balts Road, Tasman Peninsula. Tasforests 15: 99-109.
ZHANG R, BAKER T AND NEILSEN W. 2003. Growth responses to thinning in young Eucalyptus plantations in China and Australia. In: International Conference: Eucalypts in Asia, Zhanjiang, Guangdong. Proceedings Canberra, Zhanjiang, Guangdong, China: Australian Centre for International Agricultural Research, p. 169-173. (ACIAR, 111).
SUPPLEMENTARY MATERIAL
TABLE SI - Summary of the analysis of variance using a split
plot in time formulation to determine the effect of thinning treatment on different aspects of tree and stand growth. TABLE SII - Results for the LSD post-hoc analysis for