LETTER
doi:10.1038/nature10425Primary forests are irreplaceable for sustaining
tropical biodiversity
Luke Gibson1
*, Tien Ming Lee2,3
*, Lian Pin Koh1,4, Barry W. Brook5, Toby A. Gardner6, Jos Barlow7, Carlos A. Peres8,
Corey J. A. Bradshaw5,9, William F. Laurance10, Thomas E. Lovejoy11,12& Navjot S. Sodhi1
{
Human-driven land-use changes increasingly threaten biodiversity, particularly in tropical forests where both species diversity and
human pressures on natural environments are high1. The rapid
conversion of tropical forests for agriculture, timber production and other uses has generated vast, human-dominated landscapes
with potentially dire consequences for tropical biodiversity2–5.
Today, few truly undisturbed tropical forests exist, whereas those degraded by repeated logging and fires, as well as secondary and plantation forests, are rapidly expanding6,7. Here we provide a global
assessment of the impact of disturbance and land conversion on biodiversity in tropical forests using a meta-analysis of 138 studies. We analysed 2,220 pairwise comparisons of biodiversity values in primary forests (with little or no human disturbance) and disturbed forests. We found that biodiversity values were substantially lower in degraded forests, but that this varied considerably by geographic region, taxonomic group, ecological metric and disturbance type. Even after partly accounting for confounding colonization and succession effects due to the composition of surrounding habitats, isolation and time since disturbance, we find that most forms of forest degradation have an overwhelmingly detrimental effect on tropical biodiversity. Our results clearly indicate that when it comes to maintaining tropical biodiversity, there is no substitute for primary forests.
As the extent of primary forests is shrinking throughout the tropics, a growing body of work has quantified the biodiversity values of degraded tropical forests. The ecological responses following forest conversion vary markedly across taxonomic groups, human impact types, ecological metrics and geographic regions5,8–10. Most studies, however, provide limited insight into the varied responses of tropical forest biota to human impacts because they are understandably restricted to particular distur-bance types11,12, taxa13,14and geographic regions15. Therefore, their often contrasting conclusions might have clouded ongoing debates over the conservation value of modified forest ecosystems4. A comprehensive meta-analysis of the conservation value of human-modified tropical forests is therefore sorely lacking. Notably, such an assessment could provide a critical baseline for monitoring progress towards global con-servation targets16, evaluate the biodiversity benefits of international carbon-trading initiatives to reduce emissions from deforestation and forest degradation17,18(for example the United Nations REDD1 pro-gramme), and guide policy development through the integration of biodiversity data into the modelling of land-use change scenarios2,19,20.
Here we conduct a global meta-analysis to measure the varied effects of land-use change and forest degradation on biodiversity in tropical
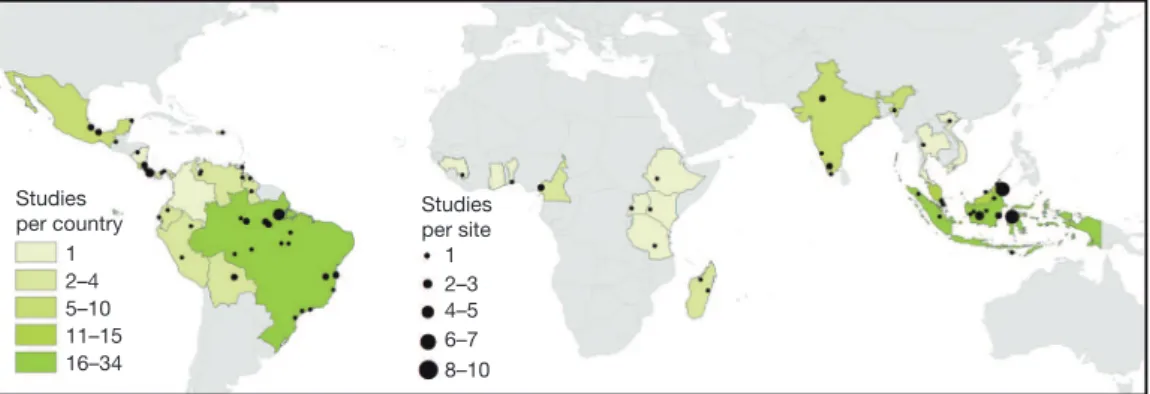
forests. From an exhaustive literature search, we identified 138 studies that reported measures of biodiversity from multiple sites in both primary and disturbed tropical forests (Methods). We necessarily assumed that all ‘primary forests’ referred to in our source literature are largely old-growth forests that have experienced little to no recent human disturbance, although we recognize that in reality few primary forests are likely to be genuinely pristine. Primary forests are starkly differentiated from disturbed sites, which encompass the full spectrum of degraded and converted forest types, including selectively logged forests, secondary forests and forests converted into various forms of agriculture. In total, these studies spanned 28 countries and 92 study landscapes (Fig. 1). To measure the effect size of human-driven land-use changes, we calculated the weighted average of the standardized difference (based on pooled variance measures) between mean bio-diversity measurements in primary and disturbed sites21 (that is, Hedges’g*). The effect size was positive when the biodiversity value of primary forest sites was greater than that of disturbed sites, implying that the measured disturbance had a detrimental impact on bio-diversity. We used a resampling procedure based on 10,000 bootstrap samples (with replacement) to generate the median effect size and 95% confidence intervals.
Overall, human impacts reduced biodiversity in tropical forests, although the effect size varied by region, taxonomic group, metric and disturbance type (Fig. 2). The median effect size for all 2,220 pairwise comparisons from 138 studies was 0.51 (95% confidence interval, 0.44–0.58) (Supplementary Table 1). This changed little when we accounted for pseudoreplication from studies that reported mul-tiple comparisons, using a resampling procedure in which one com-parison per study was randomly drawn for 10,000 samples, yielding an overall effect size of 0.57 (0.35–0.79) (Supplementary Table 1). Our results are also robust to publication biases (Methods). The surround-ing habitat might either ameliorate (if hospitable) or exacerbate (if hostile) the impact of forest disturbance on biodiversity22. Although data are lacking for a comprehensive analysis, to account partly for this effect we repeated our analysis using only those studies that had nat-ural vegetation (that is, primary and selectively logged forests) as the surrounding habitat (70.1% of all pairwise comparisons). Using this subset, we detected no substantial change in either the direction or the magnitude of effect sizes for the full data set (0.58, 0.49–0.68), or for each of the variables described below (Supplementary Table 1).
We found that human impacts on biodiversity varied by region. Although our data set is highly comprehensive, it is still limited given the vast extent of tropical forests and the myriad ways in which
{Deceased.
1Department of Biological Sciences, National University of Singapore, 14 Science Drive 4, Singapore 117543, Singapore.2Ecology, Behavior and Evolution Section, Division of Biological Sciences, University
of California, San Diego, 9500 Gilman Drive, La Jolla, California 92093-0116, USA.3Department of Ecology and Evolutionary Biology, Yale University, PO Box 208106, New Haven, Connecticut 06520-8106,
USA.4Department of Environmental Sciences, ETH Zurich, CHN G73.1, Universitatstrasse, 16 8092 Zurich, Switzerland.5The Environment Institute and School of Earth and Environmental Sciences, The
University of Adelaide, Adelaide, South Australia 5005, Australia.6Department of Zoology, University of Cambridge, Cambridge CB2 3EJ, UK.7Lancaster Environmental Centre, Lancaster University,
Lancaster LA1 4YQ, UK.8School of Environmental Sciences, University of East Anglia, Norwich NR4 7TJ, UK.9South Australian Research and Development Institute, PO Box 120, Henley Beach, South
Australia 5022, Australia.10Centre for Tropical Environmental and Sustainability Science (TESS) and School of Marine and Tropical Biology, James Cook University, Cairns, Queensland 4870, Australia. 11Biological Dynamics of Forest Fragments Project, National Institute for Amazonian Research (INPA), CP 478, Manaus, AM 69011–970, Brazil.12H. John Heinz III Center for Science, Economics and
Environment, 1001 Pennsylvania Avenue NW, Washington DC 20004, USA.
humans disturb them23. Asia (52 studies) and South America (47) were the subjects of considerably more studies than were Central America (27) and Africa (12) (Fig. 1 and Supplementary Table 1). This regional bias implies that our findings might be more generalizable to Asia and South America than to other tropical regions. More critically, it high-lights an urgent need for more research, particularly in Africa, which sustains the second largest contiguous tropical forest in the world5. Despite this important caveat, we found that Asia harbours the most sensitive biota, producing an effect size of 0.95 (0.83–1.08), which is substantially higher than that of the other three regions (Fig. 2a). This highlights the great toll human land-use changes are exacting in Asia, particularly in Southeast Asia, which most Asian studies (44 of 52) considered. Recent and widespread expansion of oil palm mono-culture and exotic-tree plantations has greatly modified forest habitats in this region24, but all forms of human impact were higher in Asia than
elsewhere (Fig. 3a), suggesting that this regional pattern holds regard-less of disturbance type. Our results highlight the critical need to mitigate the particularly detrimental human impacts in Asia25.
Most taxonomic groups we assessed were negatively affected by disturbance, with effect sizes greater than 0.5 (Fig. 2b and Sup-plementary Fig. 1b). However, mammals were less sensitive to the disturbances measured and, in some instances, actually benefitted from human disturbance, with an effect size of 20.12 (20.24 to 20.01). This disparity, largely due to higher mammal abundances in certain disturbance types (Fig. 3b and Supplementary Table 3), might arise because of mammals’ high tolerance of degraded forests and forest edges26, particularly among small mammals (
20.04,20.27 to 0.20) and bats (20.24,20.42 to20.06), which dominated most studies on mammals (Supplementary Table 1). At the other extreme, birds were the most sensitive group, with an effect size of 0.72 (0.52–0.93).
Studies per site
1 2–3 4–5 6–7 8–10 Studies
per country 1 2–4 5–10 11–15 16–34
Figure 1|Map of study sites by country and by study location.Country colour represents the number of studies per country (n528 total countries) and circle
size represents the number of studies at each site (n592 total sites; only 82 sites with Global Positioning System coordinates are shown).
Africa
Asia
Central America
South America
(n = 287)
(n = 608)
(n = 416)
(n = 909)
Arthropods
Birds
Mammals
Plants
a b
(n = 593)
(n = 529)
(n = 347)
(n = 751)
Abundance
Community struct. func.
Demographics
Forest struct.
Richness
–0.2 0.0 0.2 0.4 0.6 0.8 1.0 1.2 (n = 869)
(n = 113)
(n = 108)
(n = 270)
(n = 860) c
Aband. agri.
Active agri.
Agroforestry
Burned
Other extract.
Pastures
Plantations
Secondary
Select. logged
Shaded plant.
–0.2 0.0 0.2 0.4 0.6 0.8 1.0 1.2 d
(n = 109)
(n = 191)
(n = 157)
(n = 111)
(n = 50)
(n = 144)
(n = 212)
(n = 687)
(n = 355)
(n = 152)
Bootstrapped effect size
Region Taxon
Response metric Disturbance type
Less More detrimental Less More detrimental
FSR
Figure 2|Box plots of bootstrapped effect size. a, By region;b, by taxon;c, by
response metric;d, by disturbance type (omitting clear-cut and disturbed/ hunted owing to small sample sizes, that is,,50 comparisons). Plotted are median values and interquartile ranges of 10,000 resampled (with replacement) effect size calculations for each group. Widths of notches in box plots
approximate 95% confidence intervals. Median value for forest species richness (FSR) is plotted for comparison. The vertical black and grey dashed lines represent an effect size of zero and the median effect size for the entire data set, respectively. Sample size is shown in parentheses.
2 0 O C T O B E R 2 0 1 1 | V O L 4 7 8 | N A T U R E | 3 7 9
Macmillan Publishers Limited. All rights reserved
These results varied by disturbance type; birds constituted the group most sensitive to forest conversion into agriculture (active agriculture, abandoned agriculture and agroforestry systems), whereas plants constituted the group most sensitive to burned forests and shaded plantations (Fig. 3a and Supplementary Table 2). The effect size for arthropods (0.64, 0.52–0.78) when further differentiated into the three main taxonomic orders revealed some differences: Coleoptera was more sensitive to disturbance (1.01, 0.75–1.30) than were Hymenoptera (0.41, 0.11–0.69) and Lepidoptera (0.58, 0.28–0.89) (Supplementary Table 1). In general, our findings reflect a paucity of information about most of the world’s tropical biota; more data are needed to understand the ecological mechanisms underlying the dif-fering vulnerability of taxa to human disturbance27.
The source literature we considered used various measures of bio-diversity, which we broadly differentiated into five response metrics: abundance, community structure and function, demographics, forest structure, and richness (Methods, Fig. 2c and Supplementary Fig. 1a). Of these, abundance and richness were the most commonly reported metrics, together comprising over three-quarters of all pairwise comparisons. Richness (0.83, 0.7220.95) was markedly more sensitive to human disturbance than abundance (0.19, 0.0720.31) (Figs 2c and
3b and Supplementary Tables 2 and 3). This result accords with expec-tations, given observations of large increases in the abundance of generalist species following similarly large declines in richness in degraded tropical forests5,28. Furthermore, our measure of richness was predictably conservative because it assessed both forest specialists and generalists; when restricted to forest specialists (n570 compar-isons), the effect size for species richness increased to 1.16 (0.69–1.65) (Fig. 2c and Supplementary Table 1). Measures of forest species rich-ness therefore could serve as a simple yet effective metric to assess the conservation value of tropical forests and the relative impacts of dif-ferent patterns of human modification, particularly during the early stages of forest conversion when conservation actions are most urgently needed.
We identified 12 general forest disturbance or conversion classes, and all but one of those with adequate sample sizes had effect sizes greater than 0.4 (Supplementary Table 1). In general, agricultural land-use classes (abandoned and active agricultural sites) had a much greater impact than agroforestry systems and plantations (both shaded and unshaded) (Fig. 2d). As the single exception, selectively logged forests (largely those affected by a single cutting cycle) had a much smaller, yet still positive, effect size of 0.11 (0.01–0.20). This is con-sistent with previous studies showing that selectively logged forests retain a high richness of forest taxa12. Although these findings suggest that logged forests could contribute to biodiversity conservation, there are several caveats that need consideration: (i) if logged forest sites are adjacent to primary forests, spill-over effects might exaggerate the species richness of logged forests22 (acting as sink habitats); (ii) the proximity of logged forests to primary forests might also result in species extinction debts that are repaid over lengthy periods of time, beyond the timescale of the short-term studies that comprise most of our data set (83.6% had a time since disturbance of#12 yr); (iii) repeated logging might further exacerbate these biodiversity impacts; and (iv) the networks of forest roads created by logging operations might facilitate human immigration to forest frontiers and trigger associated increases in fires and forest conversion29. As selective logging continues to expand across the tropics30, understanding its long-term impacts and interactions with other forms of disturbance such as fire and invasive species5will become increasingly important for the conservation of tropical biodiversity.
In contrast with the relatively benign selectively logged forests, secondary forests of varying ages had an intermediate effect size of 0.41 (0.28–0.54). It has been suggested recently that secondary forests can be an effective complement to primary forests in supporting tropical biodiversity, and should therefore represent a priority for con-servation11. Although the wide variety of secondary forests measured vary markedly in biodiversity value depending on forest age and land-use history, our meta-analysis demonstrates that secondary forests invariably have much lower biodiversity values than do remnant areas of relatively undisturbed primary forest (Supplementary Table 2). Although regenerating degraded areas can greatly increase the long-term persistence of biodiversity in severely modified landscapes6, our findings suggest that protecting remaining primary forests and restor-ing selectively logged forests are likely to offer the greatest conser-vation benefits for tropical biota.
We tested the relative importance of the above-mentioned eco-logical correlates in explaining the effect size. We used an informa-tion-theoretic approach to evaluate the performance of a candidate set of generalized linear models (Methods). After controlling for pseudo-replication from studies, the most parsimonious model in predicting the impact of anthropogenic forest disturbance on effect size was the null model (selected in 37.3% of 10,000 iterations), with the models ‘Region’ (23.1%) and ‘Response metric’ (14.4%) ranked second and third, respectively (Supplementary Table 5). This result also holds for a data set that includes only studies with natural vegetation as the surrounding habitat (n51,557), as well as for a smaller subset of data with information on time since disturbance and mean isolation
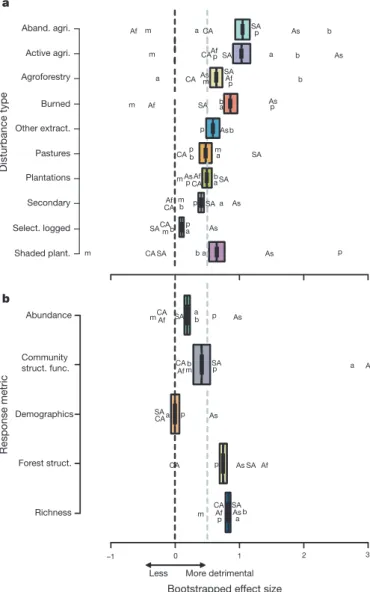
Shaded plant. Select. logged Secondary Plantations Pastures Other extract. Burned Agroforestry Active agri. Aband. agri. Richness Forest struct. Demographics Community struct. func. Abundance
–1 0 1 2
Bootstrapped effect size
a
b
Disturbance type
Response metric
Less More detrimental
Af Af Af Af As As As As As As As As CA CA CA CA CA SA SA SA SA SA SA SA a a a a a a a a b b b b b b b b b m m m m m m m m p p p p p p p p p CA SA CAAf Af CA SA
a Asm p b
SA Af Af Af Af As As As As As CA CA CA CA CA SA SA SA SA a a a a b b b m m m p p p p p 3
Figure 3|Box plots of bootstrapped effect size. a, By disturbance type;b, by
distance (n5630; accounting for variation in colonization and suc-cession effects22) (Supplementary Fig. 2 and Supplementary Table 5). Our analysis of generalized linear models showed that the observed detrimental disturbance effects are essentially universal and that cor-relates such as region, taxonomic group, disturbance type and eco-logical measure have little impact on the effect size.
Our meta-analysis provides a global assessment of the relative con-servation value of a broad range of human-modified tropical forests. Our results demonstrate that forest conversion and degradation con-sistently and greatly reduce biodiversity in tropical forest landscapes. As an exception, selective logging of forests has a much lower detrimental effect on measured biodiversity responses, implying that ecological restoration of such areas could help to alleviate threats to tropical biodiversity. Overall, however, we conclude that primary forests are irreplaceable for sustaining tropical biodiversity. Con-sequently, we strongly urge their protection by enhancing of enforce-ment in existing protected areas, expanding the current network of reserves and curbing international demand for forest commodities obtained at the expense of primary forests. Improving mechanisms for delivering and sustaining the social, financial and technical support necessary to achieve such goals continues to present one of the greatest challenges to tropical biodiversity conservation in the twenty-first cen-tury.
METHODS SUMMARY
Using Web of Science and BIOSIS, we searched for all relevant research articles published between 1975 and October 2010 that (i) included measures of bio-diversity at multiple sites in both primary and disturbed tropical forests, (ii) indicated that the primary forests had little or no human disturbance and (iii) reported variance measures for biodiversity responses. From these studies, we compiled the biodiversity measures reported in both primary and disturbed forest sites and classified these measures using four variables: geographic region, taxonomic group, ecological response metric and disturbance type. For each paired biodiversity measure, we calculated the bias-corrected Hedges’g*, the difference between primary and disturbed group means standardized by the pooled standard deviation. We then calculated the average effect size using the random-effects model, where effect sizes of individual comparisons are weighted by the inverse of within-study variance plus between-study variance21. We repeated this procedure after resampling the effect size calculations using 10,000 bootstrap samples (with replacement), from which we generated 95% confidence intervals. We calculated the effect size for the entire data set, for each subgroup of the four variables (region, taxon, response metric and disturbance type) and for each of the six two-level combinations of the four variables (for example disturbance type3region). We repeated the above calculations for a subset of the data set with natural surrounding habitat, to account for the influence of this habitat. We also tested the effect sizes for possible publication bias. Following ref. 15, we performed an information-theoretic evaluation of a candidate set of generalized linear models to examine the influence of a set of proposed factors on the ecological responses tabulated. The generalized linear models related the Hedges’g*effect size to the categorical predictor variables region, taxonomic group, metric and disturbance type in the 15 possible variable combinations.
Full Methodsand any associated references are available in the online version of the paper at www.nature.com/nature.
Received 13 May; accepted 8 August 2011. Published online 14 September 2011.
1. Dirzo, R. & Raven, P. H. Global state of biodiversity and loss.Annu. Rev. Environ. Resour.28,137–167 (2003).
2. Sala, O. E.et al.Global biodiversity scenarios for the year 2100.Science287, 1770–1774 (2000).
3. Foley, J. A.et al.Global consequences of land use.Science309,570–574 (2005). 4. Laurance, W. F. Have we overstated the tropical biodiversity crisis?Trends Ecol.
Evol.22,65–70 (2007).
5. Gardner, T. A.et al.Prospects for tropical forest biodiversity in a human-modified world.Ecol. Lett.12,561–582 (2009).
6. Chazdon, R. L. Beyond deforestation: restoring forests and ecosystem services on degraded lands.Science320,1458–1460 (2008).
7. Wright, S. J. Tropical forests in a changing environment.Trends Ecol. Evol.20, 553–560 (2005).
8. Barlow, J.et al.Quantifying the biodiversity value of tropical primary, secondary, and plantation forests.Proc. Natl Acad. Sci. USA104,18555–18560 (2007). 9. Stork, N. E.et al.Vulnerability and resilience of tropical forest species to land-use
change.Conserv. Biol.23,1438–1447 (2009).
10. Gardner, T. A., Barlow, J., Sodhi, N. S. & Peres, C. A. A multi-region assessment of tropical forest biodiversity in a human-modified world.Biol. Conserv.143, 2293–2300 (2010).
11. Dent, D. H. & Wright, S. J. The future of tropical species in secondary forests: a quantitative review.Biol. Conserv.142,2833–2843 (2009).
12. Edwards, D. P.et al.Degraded lands worth protecting: the biological importance of Southeast Asia’s repeatedly logged forests.Proc. R. Soc. B278,82–90 (2011). 13. Hughes, J. B., Daily, G. C. & Ehrlich, P. R. Conservation of tropical forest birds in
countryside habitats.Ecol. Lett.5,121–129 (2002).
14. Horner-Devine, M. C., Daily, G. C., Ehrlich, P. R. & Boggs, C. L. Countryside biogeography of tropical butterflies.Conserv. Biol.17,168–177 (2003). 15. Sodhi, N. S., Lee, T. M., Koh, L. P. & Brook, B. W. A meta-analysis of the impact of
anthropogenic forest disturbance on Southeast Asia’s biotas.Biotropica41, 103–109 (2009).
16. Walpole, M.et al.Tracking progress toward the 2010 biodiversity target and beyond.Science325,1503–1504 (2009).
17. Harvey, C. A., Dickson, B. & Kormos, C. Opportunities for achieving biodiversity conservation through REDD.Conserv. Lett.3,53–61 (2010).
18. Strassburg, B. B. N.et al.Global congruence of carbon storage and biodiversity in terrestrial ecosystems.Conserv. Lett.3,98–105 (2010).
19. Koh, L. P. & Ghazoul, J. Spatially explicit scenario analysis for reconciling agricultural expansion, forest protection, and carbon conservation in Indonesia. Proc. Natl Acad. Sci. USA107,11140–11144 (2010).
20. Pereira, H. M.et al.Scenarios for global biodiversity in the 21st century.Science 330,1496–1501 (2010).
21. Borenstein, M., Hedges, L. V., Higgins, J. P. T. & Rothstein, H. R.Introduction to Meta-Analysis(Wiley, 2009).
22. Prugh, L. R., Hodges, K. E., Sinclair, A. R. E. & Brashares, J. S. Effect of habitat area and isolation on fragmented animal populations.Proc. Natl Acad. Sci. USA105, 20770–20775 (2008).
23. Peres, C. A., Barlow, J. & Laurance, W. F. Detecting anthropogenic disturbance in tropical forests.Trends Ecol. Evol.21,227–229 (2006).
24. Koh, L. P. & Wilcove, D. S. Is oil palm agriculture really destroying tropical biodiversity?Conserv. Lett.1,60–64 (2008).
25. Sodhi, N. S., Koh, L. P., Brook, B. W. & Ng, P. K. L. Southeast Asian biodiversity: an impending disaster.Trends Ecol. Evol.19,654–660 (2004).
26. Daily, G. C., Ceballos, G., Pacheco, J., Suza´n, G. & Sa´nchez-Azofeifa, A. Countryside biogeography of Neotropical mammals: conservation opportunities in agricultural landscapes of Costa Rica.Conserv. Biol.17,1814–1826 (2003).
27. Gardner, T. A., Barlow, J., Parry, L. T. W. & Peres, C. A. Predicting the uncertain future of tropical forest species in a data vacuum.Biotropica39,25–30 (2007). 28. Terborgh, J.et al.Ecological meltdown in predator-free forest fragments.Science
294,1923–1926 (2001).
29. Laurance, W. F., Goosem, M. & Laurance, S. G. Impacts of roads and linear clearings on tropical forests.Trends Ecol. Evol.24,659–669 (2009).
30. Asner, G. P., Rudel, T. K., Aide, T. M., Defries, R. & Emerson, R. A contemporary assessment of change in humid tropical forests.Conserv. Biol.23,1386–1395 (2009).
Supplementary Informationis linked to the online version of the paper at www.nature.com/nature.
AcknowledgementsWe thank the tropical conservation scientists whose efforts helped to make our study possible. L.G., T.M.L. and N.S.S. were supported by grant R-154-000-479-112 from the National University of Singapore and L.G. was also supported by the Singapore International Graduate Award. L.P.K. was supported by the Swiss National Science Foundation and the ETH North-South Centre. T.A.G. thanks the Natural Environmental Research Council (NE/F01614X/1), and T.A.G. and J.B. thank the Instituto Nacional de Cieˆncia e Tecnologia – Biodiversidade e Uso da Terra na Amazoˆnia (CNPq 574008/2008-0) for funding. We dedicate this paper to the memory of N.S.S., who died while the manuscript was being reviewed.
Author ContributionsThe design of this project was the result of discussions involving all authors. L.G. and T.M.L. compiled the database; L.G., T.M.L. and B.W.B. performed the analysis; L.G., T.M.L. and N.S.S. wrote the initial draft of the manuscript; and all authors contributed to the writing of the final version of the paper. All authors discussed the results and commented on the manuscript.
Author InformationReprints and permissions information is available at www.nature.com/reprints. The authors declare no competing financial interests. Readers are welcome to comment on the online version of this article at www.nature.com/nature. Correspondence and requests for materials should be addressed to L.G. (lggibson@nus.edu.sg) and T.M.L. (tmlee@ucsd.edu).
2 0 O C T O B E R 2 0 1 1 | V O L 4 7 8 | N A T U R E | 3 8 1
Macmillan Publishers Limited. All rights reserved
METHODS
Data.We searched for all relevant research articles published between 1975 and October 2010 using Web of Science and BIOSIS with the search query (TS5 [(bird*OR mammal*OR reptile*OR amphibia*OR arthropod*OR plants*OR lepidoptera*OR hymenoptera*OR arachnid*OR coleoptera*OR diptera*OR homoptera*OR isoptera*) AND (clear-cutting*OR log*OR deforestation*OR fire* OR agriculture conversion*OR disturbance*OR degradation*OR secondary forest* OR plantation*OR fragment*)]). From this list, we reviewed articles and retained those studies that (i) included measures of biodiversity at multiple sites in both primary and disturbed tropical forests, (ii) indicated that the primary forests had little or no human disturbance and (iii) reported variance measures for biodiversity responses. We defined primary forests as primary or old-growth forests that have never been clear-felled and have been impacted by little or no known recent human disturbance. For each study, we recorded the biodiversity measures in both primary and dis-turbed forest sites. For those studies that reported results in figures only, we extracted results using DATATHIEF (http://www.datathief.org). The full data set is available in the online version of the paper. For each comparison, we recorded the region (Africa, Asia, Central America (including Mexico), South America) and broad taxonomic group (arthropods, birds, mammals, plants). Although arthropods span diverse groups with potentially differing responses to human impacts8, our sample included predominantly insects (Coleoptera, 29.2%; Hymenoptera, 22.9%; Lepidoptera, 22.6%) and we therefore treated it as a single group but reported differences between the three major insect orders represented. Mammals also comprised different groups, and we differentiated between bats (51.0%), large mammals (2.6%), primates (3.7%), small mammals (28.2%) and a miscellaneous group (14.4%).
We classified the biodiversity measure into five response metrics: abundance (for example density, capture frequency, occupancy estimates and biomass); community structure and function (for example abundance of different guilds (generalists, herb specialists and so on), proportion of trait states and individual weight); demographics (for example density of different age classes (adults/ juveniles/saplings/seedlings), fruit/flower production and genetic measures); forest structure (for example canopy height/cover/openness, basal area, litter depth, diameter at breast height and other physical structural measurements, and density of trees of a given diameter at breast height); and richness (for example observed/estimated/rarefied richness, species density and genera/family richness). We omitted diversity indices (n5151; for example Fisher’s alpha, Shannon– Wiener, Simpson’s and Margalef’s) because they were usually secondary (derived) measures of abundance and/or richness and are not straightforward to interpret. We recorded the disturbance type as specified by the authors of the source literature, which formed twelve distinct groups: abandoned agriculture, active agriculture, agroforestry, burned forests, clear-cut forests, disturbed/hunted forests, other extracted forests, pastures, plantations, secondary forests, selectively logged forests and shaded plantations. To avoid an inadequate treatment of forest fragmentation, which is an important topic, we necessarily excluded data on forest fragments. However, we recognize that remnant forest fragments, particularly large ones, in heavily human-modified ecosystems might be critical for biodiver-sity persistence.
In addition, and where available, we collected data on patch size, surrounding habitat type, isolation distance and time since disturbance15,22. We categorized the predominant surrounding habitat of disturbed forests into five broad groups: natural vegetation (that is, primary and selectively logged forests), agriculture, disturbed forests, pastures and tree plantations. Using maps and/or geo-referenced locations from the source literature, we calculated isolation distance as the mean distance between disturbed sites and the nearest primary forest site to account for coloniza-tion effects for a smaller set of the data. We measured time since disturbance as the amount of time that had elapsed between the most recent form of disturbance and the time of study, as indicated by the authors of the source literature, to account for post-disturbance and time-lag effects. We excluded patch size or area information from our analysis largely as a result of ambiguity and extremely low sample size (22.6% of the comparisons provided this information for disturbed sites). We have already acknowledged the potential confounding effects of area in detail elsewhere15. Meta-analysis.For each comparison, we calculated Hedges’g, the difference between primary and disturbed group means standardized using the pooled stand-ard deviation of the two groups21, defined as:
g~xprimary {xdisturbed SDpooled
where
SDpooled~
ffiffiffiffiffiffiffiffiffiffiffiffiffiffiffiffiffiffiffiffiffiffiffiffiffiffiffiffiffiffiffiffiffiffiffiffiffiffiffiffiffiffiffiffiffiffiffiffiffiffiffiffiffiffiffiffiffiffiffiffiffiffiffiffiffiffiffiffiffiffiffiffiffiffiffiffiffiffiffiffiffiffiffiffiffiffiffiffiffiffi
(nprimary{1)SD2primaryz(ndisturbed{1)SD2disturbed
nprimaryzndisturbed{2 s
Because Hedges’gis a biased estimator of population effect size, we used the conversion factorJto compute a bias-corrected metric,g*(ref. 21), defined as
g*5Jg, where
J~1{ 3
4(nprimaryzndisturbed{2){1
We then calculated the average effect size using the random-effects model, where effect sizes of individual comparisons are weighted by the inverse of within-study variance plus between-study variance21. For individual comparisons, we defined the effect size as positive for comparisons where the biodiversity value was higher in primary forest (such that a positive effect size indicates a more detrimental impact by the disturbance type). For a small subset of comparisons where the expected value would be lower in primary forest (n5180, 8.1% of all pairwise comparisons; for example measures of saplings/seedlings/juveniles, early/mid-successional species, non-forest/open-forest species, common/generalist/visitor species, trees of diameter at breast height,10 cm, dead/new trees and mortality/ recruitment rates), we defined the effect size as negative for comparisons where the biodiversity value was higher in primary forest. As our results might be affected by the selection of comparisons with an opposite expectation of the direction of the effect, we repeated the procedure after omitting those compar-isons. This led to an effect size of 0.45 (0.38–0.52), within the error of the effect size for the full data set, suggesting that our expectation did not affect the results (Supplementary Table 1).
We calculated the effect size for the entire data set, for each subgroup of the four variables (region, taxon, response metric and disturbance type) and for each of the six two-level combinations of the four variables (for example disturbance type3 region) (Fig. 3, Supplementary Fig. 1 and Supplementary Tables 2–4). For all combinations, we repeated this procedure after resampling the random-model effect size calculations using 10,000 bootstrap samples (with replacement), from which we generated 95% confidence intervals31. To address potential spatial and temporal autocorrelation from studies that included several comparisons (for example multiple measurements of the same taxa, measurements of multiple taxa and measurements of multiple disturbance types), we repeated this procedure after resampling one comparison per study, again using 10,000 bootstrap samples (Supplementary Table 1). However, some autocorrelation (largely only spatial) remains because several studies were situated in the same site (Fig. 1), although it is probably not as pronounced as above. To account for the potential influ-ence of the surrounding habitat, we repeated the above calculations for a subset of the data set with natural surrounding habitat (70.1% of data) (Supplementary Table 1).
We tested for publication bias using two methods to assess whether our calcu-lated effect sizes were affected by the possible absence of studies not published owing to a failure to detect differences21. First, we visually examined a funnel plot of effect size plotted against standard error to assess the symmetry of study pre-cision around effect size (Supplementary Fig. 3). The relatively symmetrical funnel plot suggests there is no relationship between effect size and study size, and that those studies with small (or negative) effect sizes do not have a lower probability of being published. Second, we sorted the data set by precision, from comparisons with small standard errors to those with large standard errors, and examined the change in cumulative effect size with the addition of the most imprecise studies (Supplementary Fig. 4). Although the addition of the most imprecise third of comparisons (those with the largest standard errors) does cause the cumulative effect size to increase, the effect size remains positive and does not overlap with zero at any point after the first 163 comparisons. We conclude that the impact of publication bias in our study is slight21.
explain the most substantial proportion of variance in the data yet exclude unnecessary parameters that cannot be justified for inference on the basis of the data33. For the randomized GLM fits, we calculated the proportion of times each model was selected as the top-ranked model (pi), on the basis of AICc. We used the per cent deviance explained to represent the structural goodness of fit of each model, with the 95% confidence interval of the per cent deviance explained estimated as the 2.5 and 97.5 percentiles of the 10,000 sample fits. We repeated the above analysis using only data with natural surrounding habitat, and using isolation distance and time since disturbance as additional predictor variables, thus increasing the possible variable combinations to 64 (including the null
model) (Supplementary Table 5). All statistical analyses and figures were made using the program R, version 2.11.1 (ref. 34).
31. Efron, B. & Tibshirani, R. Statistical data analysis in the computer age.Science253, 390–395 (1991).
32. Burnham, K. P. & Anderson, D. R.Model Selection and Multimodel Inference: A Practical Information-Theoretic Approach49–97 (Springer, 2002).
33. Burnham, K. P. & Anderson, D. R. Kullback-Leibler information as a basis for strong inference in ecological studies.Wildl. Res.28,111–119 (2001).
34. R Development Core Team.The R Project for Statistical Computing, version 2.11. 1 Æhttp://www.R-project.orgæ(2011).
Macmillan Publishers Limited. All rights reserved