LABOR DEMAND, PRODUCTIVITY AND
BUSINESS CYCLE:
EVIDENCE FROM PORTUGUESE LARGE FIRMS
Nádia Nogueira Simões
Dezembro de 2004
WP nº 2004/40
DOCUMENTO DE TRABALHO WORKING PAPER
D I N Â M I A
C E N T R O D E E S T U D O S S O B R E A M U D A N Ç A S O C I O E C O N Ó M I C AL
L
A
A
B
B
O
O
R
R
D
D
E
E
M
M
A
A
N
N
D,
D
,
P
P
R
R
O
O
D
D
U
U
C
C
T
T
I
I
V
V
I
I
T
T
Y
Y
A
A
N
N
D
D
B
B
U
U
S
S
I
I
N
N
E
E
S
S
S
S
C
C
Y
Y
C
C
L
L
E:
E
:
E
E
V
V
I
I
D
D
E
E
N
N
C
C
E
E
F
F
R
R
O
O
M
M
P
P
O
O
R
R
T
T
U
U
G
G
U
U
E
E
S
S
E
E
L
L
A
A
R
R
G
G
E
E
F
F
I
I
R
R
M
M
S
S
N
N
á
á
d
d
i
i
a
a
N
N
O
O
G
G
U
U
E
E
I
I
R
R
A
A
S
S
I
I
M
M
Õ
Õ
E
E
S
S
WP nº 2004/40
December 2004
Abstract
What determines the cyclical behaviour of labor productivity? This article considers intra firm and inter firm explanations for the correlation between labor productivity and aggregate shocks. From a set of 2100 Portuguese firms with more than 100 workers, between 1995 and 1999, we found that: (1) aggregate labor productivity was procyclical, although more than half of the firms revealed countercyclical productivity; (2) procyclical intra firm effects were stronger than countercyclical inter firm dynamics; (3) both intra and inter firm theories are important to understand the dynamics of labor productivity; (4) cleansing effects dominated over sullying effects; (5) only a framework integrating several intra firm theories can explain the observed evidence.
KEYWORDS: Labor productivity, business cycle, labor demand, labor mobility
JEL: E32, J23, J24, J60, O47
This paper is in part based on the authors’ Masters’ degree dissertation in Economics, written at Instituto Superior de Economia e Gestão (ISEG), Universidade Técnica de Lisboa (UTL), Lisboa, Portugal. The author is responsible for all errors and omissions. Email: nadia.simoes@iscte.pt
1. Introduction
Labor productivity resumes some of the most important characteristics of modern economic systems. During business cycles, productive efficiency of each firm is influenced by its reactions to unexpected shifts in aggregate demand. This paper focuses the effects of both firms and workers decisions on average productivity.
Several theoretical and empirical contributions have been recently developed to explain the gap between the neoclassical model predictions, according to which labor productivity should be countercyclical, and the results obtained by empirical studies showing that labor productivity had a procyclical pattern. Two sets of theories have arisen to explain the positive association between labor productivity and aggregate demand shocks. The first group (intra firm theories) focuses the decision problem of each firm. The second group (inter firm theories) analyses the impact of worker flows on aggregate productivity fluctuations.
The intra firm approaches were thought from a neoclassic theoretical framework. Although revealing several limitations, the simple modification of some of its hypothesis allows the development of models making different projections for the cyclical behaviour of labor productivity. Models with adjustment costs, scale economies, externalities, labor hoarding and frictions both in product and factors markets have evolved from this basis. These frameworks predict that for firms with certain characteristics labor productivity should be procyclical.
Inter firm theories explore a different source of labor productivity fluctuations: the effects of reallocation of workers between firms with different levels of average productivity. At this level there are two main categories of models, making distinct projections on cyclical behaviour of labor productivity. The first group follows a schumpeterian conception of destructive creation. Recessions are perceived as crucial to economic growth by eliminating least efficient uses of factors. If so productivity of remaining jobs and firms should increase. In upturns, the market conditions by postponing the necessary adjustments reduce the aggregate efficiency. Productivity should follow a countercyclical pattern.
Also in this second stream of theories, focusing a different dynamic, Barlevy (2002) introduced a model to explore the link between the business cycle and the decision of worker to follow job to job strategies. In this framework, during recessions, the decrease of firm’s incentives to open new jobs reduces the probability of least satisfied workers with their current job situation to find an appealing alternative. Meanwhile, expansions represent periods in which firms increase production. The increased number of vacancies would allow unemployed to find better job solutions than in recessions and employed individuals to shift to a perceived better job situation. Simulations by Barlevy suggest that recessions, by mitigating mobility gains, impose a procyclical pattern on productivity.
After reviewing fundamental conclusions extracted from the theories considered we then turn our attention to this kind of processes developed in a data set of firms with more than 100 workers
collected by DETEFP (Departamento de Estatística do Trabalho, Emprego e Formação Profissional), for the portuguese economy (1995-1999).
The type of data necessary to conduct this analysis is only available for a small number of economies. Balanço Social is an annual statistical publication containing the necessary evidence to proceed in such direction1. After a brief resume some of the characteristics of the data set and an examination of productivity behaviour during the cycle, the study proceeds to identify the determinants of its growth rate during the period attended.
Labor productivity was procyclical when determined at the panel level but countercyclical for more than half the firms on the data set. The results show that the within effect gave a stronger contribution to productivity growth than resources reallocation. Furthermore, these two effects seemed to account for opposite contributions to aggregate efficiency. We also found that both intra and inter firm effects were important to explain the dynamics in analysis. Evidence sustained Schumpeterian effects (cleansing effects) in deterrence of sullying effects. Regarding intra firm theories, all the theories seem relevant for specific subgroups of the panel. Only a framework containing all the variants can be considered suitable. The elimination of any theories reduces significantly the framework explanatory capacity.
2. Theoretical framework
This section resumes several theories that account for cyclical behaviour of labor productivity. Both firms and workers are confronted with several shocks forcing them to revaluate their positions in order to determine if their situation still provides the maximum possible rent.
We assume that labor productivity changes over the cycle because firms make decisions regarding resources demanded and also because workers decide to shift between jobs. Regarding the first category of effects, the neoclassical model remains the fundamental reference to explain the behaviour of average labor productivity. Admitting diminishing returns, this model suggest average productivity should be countercyclical.
Recent developments of the neoclassical model consider workers and firms heterogeneity. If we assume demand is conditioned by idiosyncratic forces, firms’ strategies and reactions become subject to its leaders predictions about their firm future. In downturns, a firm might decide to maintain more workers than the necessary to attend to market demand if the firm managers’ expect sufficiently high future expectations. Another possibility to account for procyclical labor productivity would be to admit that technology is characterized by increasing returns.
1 Although Balanço Social contains evidence for the relevant variables, it is only mandatory for firms that employ more than 100 workers at the 31st of December of each civil year. For this reason, even though the present study does not allow us to take generalized conclusions for the portuguese economy (the typical portuguese firm has a much smaller size) it contains relatively detailed data for the segment of firms considered. The conclusions taken are valid only for this group.
In this section we will start by resuming the intra firm explanations to labor productivity fluctuations. After an overview of such approaches we proceed towards inter firm models. In this category, explanations seek to explore the effects of an alternative source of labor productivity fluctuations: the permanent existence of worker flows between jobs. Understanding how this process interacts with aggregate productivity and the influence of common shocks are the last questions to be approached in this section.
2.1. Labor productivity as an intra firm process
Intra firm models will be presented within a theoretical framework focusing firms’ optimization decision problem within a context of uncertainty. The model is developed without making any assumptions on product and labor markets structures. However we admit each firm’ demand function is influenced by aggregate demand shocks. Also common to all models described is the fact that both technology and demand are stochastic processes that in part depend on idiosyncratic forces.
- Neoclassic model of labor demand
The neoclassic model is still the most important reference to describe short run decisions of labor demand. Assuming markets are composed by atomistic firms and homogeneous workers, each firm seeks to maximize profit taking prices and wages as given.
Short run is defined as the period during which capital stock is predetermined. Confronted with an unanticipated demand shift, firms can only adjust employment. Without considering any market frictions or adjustment costs, the firm hires workers until real wage equals the value of marginal productivity of labor.
During expansions, firms increase production by hiring more workers, constantly maintaining their structure according to the first best solution for the optimization problem. But if capital stock does not change by the law of diminishing returns, labor productivity decreases. In this context, labor productivity should be countercyclical.
- Model with labor hoarding
If human capital suffers from a devaluation process, managers have to decide when to upgrade the staff skills. Labor hoarding models account for the necessity to respond to this problem. These theories also admit that more qualified workers can develop both productive and administrative tasks during their schedules, as well as enrol in requalification programs or even accept a remunerated non work situation. The specific strategy each firm selects to respond to unanticipated shifts in demand obviously constrains its productivity distribution over time as well as its decision of how many workers to hire and layoff in each period. It is important to notice that maintaining workers developing activities
with lower degree of exigency or applying less effort in performed tasks induces a reduction of productivity during the period mainly because of the effect of a measurement error.
For a firm, the decision to keep more employees than the necessary to satisfy demand can be rational if sufficiently high levels of demand are anticipated. Following such a strategy (maintaining employment and managing effort through business cycle) implies that during downturns productivity suffers a reduction.
Times of reduced demand represent periods during which opportunity costs of upgrading qualifications are lower. Firms that need to enhance labor force skills will choose such periods to do so. This scheme provides firms the necessary means to have better prepared resources to respond to upturn demand increases. Productivity in organizations enrolling processes with these characteristics should reveal higher than average falls in productivity during recessions and higher increases in expansions.
A firm only adopts a labor hoarding strategy if it expects in near future to expand its worker force. For this group of units productivity should be procyclical.
- Model with adjustment costs
Unanticipated demand shocks change optimal levels of production. However, if changes in the organizational structure involve adjustment costs, firms have to define the degree of adjustment to perform in the production plans and factors demand.
If hiring a number of workers different from the one that would maintain the firm on its average cost curve reduces its efficiency, this model argues that both layoffs and hirings also lead to positive efficiency costs. The decision on the degree of adjustment to perform by each firm will reflect its perspectives regarding future demand and its perception of the shock persistence. In recessions only firms anticipating permanent lower levels of specific demand decide to fire the extra workers. As a result from this decision, their productivity decreases.
During expansions, hirings take place in growing organizational structures. Because workers need time to be completely integrated, adjustment costs reduce productivity. This mechanism induces countercyclical productivity. We conclude that if hirings favour the countercyclical behaviour of labor productivity, layoffs induce the opposite dynamics.
- Model with scale economies
In the long run, if technology has increasing scale then labor productivity is procyclical. In this case it is only necessary to evaluate the short run consequences of admitting this hypothesis.
As in neoclassic model, short run is defined as the period of time during which capital stock is predetermined. Admitting now that its rate of utilization is a decisional variable, focus on factors conditioning its path allows considerations related to the cyclical behaviour of productivity.
Given the complementarities between production factors, we admit that capital rate of utilization depends on labor demanded. In this situation, when firms decide on optimal employment they also attend to equipments rate of utilization. In this context, employment is procyclical as labor productivity.
- Models with externalities
Each firm is integrated in an economic system that affects its performance. In expansions, the dynamics of product markets fosters increases in production for the majority of firms. To attend to these opportunities firms also expand factors demand. Firms first begin the adjustments through a manipulation of the number of hours demanded from each worker. However, every additional hour that a worker offers in an overtime regime exhibits diminishing returns, decreasing average labor productivity.
The next level of adjustment involves hiring additional workers. But given that we are analysing the effects of common shocks, this behaviour will be followed by several other firms. The quality expected of each additional match is necessarily lower.
Defining short run as the period of time during which capital stock is predetermined, for labor productivity to be procyclical, it is necessary that the increase in quantities produced induces an erosion of fixed costs high enough to compensate the increase in variable costs.
Before attending to empirical evidence collected for portuguese firms we explore inter firm explanations of labor productivity.
2.2. Labor productivity as an inter firm process
Inter firm theories focus on a different set of sources of labor productivity cyclical fluctuations. These approaches emphasize the effects of workers decisions to shift jobs on aggregate efficiency. Arguing that aggregate labor productivity can increase not because enterprises registered efficiency gains but because resources flown to more productive jobs.
In this context there are two main categories of theories. The schumpeterian approaches (cleansing effects) for which recessions correct inefficiencies in resources allocation (Hall 1991, 2000; Caballero et al. 1994, 1996; Mortensen et al. 1994; Gomes et al. 1999; Schumpeter, 1942) by demising the surplus of least efficient jobs. Labor productivity would register an increase during downturns. Expansions were expected to produce the opposite contribution to the aggregate efficiency. Articulating both arguments, labor productivity should be countercyclical.
Barlevy (2002) developed a model that focused the role played by cleansing effects on the overall consequences of an aggregate shock. The link between firms’ willingness to hire workers and job flows also determines the dynamics of labor productivity. During recessions, the decrease of firms’ incentives to open new jobs reduces the probability of least satisfied workers with their current jobs to find an alternative professional occupation. On the contrary, expansions represent periods in which
firms increase production and therefore open more vacancies. This process would allow unemployed to find better job solutions than in recessions and employed individuals to shift to perceived better job situations. Simulations by Barlevy suggest that recessions by mitigating mobility gains would precipitate a procyclical pattern to productivity.
New methodologies were developed in order to infer the relative importance of these multiple explanations for cyclical behaviour of labor productivity. It is important to notice that they are not mutually exclusive. In next section we introduce some of these advances in order to increase understanding of the labor productivity dynamics of a set composed by large scale portuguese firms.
3. The dynamics of labor productivity: an analysis for the portuguese economy (1995-1999)
- The data set
In developed economies, labor productivity presents a procyclical pattern. Portugal is not an exception. From data collected at firm level we try to identify the causes behind its fluctuations and determine in what degree aggregate measures of labor productivity reflect with accuracy the microeconomic processes supporting them.
The sample was selected from Balanço Social, a statistical publication from Ministério do Trabalho e da Solidariedade Social (MTSS). The period considered started at 1995 and ended at 1999. Balanço Social is mandatory for firms with more than 100 workers. This defined an unbalanced panel with approximately 1712 firms (Table 1), accounting approximately for 0.9 per cent of all enterprises developing an economic activity in Portugal.
Table 1: The data set in the context of the portuguese economy (1995-1999)
1995 1996 1997 1998 1999 Average Plant size (1), (2), (3) 1 to 99... 26 37 37 30 19 100 to199... 818 (52.20%) 931 (61.00%) 966 (63.50%) 906 (60.80%) 820 (54.60%) 888 (58.40%) 200 to 499... 574 (71.00%) 591 (79.80%) 599 (78.80%) 584 (76.20%) 561 (74.30%) 582 (76.00%) More than 500 ... 226 (86.30%) 239 (86.90%) 251 (95.10%) 243 (89.00%) 238 (83.80%) 239 (88.20%) Panel... 1644 (0.90%) 1798 (0.90%) 1853 (0.90%) 1763 (0.80%) 1638 (0.80%) 1712 (0.90%) Hours (106 hours)... 1090 1160 1190 1170 1130 1148 Employment(4) (103 workers)... 632.4 (14.10%) 661.5 (14.52%) 710.3 (15.35%) 678.3 (14.28%) 650.3 (13.44%) 666.5 (14.33%) Value added (106 euros)... 26300
(37.42%) 25600 (34.20%) 29500 (36.51%) 27900 (32.01%) 24700 (26.61%) 26800 (33.01%)
Source: Banco de Portugal, Relatório Anual (1995-1999) ADN DETEFP, Balanço Social (1995-1999). Notes:
(2) Percentages between parenthesis have resulted from following expression: jt Economy Panel X X , t=1995...1999, where t XX is the
number of firms and j the size class (j jj= under 100 workers; between 100 and 199 workers; between 200 and 499 workers;
more than 500).
(3) Balanço Social is only mandatory to firms with more than 100 workers at the 31st of December. Given that over the year employment varies, there are always a small number of firms that having 100 or more workers at 31 of December, on average, during the year had a number of employees below such level.
(4) Employment was determined from average number of worker.
The fact that all firms in the panel had more than 100 employees does not necessarily present a limitation to the study. The theories discussed admitted that the decisions analysed were determined from a rational optimization exercise. But in a small economy with many very small size firms this hypothesis is not always satisfied. Considering only large scale enterprises is a solution to collect firms with characteristics closer to those admitted in the theories analysed.
Firms from the panel are mainly concentrated in Manufacturing Industry, Trade, Business Services and Construction which account respectively for 56 per cent, 12.2 per cent, 7.4 per cent and 6.5 per cent of total firms.
- Labor productivity during the business cycle (1995-1999)
Measuring labor productivity requires proxies for the value of production and for the value of incorporated resources. In Balanço Social, gross value added is the best available proxy for production value. To quantify labor participation in production process, Balanço Social permits two possibilities: through number of workers and through hours worked. From them we obtain labor productivity per hour (h ValueaddedHours) and labor productivity per worker (w ValueaddedWorkers). Results were obtained considering both but the analysis takes labor productivity per hour by reference.
Conclusions concerning theories reviewed depend on the elasticity of labor productivity to unanticipated shifts in aggregate demand. Procyclical productivity was, by hypothesis, defined in the following terms: Corr (ππ’’t,yy’’t)>0, where ππ’ and ’ yy’’
represent deviations of labor and value added series (in logs) from their time trend.
Another matter to address before following the methodology adopted was the way to introduce the business cycle effects in the model. Regarding this subject we assumed sectors revealed different elasticities to common shocks (Shea, 1993). To attend to such asymmetries we introduced a Downstream Demand Indicator (Dkt), following the methodology of Bartelsman, Caballero and Lyons
(1994)2.
2 The empirical methodological were also developed using output gap to control for the differences between using the suggested Downstream Demand Indicator and a more conventional business cycle representation.
Between 1997 and 2002 for the portuguese economy labor productivity was procyclical. The estimated correlation coefficient between output gap and labor productivity was 0.73.
The results for the panel also favour a procyclical pattern. As expected comparing labor productivity per hour and per worker, we observe that the first revealed a higher elasticity to aggregate demand shocks. The correlation obtained for the economy and for the panel showed these two groups were dissimilar. However, this gap is perfectly justified because firms from the sample do not represent the typical portuguese firm.
Having discussed the cyclical behaviour of labor productivity, in the next section the analysis proceeds to identify inter and intra firm dynamics in labor productivity as well as the particular mechanisms within each of these groups.
4. From intra firm dynamics to reallocation processes
Data collected at the firm level is fundamental to determine if changes in productivity resulted from resource reallocation between firms or if firms had the capacity to move along the productivity distribution.
The methodology of Foster, Haltiwanger e Krizan (1998) provides the means to answer this question. Evidence for aggregate labor productivity was determined by considering an index (tt
n
) obtained through weighted average of individual productivities
(1) it, 1 i it t
s
n 1 i it it it L L swhere itit represents the labor productivity (in logs) of firm i in period i t, t ssitit, the weight assumed by firm i i on the panel during period t and LLitit the number of employees of firm i in i t. Weights (t ssitit
ex4.
) could be derived using several variables. This study uses the number of workers for the aggregate per worker labor productivity index and hours to define the aggregate per hour labor productivity ind
Foster et al. (1998) consider productivity growth rate to result from five different processes: within effect, between effect, cross effect, entry effect and exit effect5. The decomposition follows the equation (2)
firms continuing effect on reallocati effec cross 1 t i, C i t i, 1 t i, t i, effect between 1 t C i 1 t i, 1 t i, t i, effect within 1 t i, C i t i, 1 t i, t s (π π ) (s s )(π Π ) (s s )(π π ) effects on reallocati firms exiting effect exit 1 t S i 1 t ,i 1 t ,i firms entering effects entry 1 t N i t ,i t ,i ( ) s ( ) s
3 A Spearman test to infer if these two series were independent during the period clearly indicated that data did not validate such hypothesis.
4 Recent empirical studies are using weights from participation in employment (Aw et al. 1997, Baily et al. 1992, Foster et al. 2002) or from participation in output (Baily et al. 1997, Foster et al. 2002, Griliches et al. 1995).
where CC is the group of continuing firms (firms in the panel both on periods t and t tt--1); 1 NN the group of entering firms (firms in the panel in period tt but not in tt--1), and 1 SS the group of exiting firms (firms in the panel at tt--11 but not t ). t
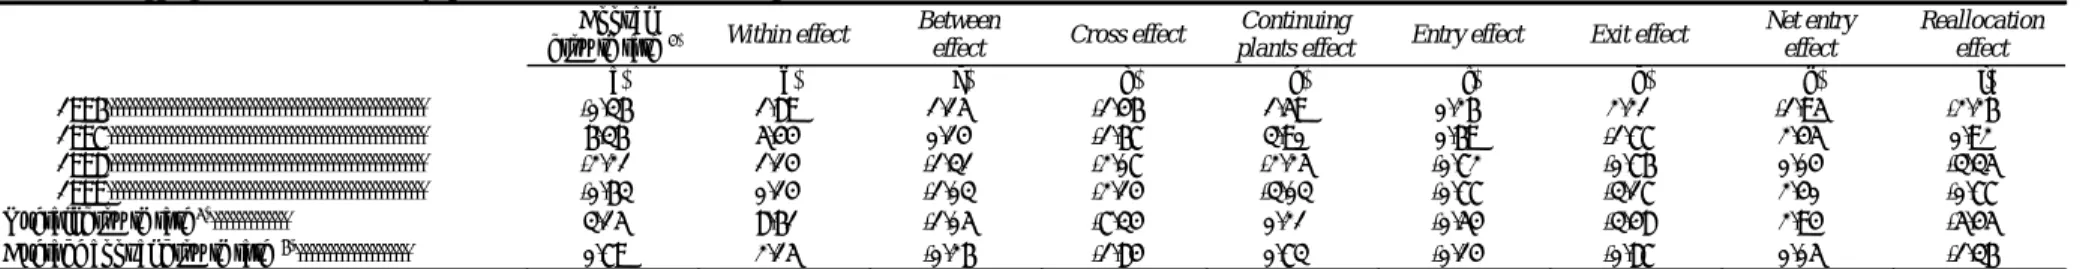
Table 2: Decomposition of Aggregate Labor Productivity Index (1995-1999) (1), (2), (3)
Variant 1: Aggregate Labor Productivity (per hour) Index (individual weights determined from each firm share at total hours worked)
Annual
growth rate (4) Within effect Between
effect Cross effect
Continuing
plants effect Entry effect Exit effect
Net entry effect
Reallocation effect
(a) (b) (c) (d) (e) (f) (g) (h) (i)
1996... -0.36% 1.89% 1.15% -1.46% 1.59% 0.26% 2.21% -1.95% -2.26%
1997... 6.36% 5.44% 0.14% -1.67% 3.90% 0.69% -1.77% 2.45% 0.92%
1998... -2.21% 1.14% -1.31% -2.07% -2.25% -0.72% -0.76% 0.04% -3.35%
1999... -0.63% 0.14% -1.03% -2.14% -3.03% -0.77% -3.17% 2.40% -0.77%
Overall growth rate(5)... 3.15% 8.61% -1.05% -7.34% 0.21% -0.54% -3.48% 2.94% -5.45%
Average annual growth rate (6)... 0.79% 2.15% -0.26% -1.84% 0.73% -0.14% -0.87% 0.05% -1.36%
Variant 2: Aggregate Labor Productivity (per worker) Index (individual weights determined from each firm share at total employment) (1), (2), (3)
Annual
growth rate (4) Within effect Between
effect Cross effect
Continuing
plants effect Entry effect Exit effect
Net entry effect
Reallocation effect
(a) (b) (c) (d) (e) (f) (g) (h) (i)
1996... -0.57% 1.87% 0.24% -0.70% 1.41% 0.51% 2.50% -1.99% -2.44%
1997... -8.77% 3.03% -2.09% -12.37% -11.43% 0.84% -1.81% 2.65% -11.81%
1998... 12.02% 11.36% 12.75% -11.99% 12.12% 0.30% 0.40% -0.10% 0.65%
1999... 1.16% -0.17% -0.37% -1.28% -1.82% -0.66% -3.64% 2.98% 1.33%
Overall growth rate(5)... 3.83% 16.10% 10.53% -26.34% 0.28% 0.99% -2.55% 3.54% -12.27%
Average annual growth rate (6)... 0.96% 4.02% 2.63% -6.59% 0.07% 0.25% -0.64% 0.89% -3.08%
Source: Authors’ calculations using the DETEFP, Balanço Social (1995-1999). Notes:
(1) Firms were separated in three groups: continuing firms (firms in the panel both on periods t and t tt--1); entering plants (firms in the panel in period 1 t but not in t-1 ), and exiting firms (firms in the panel at t tt--11 but not tt ).
(2) Continuing plants effect (e)=(b)+(c)+(d); net entry effect (h)=(f)-(g); reallocation effect: (i)=(c)+(d)+(h).
(3) Aggregate labor productivity Index (tt) was determined by it,
1 i it t
s
n n 1 i it it it L Ls , where iitt represents labor productivity (in logs) of firm ii in period t, t ssit weight of firm ii participation in the panel
employment during period tt, and LLiittlabor of firm i in period i tt.
(4) Annual growth rate (a)=(b)+(c)+(d)+(f)-(g) or t=t-t-1.
(5) Overall growth rate = 96979899.
(6) Average annual growth rate =
4 99 98 97 96 .
This study assumed that within effects reflects intra firm dynamics behind labor productivity and the aggregation of the remaining four terms provides a measure of reallocation effects (inter firm dynamics). From 1995 until 1999, labor productivity (per hour) registered an overall growth of 3.15 per cent (Table 3, Variant 1). However if during the period no reallocation flows took place, within effects would proportionate an overall growth of labor productivity of 8.61 per cent. This means that reallocation effects were important in diminishing the positive contribution of intra firm dynamics to efficiency gains. This negative sign of reallocation flows resulted from the fact that firms registering positive efficiency gains also reduced their participation on aggregate employment.
The evidence for the role played by the net entry effect shows that this effect gave a mixed contribution to the productivity index during the period.
Table 3: Descriptive statistics of employment, labor productivity, and gross value added for
continuing, exiting and entering firms (1995-1999) (1)
Panel (overall) Continuing firms Entrants firms Exiting firms
A. Number of firms 1995……….. 1623 1996……….. 1778 1566 212 250 1997……….. 1832 1640 192 115 1998……….. 1745 1599 146 107 1999……….. 1625 1535 90 250 B. Employment (103 workers) 1995……….. 379 1996……….. 363 380 236 485 1997……….. 380 395 254 208 1998……….. 383 397 235 234 1999……….. 392 402 221 274
C. Gross value added (103 euros)
1995……….. 16099
1996……….. 14109 14575 10665 43607
1997……….. 15856 16437 10897 4562
1998……….. 15779 16374 9262 8070 1999……….. 14946 15409 7045 7448 D. Labor productivity per hour (euros)
1995……….. 16.38
1996……….. 14.94 15.04 14.15 39.45
1997……….. 16.70 16.22 20.85 11.61
1998……….. 18.02 17.44 24.38 14.69
1999……….. 16.42 16.64 12.69 22.02
Source: Authors’ calculations using the DETEFP, Balanço Social (1995-1999).
Note: (1) Firms were separated in three groups: continuing – group of firms integrating the panel in t-1 e t; entrants – group of firms in the panel at t but not at t-1; exiting firms – firms in the panel at t-1, but not at t.
If previous analysis were conducted for labor productivity per worker, all conclusions would still be valid. However we observe that the magnitude of every effect is higher when derived from productivity per worker. This evidence suggests that hours presented higher contemporaneous correlation with business cycle than the number of workers.
This decomposition shows the risks of developing a study using only aggregate indicators. The evidence found an annual aggregate labor productivity growth of 0.8 per cent. This value resulted from a contribution of a within term of 2.15 per cent and a negative reallocation effect of 1.3 per cent but many other situations could explain the 0.8 per cent growth rate of aggregate labor productivity.
Before proceeding it is important to resume the enhanced conclusions. First, the possibility that aggregate labor productivity growth resulted strictly from shifts of resources between firms with different productivity levels is far from being right. The within effect not only assumed a determinant role but also revealed the capacity to increase the efficiency of the group, having the capacity to overstate the sizable negative reallocation effects.
Secondly, firms accounting for highest efficiency gains reduced their participation in overall employment. The losses induced from this reallocation process annulated the benefits produced by net entry. Given these two conclusions we can say that cyclical fluctuations of labor productivity resulted both from intra and inter firm dynamics. To further explore these dynamics we attended to their correlation with aggregate shocks by calculating Pearson correlation coefficients.
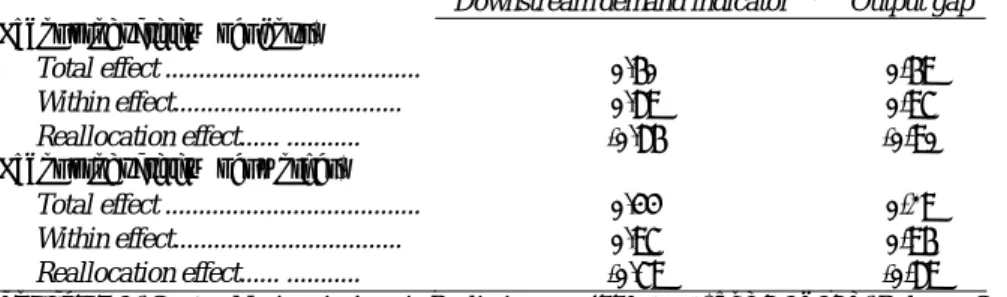
Table 4: Contemporaneous correlation coefficients between labor productivity growth and unanticipated shifts in aggregate demand (1995-1999)
Downstream demand indicator (1) Output gap
Labor productivity (per hour)
Total effect ... 0.60 0,69
Within effect... 0.89 0,97
Reallocation effect... ... -0.86 -0,90 Labor productivity (per worker)
Total effect ... 0.44 0,29 Within effect... 0.97 0,96 Reallocation effect... ... -0.79 -0,89
Source: INE, Contas Nacionais Anuais Preliminares (1995-2002) and DETEFP, Balanço Social (1995-1999). Notes:
(1) On Downstream Demand Indicator see Bartelsman et al. (1994).
(2) Output gap was determined by extracting the estimated time trend from value added at market prices in logs (calculated on the basis of 1995 constant prices)
The negative correlation between reallocation effect and demand shocks favours the Schumpeterian perspective of creative destruction. Sullying effects approach becomes a difficult theory to validate in this context.
The last question to be attended by this paper concerns the applicability of neoclassical model and its variants to account for within dynamics of labor productivity. Section 5 will address this topic.
5. Intra firm dynamics and labor productivity cyclical fluctuations
Decompositions of aggregate labor productivity index recognized that intra firm processes were crucial to determine labor productivity growth rate during the period. The relevance of each microeconomic model depends on the correlation that individual labor productivity fluctuations established with aggregate demand shifts.
In order to find evidence to evaluate these alternatives we follow Baily, Bartelsman and Haltiwanger (1997) methodological approach. The first step is the estimation of the equation
where is the logarithm of labor productivity, t the time trend and t XX a vector with variables describing economic activity, geographic localization and legal form of each firm6. By removing the
time trend from labor productivity series, we obtain a measure for the cyclical behaviour of labor productivity.
What factors explain productivity deviations from its’ long run trend? Production plans and labor demand are determined by firms from a prediction about their future. Obtaining evidence for long run equilibrium is a difficult task. Considering the possibilities offered by Balanço Social, we decided to extract indications concerning such dimension by articulating employment7 and labor
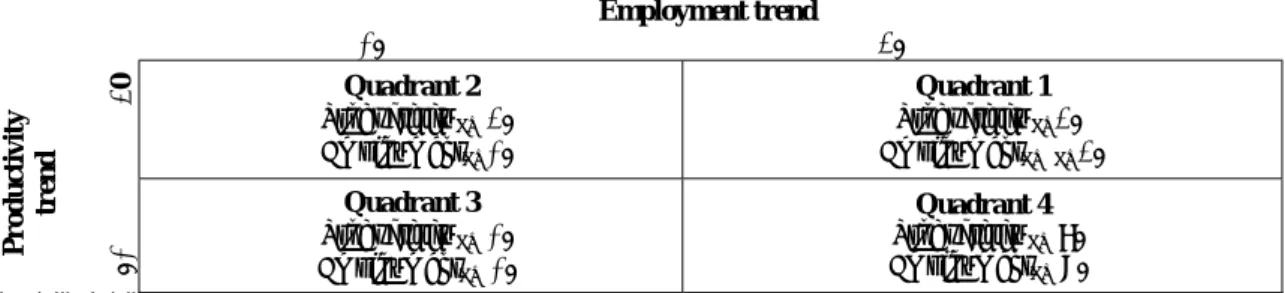
productivity linear trends (Baily et al. (1997)). From this approach we identified four scenarios (quadrants) to which a firm could be assigned:
Figure 1: Feasible set of long run equilibriums
Employment trend 0 0 Quadrant 2 ∂ProductivityLR 0 ∂EmploymentLR0 Quadrant 1 ∂ProductivityLR0 ∂ EmploymentLRLR0 Productivity tr end 0 0 Quadrant 3 ∂ProductivityLR 0 ∂EmploymentLR 0 Quadrant 4 ∂ProductivityLR <0 ∂EmploymentLR >0 Source: Baily et al. (1997)
Note: EmploymentLR and ProductivityLR are the estimated coefficients of employment and labor productivity time trends
From applying the algorithm of Figure 1 to the panel in analysis we obtain the segmentation presented at Figure 2.
Figure 2: The panel and long run equilibrium (1), (2), (3)
Employment trend(4) l i ^ <0 i ^ >0 i ^ >0 Q2 (27.45%)579 Q1 614 (29.11%) 1217 (56.56%)
Labor productivity (per hour) h i ^ <0 Q3 (19.30%)407 Q4 509 (24.13 %) 892 (43.43%) 983 (46.75%) 1126 (53.24%) 2109
Source: Authors’ calculations using DETEFP, Balanço Social (1995-1999). Notes:
(1) The percentages displayed between parentheses represent the relative importance of firms from quadrant qq
(q=1,2,3,4)
in the total number of firms considered.
6 This vector includes eight sectorial dummy variables (Agriculture, forestry and fishing; Industry; Energy; Construction; Trade, restaurants and hotels; Transportation and communication; Business services; other services), seven dummies for geographic localization (Norte; Centro; Lisboa e Vale do Tejo; Alentejo; Algarve; Açores; Madeira) and three dummies for legal form (corporation, partnership, others).
7 Employment time trend was determined by estimating
ts + i (2) The coefficien and i were determined by estimating the equations: i
^ ^
it=ai βiXi+ t+it and it=bi+ X'i i+λit+i where represents the logarithm of labor productivity and the logarithm of workers at firm i, t the time trend and X a vector including eight for sectorial dummies (Agriculture, forestry and fishing; Industry; Energy;
Construction; Trade, Restaurants and Hotels; Transportation and communication; Business services; other services), seven regional dummies (Norte; Centro; Lisboa e Vale do Tejo; Alentejo; Algarve; Açores; Madeira) and three dummies for
t
X
). legal form (corporation, partnership, others (3) All equations were estimated by OLS.
(4) Employment was determined from average number of worker.
From all categories, the quadrant where firms exhibited positive employment and productivity trends (quadrant 3) accounted for the highest proportion of panel. The percentage of firms becoming more efficient (56.6 per cent) was larger than those expanding their size (53.3 per cent). This indicates that, during the period, some resources were reallocated to occupations less productive uses.
Table 5 presents a descriptive summary of value added, hours, employment and labor productivity trends for the set of firms integrated in each quadrant.
Table 5: Value added, employment, labor productivity trends by quadrant (1), (2), (3), (4)
Quadrant (5)
Results derived from linear trend of each variable 1 2 3 4 0.1478 0.0172 -0.1681 -0.0150 Value added... (0.1595) (0.1092) (0.2665) (0.2080) 0.0359 -0.0845 -0.0279 0.1165 Hours worked... (0.1245) (0.1121) (0.1476) (0.1618) 0.0867 -0.0692 -0.0682 0.0991 Employment... (0.1326) (0.0997) (0.1225) (0.1304) 0.1119 0.1017 -0.1425 -0.1359 Labor productivity (per hour)...
(0.1324) (0.1091) (0.2618) (0.2175) 0.0609 0.0862 -0.0999 -0.1147 Labor productivity (per worker)…...
(0.1297) (0.1212) (0.2535) (0.1994) Source:
No
Authors’ calculations using DETEFP, Balanço Social (1995-1999). tes:
(1) Values displayed are averages by quadrant of coefficients estimated for time trends of each variable logarithm. Regressors include a time trend, eight dummies (Agriculture, forestry and fishing; Industry; Energy; Construction; Trade, Restaurants and hotels; Transportation and communication; Business services; other services), seven regional dummies (Norte; Centro; Lisboa e Vale do Tejo; Alentejo; Algarve; Açores; Madeira) and three dummies for legal form (corporation, partnership, others).
Social at least two times between 1995 and 1999
(2) The sample integrates 2109 firms that answered to Balanço inary least squares. (3) All estimations obtained by ord
(4) Standard errors in parenthesis.
(5) Quadrants defined following Baily et al. (1997). See Figure 1 for a summary of the criterions adopted.
To analyse the connection between long run equilibrium and short run decisions, Baily et al. (1997) use the previous information by defining four dummies (Iqi)
I1i=1 if i 0 and 0, I ^ ^i 1i=0 otherwise; I2i=1 if i <0 and 0, I ^ ^i 2i=0 otherwise; I3i=1 if i <0 and <0, I ^ ^i 3i=0 otherwise;
(4) I4i=1 if i 0 and <0, I ^
^i 4i=0 otherwise
where i a
^
anndd is the estimated coefficients for labor productivity and employment time trends. ^i
To determine if all firms presented equal deviations from its trend we estimated
(5) it 4 1 q qi q i i i it) d X I var(
where IIqiqi is a variable introduced to resume each firm steady state (long run equilibrium). Comparing the estimations of we can infer if quadrants revealed identical elasticity to business cycle. Table 6 presents the results of the estimation.
q
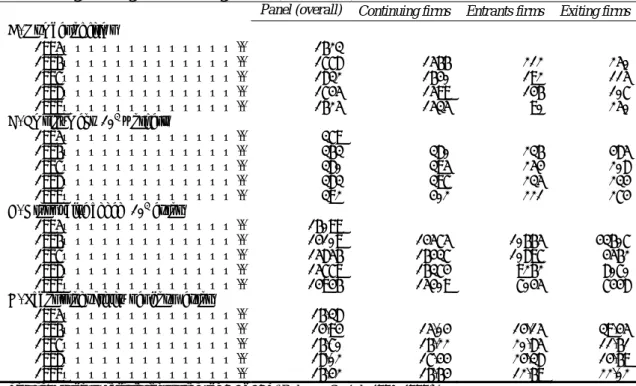
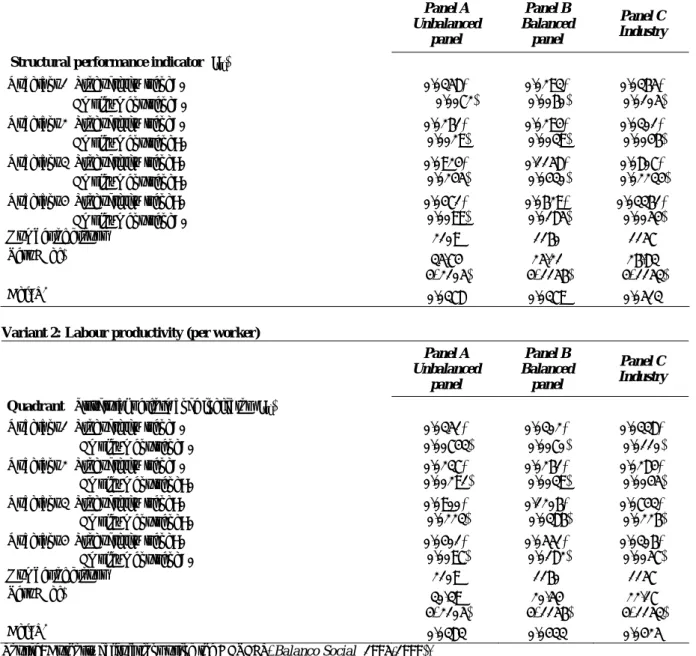
Table 6: Elasticity of labor productivity degree to business cycle (1), (2), (3), (4), (5) Variant 1: Labor productivity (per hour)
Panel A Unbalanced panel Panel B Balanced panel Panel C Industry
Structural performance indicator (Iqi)
Quadrant 1 Productivity trend>0 0.0358* 0.0293* 0.0365* Employment trend>0 (0.0072) (0.0060) (0.0105) Quadrant 2 Productivity trend>0 0.0261* 0.0294* 0.0301*
Employment trend<0 (0.0029) (0.0039) (0.0046) Quadrant 3 Productivity trend<0 0.0924* 0.1158* 0.0807*
Employment trend<0 (0.0245) (0.0430) (0.02234) Quadrant 4 Productivity trend<0 0.0471* 0.0629* 0.03361*
Employment trend>0 (0.0099) (0.0185) (0.0054) Number of groups 2109 1160 1157 Test F (df) 35.74 25.21 26.83 (4, 2105) (4, 1156) (4, 1153) Adj. R2 0.0378 0.0379 0.0513 Variant 2: Labour productivity (per worker)
Panel A Unbalanced panel Panel B Balanced panel Panel C Industry
Quadrant Structural performance indicator (Iqi)
Quadrant 1 Productivity trend>0 0.0351* 0.0302* 0.0338* Employment trend>0 (0.00743) (0.0070) (0.0110) Quadrant 2 Productivity trend>0 0.0237* 0.0261* 0.0284*
Employment trend<0 (0.00291) (0.0039) (0.0045) Quadrant 3 Productivity trend<0 0.0900* 0.1206* 0.0743*
Employment trend<0 (0.0223) (0.0386) (0.0226) Quadrant 4 Productivity trend<0 0.0401* 0.0551* 0.0306*
Employment trend>0 (0.0097) (0.0182) (0.0057)
Number of groups 2109 1160 1157
Test F (df) 30.39 20.54 22.17
(4, 2105) (4, 1156) (4, 1153)
Adj. R2 0.0383 0.0433 0.0425
Notes:
(1) Results were derived using three different panels: Panel A,, the unbalanced panel, integrating the 2109 firms that answered to Balanço Social at least two years from 1995 to 1999; Panel B, the balanced panel, with 1160 firms that answered to Balanço Social in all years of the period from 1995 to 1999; and Panel C, with the 1157 firms from the industrial sector.
(2) Dependent variable: labor productivity (in logs).
Regressors include besides the time trend a set of eight sectorial dummies (Agriculture, forestry and fishing; Industry; Energy; Construction; Trade, restaurants and hotels; Transportation and communication; Business services; Other services), seven regional dummies (Norte; Centro; Lisboa e Vale do Tejo; Alentejo; Algarve; Açores; Madeira) and three dummies for legal form (corporation, partnership, others).
(3) * 1% significance level ** 5 % significance level; *** 10 % significance level
(4) All estimations obtained by ordinary least squares. (5) Standard errors in parenthesis
Table 6 (first column) shows that labor productivity of firms from the third quadrant exhibit much stronger deviations from its trend then firms in the remaining quadrants (conclusions are independent from the proxy used to measure labor productivity – productivity per worker or per hour - although fluctuations are much more pronounced using labor productivity per hour than labor productivity per worker). To find if conclusions were affected by choices made to determine which firms to consider for analysis, two other samples were defined: the balanced panel (panel B) and the set of industrial firms (Panel C). The results in Table 6 seem to exclude such possibility.
To evaluate the relative importance of each intra firm theory we then estimated the elasticity of labor productivity to business cycle shocks:
(6) ijt it 4 1 q qi q i it I D
where DDikiktt is the Downstream Demand Indicator for sector kk within which firm ii developed activity in period tt
. By applying a fixed estimator to previous equation we obtained the results presented below8.
8 Given the importance of to final conclusions, the selection of the estimator was carefully addressed. The small number of observations for each group (firm) and from Hausman specification tests favoured the selection of the fixed effects estimator.
q ^
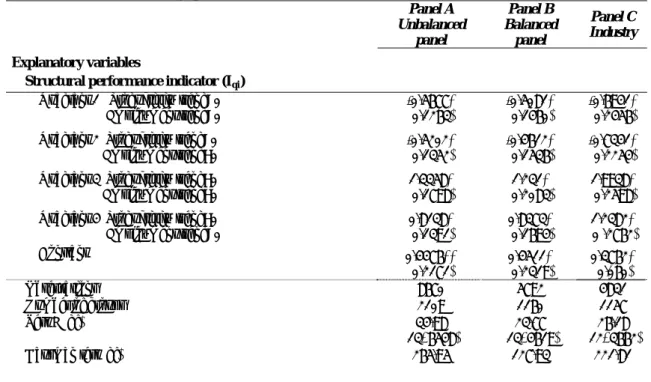
Table 7: Correlation between labor productivity and business cycle (1), (2), (3), (4), (5)
Variant 1: Labor Productivity (per hour)
Panel A Unbalanced panel Panel B Balanced panel Panel C Industry Explanatory variables
Structural performance indicator (Iqi)
Quadrant 1 Productivity trend>0
Employment trend>0 -0.5677* (0.1263) -0.5081* (0.1460) -0.6941* (0.2456) Quadrant 2 Productivity trend>0
Employment trend<0 -0.5202* (0.1352) -0.4612* (0.1536) -0.7341* (0.2254) Quadrant 3 Productivity trend<0
Employment trend<0 (0.1798) 1.3358* (0.2083) 1.231* (0.2598) 1.9938* Quadrant 4 Productivity trend<0
Employment trend>0 0.8138* (0.1391) 0.8373* (0.1694) 1.2382* (0 .2762) Constant 0.4476** 0.4511* 0.3762* (0.2171) (0.2319) (0.060) Observations 8670 5792 4831 Number of groups 2109 1160 1157 Test F (df) 34.98 23.77 26.18 (13, 6548) (13, 4619) (12, 3662) Hausman test (df) 265.95 127.93 221.81
Variant 2: Labor Productivity (per worker)
Panel A Unbalanced panel Panel B Balanced panel Panel C Industry Explanatory variables
Structural performance indicator (Iqi)
Quadrant 1 Productivity trend>0
Employment trend>0 -0.4430* (0.1239) -0.3837* (0.1450) -0.6373* (0.2378) Quadrant 2 Productivity trend>0
Employment trend<0 -0.3745* (0.1326) -0.2832*** (0.1527) -0.6964* (0.2183) Quadrant 3 Productivity trend<0
Employment trend<0 (0.1762) 0.8568* (0.2069) 0.7496* (0.2514) 1.1419* Quadrant 4 Productivity trend<0
Employment trend>0 0.6709* (0.1363) 0.7237* (0.1683) 0.9397* (0.2669) Constant 0.5027** (0.2129) 0.5205** (0.2304) 0.4702* (0.0601) Observations 8673 5793 4833 Number of groups 2109 1160 1157 Test F (df) 30.46 21.28 23.40 (13, 6551) (13, 4620) (12, 3664) Hausman test (df) 282.34 (13) 156.67 (13) 226.60 (12) Source: Authors’ calculations using DETEFP, Balanço Social (1995-1999).
Notes:
(1) Results were derived using three different panels: Panel A, the unbalanced panel, integrating the 2109 firms that answered to Balanço Social in at least two years from 1995 to 1999; Panel B, the balanced panel with 1160 firms that answered to Balanço Social in all years of the period from 1995 to 1999; and Panel C, with the 1157 industrial firms. (2) Dependent variable: labor productivity (in logs).
Regressors include besides the time trend a set of eight sectorial dummies (Agriculture, forestry and fishing; Industry; Energy; Construction; Trade, Restaurants and Hotels; Transportation and communication; Business services; other services), seven regional dummies (Norte; Centro; Lisboa e Vale do Tejo; Alentejo; Algarve; Açores; Madeira) and three dummies for legal form (corporation, partnership, others).
(3)* 1% significance level ** 5 % significance level;
*** 10 % significance level
(4) All estimations obtained by ordinary least squares. (5) Standard errors in parenthesis
Firms established very different relations with aggregate demand shocks. Firms revealing a positive trend in labor productivity have countercyclical productivity. However, firms for which we expect productivity to decrease, productivity fluctuations presented a positive correlation with business cycle.
We can also conclude that procyclical mechanisms behind productivity were stronger than those favouring counter cyclicality (this conclusions can be accessed by confronting the absolute values of the estimated coefficients for 1 and 2 with those obtained for 3 and 4).
A careful examination of results reported at Table 7, using the neoclassical theory and following variants, allows several remarks. Evidence does not attest to any of these possibilities the capacity to completely explain the cyclical behaviour of labor productivity. Adjustment costs and labor hoarding models assume an association between size trends and cyclical behaviour of labor productivity. Given that elasticity of labor productivity for firms from quadrant 1 (quadrant 2) has the symmetric sign from quadrant 4 (quadrant 3), these explanations cannot completely account for the processes reported.
Because labor productivity is countercyclical in some quadrants and procyclical in others, the model with externalities does not fit with accuracy data in analysis. Because for 57% of the sample productivity was found to be countercyclical, we studied the possibilities offered by neoclassical theory to interpret evidence in examination. However, given the estimated coefficients this hypothesis was not confirmed.
An interpretation of the results by quadrant provides a different insight to labor productivity dynamics in the panel, enhancing our ability to identify its causes. In the first quadrant, the neoclassical model seems to fit the type of correlation estimated. Adjustment costs and labor hoarding models are clearly far from having space in this context.
For firms in quadrant 2, reductions in size were associated to efficiency gains. Estimated models suggest the existence of a negative association between labor productivity and aggregate demand shifts. As before, the neoclassic model seems to be the best instrument to explain this dynamic.
Results for quadrant 3 favour the model with adjustment costs. And because at the aggregate level, labor productivity was found to be procyclical, we can say that the existence of adjustment costs assumed a crucial role in determining the cyclical behaviour of this variable for Portuguese economy. In this quadrant results also contribute to assign some relevance to models with internal scale economies.
Finally, in quadrant 4 estimated coefficients attest some relevance to labor hoarding model. To resume previous indications we can say that all intra firm models seem to have had an important role in explaining the procyclical behaviour of labor productivity.
6. Conclusions
This paper attempted to establish a link between recent theories concerning labor productivity cyclical behaviour. Empirical evidence showing that labor productivity was not countercyclical as predicted by neoclassic models but rather procyclical led to several theoretical and methodological developments on this matter.
Models associate changes in labor productivity with two different sources: reallocation of factors between firms with different productivity levels and the capacity of firms, given several constraints, to manage labor demand. In both groups some theories predict productivity to be countercyclical while others point to the opposite scenario. In the first group we can find theories pointing to the existence of cleansing effects and sullying effects. The second group integrates microeconomic models such as the neoclassical model as well as variants such as labor hoarding, adjustment costs, scale economies and externalities.
Most studies in this area tend to focus on intra firm or inter firm approaches, in order to determine which specific alternative better suits the data. This paper tries to escape such common place and articulates several methodologies to determine the role assumed by each possibility (independently from its source). The statistical data available for Portugal, collapsed at Balanço Social, allowed us to construct a panel of 2100 firms with more than 100 workers for which information concerning labor demand was available. The period considered for analysis started in 1995 and ended at 1999.
Results pointed that intra firm effects were stronger than inter firm. Aggregate labor productivity average annual growth of 0.8 per cent resulted from a contribution of 2.15 per cent from changes in internal dynamics and the negative effect of 1.36 per cent from reallocation flows. This outcome recognized the importance of intra and inter firm dynamics to explain the cyclical behaviour of labor productivity.
The correlation between reallocation effect and unanticipated shifts in aggregate demand was positive, suggesting schumpeterian effects had been stronger than sullying effects.
The analysis of intra firm dynamics followed closely the methodology of Baily et al. (1997). Through results obtained from their procedure we found that firms in the panel were strongly heterogeneous. More than half of the firms presented countercyclical productivity (56.7 per cent of the total). Nevertheless, procyclical dynamics revealed a much higher elasticity to the cycle than the previous.
Given the specificities of the firms integrating this panel both neoclassic approach as well as its variants seem important to account for the captured processes.
Several issues about cyclical behaviour of labor productivity remain unanswered. The importance of labor productivity to social welfare is sufficient motivation to increase efforts to dissipate the doubts involving its dynamics.
References
Abel, A. and Eberly, J. (1994), An Unified Model of Investment under Uncertainty, American Economic Review, 84, pp. 1369-1384.
Aw, B., Chen, X. and Roberts, M. (1997), Firm-Level Evidence on Productivity Differentials, Turnovers, and Exports in Taiwanese Manufacturing, NBER Working Paper Nº 6235.
Baily, M., Bartelsman, E. and Haltiwanger, J. (1997), Labor Productivity: Structural Change and Cyclical Dynamics, NBER Working Paper Nº 5503.
Baily, M., Hulten, C. and Campbell, D. (1992), Productivity Dynamics in Manufacturing Firms, Brookings Papers on Economic Activity, pp. 187-267.
Barlevy, G. (2002), On the Timing of Innovation in Schumpeterian Growth Models, Mimeo, Northwestern University.
Barlevy, G. (2002), The Sullying Effect of Recessions, The Review of Economic Studies, 69, pp. 65-96.
Bartelsman, E. and Doms, M. (2000), Understanding Productivity: Lessons from Longitudinal Microdata, Journal of Economic Literature, 38, pp. 569-594.
Bartelsman, R., Caballero, J. and Lyons, R. (1994), Customer and Supplier Driven Externalities, American Economic Review, 34, pp. 1075-1084.
Basu, S. (1996), Procyclical Productivity: Increasing Returns or Cyclical Utilization?, Quarterly Journal of Economics, 111, pp. 719-751.
Bean, C. (1990), Endogenous Growth and the Procyclical Behaviour of Productivity, European Economic Review, 34, pp. 355-363.
Boeri, T. (1996), Is Job Turnover Countercyclical?, Journal of Labor Economics, 14, pp. 603–625. Burnside, C. and Eichenbaum, M. (1996), Factor Hoarding and the Propagation of Business Cycle
Shocks, American Economic Review, 86, pp. 1154-1174.
Burnside, C., Eichenbaum, M. and Rebelo, S. (1993), Labor hoarding and the Business Cycle, Journal of Political Economy, 101, pp. 245-273.
Caballero, R. (1992), A Fallacy of Composition, American Economic Review, 82, pp. 1279-1292. Caballero, R. and Hammour, M. (1994), The Cleansing Effect of Recessions, American Economic
Review, 84, pp. 1350-1368.
Caballero, R. and Hammour, M. (1996), On the Timing and Efficiency of Creative Destruction, Quarterly Journal of Economics, pp. 805-852.
Campbell, J. and Fisher, J. (1996), Aggregate Employment Fluctuations with Microeconomic Asymmetries, Institute for Empirical Macroeconomics, Discussion Paper Nº112.
Campbell, J. and Fisher, J. (1996), Macroeconomic Effects of Employment Reallocation, Carnegie-Rochester Conference Series on Public Policy, 44, pp. 87-116.
Cooper, R. and Willis, J. (2001), The Economics of Labor Market Adjustment: Mind the Gap, NBER Working Paper Nº 8527.
Davis, S. and Haltiwanger, J. (1990), Gross Job Creation and Destruction: Macroeconomic Evidence and Macroeconomic Implications, in: NBER Macroeconomics Annual, pp. 123-168.
Davis, S. and Haltiwanger, J. (1999), Gross Job Flows, in: O. Ashenfelter and D. Card (ed.), Handbook of Labor Economics, Vol. 3B, Amsterdam: North-Holland.
Davis, S. and Haltiwanger, J. (1999), On the Driving Forces Behind Cyclical Movements in Employment and Job Reallocation, American Economic Review, 89, pp.1234-1258.
Davis, S., Haltiwanger, J. and Schuh, S. (1996), Job Creation and Destruction, Cambridge: MIT Press.
DeLong, J. and Waldmann, R. (1997), Interpreting Procyclical Productivity Movements: Evidence from a Cross-Nation Cross-Industry Panel, Federal Reserve Bank of San Francisco Economic Review, 1, pp. 33-52.
Dial, J. and Murphy, K. (1995), Incentives, Downsizing and Value Creation in General Dynamics, Journal of Financial Economics, 37, pp. 261-314.
Dixit, A. and Pindyck, R. (1994), Investment under Uncertainty, Princeton: Princeton University Press.
Dunne, T., Roberts, M. and Samuelson, L. (1989), Plant, Turnover and Gross Employment Flows in the U.S. Manufacturing Firms, Journal of Labor Economics, 7, pp. 48-71.
Dunne, T., Roberts, M. and Samuelson, L. (1989), The Growth and Failure of U.S. Manufacturing Plants, Quarterly Journal of Economics, 104, pp.671-698.
Figura, A. (2002), Is the Reallocation Related to the Cycle? A Look at Permanent and Temporary Job Flows, Board of Governors of the Federal Reserve System Working Paper Nº 16/2002.
Figura, A. (2002), The Cyclical Behaviour of Short Term and Long Term Job Flows, Board of Governors of the Federal Reserve System Working Paper Nº 12/2002.
Foote, C. (1998), Trend Employment Growth and the Bunching of Job Creation and Destruction, Quarterly Journal of Economics, 113, pp. 809-834.
Foster, L., Haltiwanger, J. and Krizan, C. (1998), Aggregate Productivity Growth: Lessons from Microeconomic Evidence, NBER Working Paper Nº 6803.
Foster, L., Haltiwanger, J. and Krizan, C. (2002), The Link between Aggregate and Micro Productivity Growth: Evidence from Retail Trade, NBER Working Paper Nº 9120.
Gordon, R. (1990), Are Procyclical Productivity Fluctuations a Figment Measurement Error, Northwestern University.
Griliches, Z. and Regev, H. (1992), Productivity and Firm Turnover in Israel Industry: 1979-1988, NBER Working Paper Nº 4059.
Griliches, Z. and Ringstad, V. (1971), Economies of Scale and the Form of the Production Function, Amsterdam: North Holland.
Griliches, Z., and Regev, H (1995), Productivity and Firm Turnover in Israeli Industry: 1979-1988, Journal of Econometrics, 65, pp. 175-203.
Hall, R. (1991), Labor Demand, Labor Supply, and Employment Volatility, in: NBER Macroeconomics Annual, Cambridge: MIT Press.
Hall, R. (2000), Reorganization, Carnegie-Rochester Conference Series on Public Policy.
Hammermesh, D. and Pfann, G. (1996), Adjustment Costs in Factor Demand, Journal of Economic Literature, 34, pp. 1264–1292.
Hopenhayn, H. (1992), Entry, Exit and Firm Dynamics in Long Run Equilibrium, Econometrica, 60, pp. 1127-1150.
Kettle, T. and Mathiassen, A. (1996), Job Creation, Job Destruction and Plant Turnover in Norvegian Manufacturing, Annales D’Economie et de Statistique, 41-42, pp. 97-125.
Lilien, D. (1982), Sectoral Shifts and Cyclical Unemployment, Journal of Political Economy, 90, pp. 777-793.
Maliranta, M. (2001), Productivity Growth and Micro-Level Restructuring. Finnish Experiences during the Turbulent Decades, The Research Institute of the Finnish Economy Discussion Papers Nº 757.
Mortensen, D. and Pissarides, C. (1994), Job Creation and Job Destruction in the Theory pf Unemployment, Review of Economic Studies, 61, pp. 397-415.
Nilsen, O., Salvanes, K. and Schiantarelli, F. (2002), Employment Changes, the Structure of Adjustment Costs, and Firm’s’ Size, Norwegian School of Economics and Business Administration Working Paper.
Oi, W. (1962), Labor as a Quasi-fixed Factor, Journal of Political Economy, 70, pp. 538-555.
Saint-Paul, G. (1993), Productivity Growth and the Structure of the Business Cycle, European Economic Review, 37, pp. 861-883.
Schuh, S. and Triest, R. (2000), The Role of Firms in Job Creation and Destruction in U.S. Manufacturing, New England Economic Review, pp. 29-44.
Schumpeter, J. (1939), Business Cycles, New York: McGraw-Hill.
Schumpeter, J. (1942), Capitalism, Socialism and Democracy, New York: Harper and Brother. Shapiro, M. (1993), Cyclical Productivity and the Workweek of Capital, American Economic Review,