Article
0103 - 5053 $6.00+0.00
*e-mail: [email protected]
Multiresidue Determination of Pesticides in Drinking Water by Gas Chromatography-Mass
Spectrometry after Solid-Phase Extraction
Guilherme P. Sabin, Osmar D. Prestes, Martha B. Adaime and Renato Zanella*
Departamento de Química, Universidade Federal de Santa Maria, 97105-900 Santa Maria-RS, Brazil
Neste trabalho, um método usando extração em fase sólida e cromatografia a gás acoplada à espectrometria de massas no modo de monitoramento seletivo de íons, foi desenvolvido e validado para a determinação multiclasse de 20 pesticidas regulados pela legislação brasileira para água potável. Como estes pesticidas devem ser determinados em baixas concentrações, um elevado fator da pré-concentração associado à sensibilidade elevada da análise cromatográfica foi necessário. O método apresentou limites de quantificação entre 0,003 e 0,093 µg L-1. A maioria dos compostos apresentou recuperações médias entre 51 e 116%. Embora a natureza química distinta dos pesticidas analisados dificulte a obtenção de boa recuperação para todos os compostos avaliados, a precisão dos resultados foi excelente. A seletividade do método foi avaliada através da intensidade relativa dos íons de quantificação e de qualificação, sendo considerada adequada. A análise em amostras reais cumpriu os critérios para a qualificação instrumental e a avaliação da conformidade do sistema.
In this work, a method using solid-phase extraction and gas chromatography coupled mass spectrometry in the selective ion monitoring (SIM) mode was developed and validated for the multi-class determination of 20 pesticides regulated by the Brazilian legislation for drinking water. Because these pesticides must be determined at low concentrations, a high preconcentration factor associated to the high sensitivity of chromatographic analysis was necessary. The method presented quantification limits between 0.003 and 0.093 µg L-1. Most of the compounds presented mean recoveries between 51 and 116%. Although the differing chemical nature of the pesticides analyzed difficult the attainment of good recovery for all of the compounds evaluated, the precision of the results was excellent. The selectivity of the method was evaluated through the relative intensity of quantification and qualification ions and was considered adequate. Analysis in real samples met criteria for instrumental qualification and the system suitability evaluation.
Keywords: solid-phase extraction, GC-MS, pesticide, multiresidue, water
Introduction
Although pesticides increase agricultural productivity, their use can produce serious environmental problems through the contamination of water resources. Therefore, legal limits and alert levels for drinking water have been introduced.1 In Brazil, the Ministry of Health, through
Regulation MS 518 of March 25, 2004 established procedures and requirements for the control and vigilance of water quality for human consumption and drinking water standards, including limits for some pesticide residues.2 The
European Union (EU) Directive on the quality of drinking water has set the maximum admissible concentrations of each pesticide at 0.1 µg L-1, and the total concentration of
all pesticides at 0.5 µg L-1.3 The WHO threshold values
for concentrations of pesticides in drinking water, based on toxicological considerations, are less strict than the maximum concentrations allowed by EU.1
Although the importance of the determination of pesticide residues in drinking water, only few works with samples from Brazil were published and most studies were focused on a limited scope like organochlorine pesticides4,5
and triazine herbicides.6,7
In this work, pesticides were chosen based on their necessity for regulation in water for human consumption as established by current Brazilian legislation. The pesticides selected (Figure 1) present quite distinct physicochemical and chromatographic characteristics.
environmental,8 but they also provide important information
as to behavior during the stages of preconcentration, solvent evaporation, stability in water and adsorption on organic material present in the samples. For chromatographic determination it is necessary to investigate the analytes’ physicochemical properties to achieve high selectivity and sensitivity. Sample preparation is the first step to develop a good analytical method. The literature has shown excellent advantages of using solid-phase extraction for multiresidue pesticide analysis in water, including shorter analysis times, low solvent consumption, high preconcentration factor, good recoveries and precisions, applicability in a wide range of polarities and selective extractions.9-11 Huck and
Bonn12 reported solid-phase extraction with
polymeric-based sorbents with better results than those obtained with C-18. Pichon et al.13 described the difficulty of working
with analytes with a wide range of polarities, underlining the problems of elution and strong retentions.
For the determination of relatively volatile and thermally stable apolar or medium polarity compounds, GC-MS has given excellent results, especially simultaneous determinations of compounds with differing classes and properties.11,14 The advantages of GC-MS in SIM mode,
including high sensitivity, selectivity and robustness, have been pointed out by several authors.15,16
Therefore, this study aims to develop and validate a reliable, highly sensitive, low-cost method with a short analysis time. The method, based on solid-phase extraction and quantification by gas chromatography coupled to mass spectrometry (GC-MS) in the selective ion monitoring (SIM) mode was validated for a number of parameters including system suitability for routine analysis.
Experimental
Standards, reagents and solvents
Analytical standards of the pesticides evaluated (purity between 94.0 and 99.7%) were acquired from Dr. Ehrenstorfer (Augsburg, Germany). The internal standard, 1,3-diphenoxybenzene, was provided by Sigma-Aldrich (Poole, United Kingdom). Surrogate standards, 1,4-dichlorobenzene-d4, naftalene-d8, acenaftene-d10, antracene-d10, crisene-d12 and perilene-d12, were obtained from Chem Service (West Chester, USA). Working standard solutions were prepared in ethyl acetate.
Pesticide grade/analytical reagent grade ethyl acetate, dichloromethane and methanol were purchased from JT Baker (Phillipsburg, USA). Milli-Q purified water was obtained from Millipore (St. Quentin-in-Yvelines, France) and helium 99.999% was obtained from AGA
(Barueri-SP, Brazil). The following SPE cartridges were used for compound preconcentration: Strata-X® 30 mg per 3 mL
(Phenomenex, Torrance, USA), Nexus® 60 mg per 3 mL
(Varian, Palo Alto, USA), Oasis® 30 mg per 3 mL (Waters,
Milford, USA) and C18 500 mg per 6 mL (Phenomenex, Torrance, USA).
Apparatus
Determination was performed using an Agilent GC system (model HP 6890N) equipped with a split/splitless injector, liner of silanized quartz with 4 mm i.d. (effective volume 0.49 mL), and a 7683 autosampler for 100 vials (Wilmington, EUA). Chromatographic conditions were: HP5-MS low bleed capillary column (30 m × 0.25 mm i.d. × 0.25 µm film thickness); helium was used as a gas carrier; flow constant: 1.0 mL min-1; injection volume: 2 µL (pulsed
splitless: 15 psi for 1.5 min); injector temperature 250 ºC; GC temperature program: 50 oC (2 min), 30 oC min-1 up to
160 oC (5 min), 5 oC min-1 up to 180 oC and 10 oC min-1 up
to 270 oC (6 min). A HP 5973N Agilent quadrupole mass
spectrometer (Palo Alto, EUA) was operated in selective ion monitoring (SIM) mode, with ionization source by electron impact at 70 eV, transfer line at 280 °C, ion source at 230 °C and quadrupole at 150 °C.
In the SPE sample preparation stage, a manifold system with capacity for 12 cartridges (Phenomenex; Torrance, USA) and a vacuum pump (model TE-058, Tecnal; Piracicaba, Brazil) were used.
Chromatographic separation and ion selection
To determine the best temperature program, a retention time behavioral study was performed for all compounds, based on which, a multi-linear temperature program was adopted.
Selective ion monitoring (SIM) mode was utilized in order to achieve high selectivity and sensitivity. One ion was chosen for quantification and another for qualification, based on the best signal-noise ratios and the highest masses.
SPE preconcentration
Initially, the retention capacity results obtained for the sorbents Strata-X®, Nexus®, Oasis® and C18 were
Then, the cartridges were washed with a cartridge volume of purified water and dried for 30 min in the manifold system under vacuum; (iii) elution and redissolution: the analytes were eluted with 2 mL solvent in two steps (1 + 1 mL), with an interaction time of 1 min for each step. The solvent was removed by drying in water bath at 55 ºC for approximately 20 minutes. The analytes were redissolved by adding 0.5 mL of the redissolution solution containing the internal standard in ethyl acetate.
Method validation and quality assurance
Analytical curves were established by injecting 7 times each analytical solution containing the pesticides at concentrations between 1 and 1000 µg L-1. Linear regression
and polynomial equations were generated as a model of prediction. Internal standardization was adopted and application range was defined based on method linearity, quantification limits and maximum limits allowed in drinking water by Brazilian legislation.
Method selectivity was ensured by using SIM and by the absence of quantification and qualification ions in analyte retention time of a blank sample. In real samples, selectivity was ensured by the ratio between quantification and qualification ions with a tolerance of 20%. This tolerance can be increased to 30% close to the quantification limit.11
The limits of detection (LOD) and of quantification (LOQ) were established from the signal-noise ratio of quantification ions and qualification ions selected for each compound studied. Seven injections of the standard solution 10 µg L-1 were performed, with the exception
of chlordane, DDT and permethrin which are isomeric mixtures considered individually as fractions proportional to the peak heights of their respective isomers. Concentration levels near to the estimated quantification limits were chosen. The mean results for peak height were used for the coefficient of sensitivity calculation, which convert the signal into the concentration. The blank sample was injected 7 times. Mean standard deviation from the noise was determined. The lowest noise was established as its own unit due to the high signal stability in SIM mode, which presented lower deviation for all compounds than the unit of abundance. The LOD was established as the concentration where the ion of lowest abundance presented a peak height corresponding to 3 times the signal-noise ratio. For the LOQ, 10 times the signal-noise ratio was considered for quantification ions, as long as the qualification ion was at least 6 times this ratio. Therefore, both limits are guaranteed in a confirmatory way.17
Instrumental precision was evaluated from the results of 7 replicates for each concentration of the linearity
study. Relative standard deviation (RSD) was compared with the Horwitz curve.18 To evaluate the accuracy and
precision of the method in terms of repeatability and intermediate precision, blank samples were fortified at three different concentration levels 0.030, 0.100 and 0.300 µg L-1, identified as F1, F2 and F3, respectively.
These concentrations represent 1, 3.3 and 10 times the lowest limits established by Brazilian legislation for drinking water and allowed the evaluation of accuracy, in terms of recovery, and precision of the proposed method. Intermediate precision was evaluated in order to simulate a more real routine analysis situation, and was determined by six repetitions of the complete procedure using the same three concentration levels on three different days.
For routine assays, certain parameters should be periodically verified to guarantee system suitability and validity of results. The parameters chosen for this purpose were: peak area and retention time of the internal standard, efficiency, sensitivity, coefficient of determination, recovery of surrogate standards and selectivity. However, the detection of very low levels may not always be essential and it may be acceptable in some circumstances to define a practical reporting limit based on the proposed use of the analytical data.19,20 This would have the advantage of
reducing the technical difficulty of obtaining data and of reducing costs.
Application in real samples
The method was tested with 5 real samples with different characteristics: two samples of untreated water (water from superficial springs and wells) and three samples of water treated at water treatment facilities (water from creeks, rivers and lakes). The purpose was to include samples with different characteristics and differing levels of mineral salts, pH, turbidity, fulvic and humic acids, among other features. Samples were collected in glass recipients and stored in a dark place at temperatures between 1 and 4 ºC.
Results and Discussion
Chromatographic system
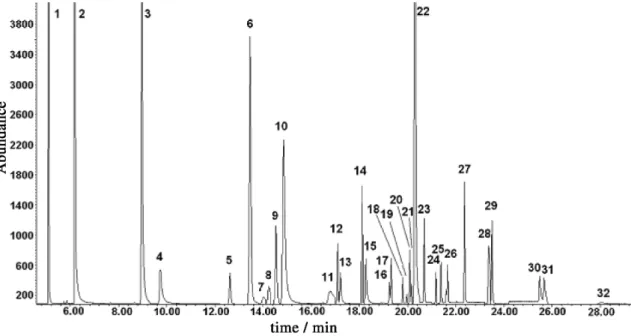
The chromatogram in Figure 2 shows the good separation obtained after the retention time and oven temperature studies.
SPE preconcentration
The polymeric sorbents Strata-X® (30 mg per 3 mL)
presented consistent good recoveries for the most of the studied pesticides and it was chosen for this method. Dichloromethane presented best results than ethyl acetate as eluent. The analytes were eluted with 2 mL dichloromethane in two aliquots of 1 mL and an interaction time of 1 min for each step. Dichloromethane is more volatile than ethyl acetate and permitted an easier evaporation step before GC-MS analysis.
Method validation
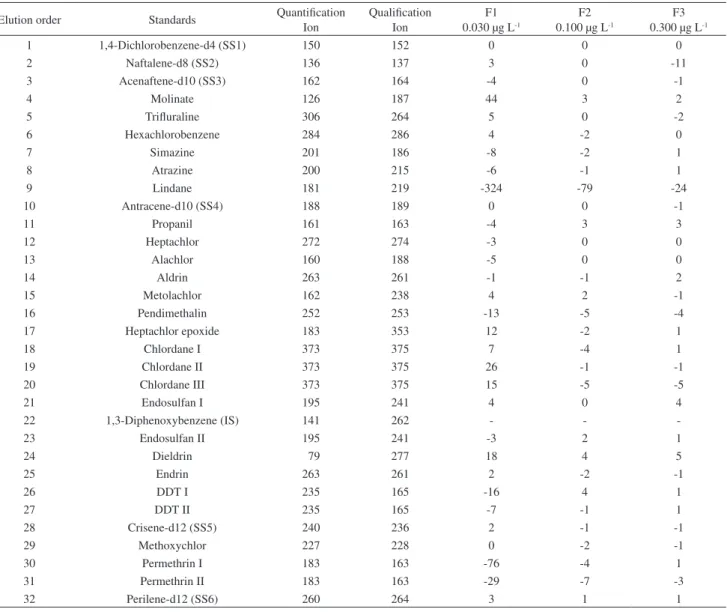
Method selectivity was shown to be adequate for the determination of the pesticide studies. Table 1 shows percentual difference between the recovery obtained for the quantification ion and the qualification ion of each compound. Maximum tolerance was 20% for levels F2 and F3 and 30% for level F1 and should be evaluated critically for each case.11
Although lindane had a systematic matrix effect on the qualification ion, it had a maximum residue limit (MRL) of 2 µg L-1 making the matrix effect negligible. Molinate
and permethrin also had a matrix effect on the qualification ion, but only for F1, which does not denote a problem for determinations with MRLs near 6 and20 µg L-1,
respectively.
Most of the pesticides presented r2 values greater than
0.99. Alachlor, atrazine, metolachlor, permethrin, propanil and simazine presented r2 values of 0.98, 0.97, 0.98, 0.98,
0.97 and 0.97, respectively. When polynomial equations were used a minimum r2 of 0.9997 was verified. In the
range studied, linearity was adequate for all compounds. However, for routine analyses a curve of three levels (12, 40 and 120 µg L-1), which correspond to the concentrations
in water of 0.030, 0.100 and 0.300 µg L-1, was used in order
to prioritize the best quantification of lower concentration levels. When concentrations above the working range are verified, a dilution of the extract for quantification should be performed.
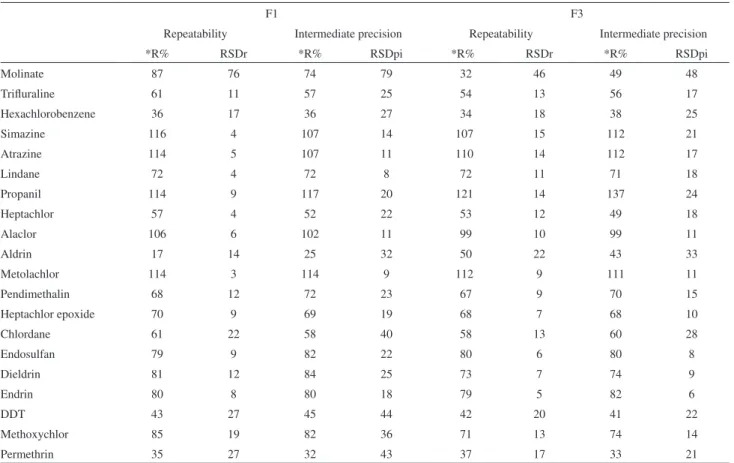
Results for instrumental precision are shown in Table 2. RSD values that meet Horwitz curve criteria are shown in the shaded area of Table 2. It is important to note that the lowest concentration level with acceptable precision is lower than 50% of the MRL, rendering instrumental precision adequate. Repeatability, intermediate precision and method recovery can be seen in Table 3. According to the Horwitz curve, for the concentration level of 0.030 µg L-1, the adequate RSD for repeatability (RSD
r) is
38% and adequate RSD for intermediate precision (RSDpi) is 76%. For the concentration level of 0.300 µg L-1, adequate
RSDr is 27% and RSDpi is 54%.
The results in bold type refer to compounds with MRL values at the F1 concentration level. Precision results were considered excellent. The other compounds were evaluated by the F3 concentration level as they presented MRLs over 0.300 µg L-1. Method precision was considered excellent.
Recoveries for each compound at the three fortification levels were very consistent. Hexachlorobenzene, aldrin, DDT and permethrin presented low recoveries.
All the pesticides presented signals greater than their
Table 1. Percentual difference between the recoveries obtained for the quantification ion and the qualification ion
Elution order Standards Quantification
Ion
Qualification Ion
F1 0.030 µg L-1
F2 0.100 µg L-1
F3 0.300 µg L-1
1 1,4-Dichlorobenzene-d4 (SS1) 150 152 0 0 0
2 Naftalene-d8 (SS2) 136 137 3 0 -11
3 Acenaftene-d10 (SS3) 162 164 -4 0 -1
4 Molinate 126 187 44 3 2
5 Trifluraline 306 264 5 0 -2
6 Hexachlorobenzene 284 286 4 -2 0
7 Simazine 201 186 -8 -2 1
8 Atrazine 200 215 -6 -1 1
9 Lindane 181 219 -324 -79 -24
10 Antracene-d10 (SS4) 188 189 0 0 -1
11 Propanil 161 163 -4 3 3
12 Heptachlor 272 274 -3 0 0
13 Alachlor 160 188 -5 0 0
14 Aldrin 263 261 -1 -1 2
15 Metolachlor 162 238 4 2 -1
16 Pendimethalin 252 253 -13 -5 -4
17 Heptachlor epoxide 183 353 12 -2 1
18 Chlordane I 373 375 7 -4 1
19 Chlordane II 373 375 26 -1 -1
20 Chlordane III 373 375 15 -5 -5
21 Endosulfan I 195 241 4 0 4
22 1,3-Diphenoxybenzene (IS) 141 262 - -
-23 Endosulfan II 195 241 -3 2 1
24 Dieldrin 79 277 18 4 5
25 Endrin 263 261 2 -2 -1
26 DDT I 235 165 -16 4 1
27 DDT II 235 165 -7 -1 1
28 Crisene-d12 (SS5) 240 236 2 -1 -1
29 Methoxychlor 227 228 0 -2 -1
30 Permethrin I 183 163 -76 -4 1
31 Permethrin II 183 163 -29 -7 -3
32 Perilene-d12 (SS6) 260 264 3 1 1
SS = surrogate standard; IS = internal standard.
Table 2. Instrumental precision evaluated for 10 concentration levels (n= 7)
Standards Concentration / (µg L
-1)
Horwitz curv
e
Alachlor Aldrin Dieldrin Atrazine Chlordane I Chlordane II Chlordane III DDT I DDT
II
Endosulfan I Endosulfan II Endrin Heptachlor Heptachlor epoxide He
xachlorobenzene
Lindane Metolachlor Methoxychlor Molinate Pendimethalin Permethrin I Permethrin II Propanil Simazine Trifluralin
Instrumental Precision-Relative Standard Deviation / (%)
P1 1 22 # 12 # # # # 7 46 10 ## 8 ## ## ## # # 16
P2 2.5 20 46 4 10 32 13 35 14 6 4 21 11 44 4 6 16 4 9 5 24 ## ## # # 9
P3 5 18 12 1 10 13 5 16 7 17 4 5 6 5 14 8 2 3 2 2 4 14 4 4 7 5 16
P4 10 16 10 4 9 4 4 8 6 18 6 9 9 2 5 8 5 5 7 8 6 9 12 16 9 9 7
P5 25 14 7 3 3 3 3 5 4 6 2 4 5 2 5 4 4 5 4 5 5 5 6 6 6 5 4
P6 50 12 1 3 4 1 3 3 6 5 4 1 2 1 4 3 4 3 2 7 5 2 9 11 4 4 4
P7 100 11 3 2 2 4 2 6 3 3 1 4 2 2 3 1 3 2 3 3 4 2 6 6 5 4 3
P8 250 10 3 7 3 3 2 3 3 8 2 1 1 2 3 2 3 2 2 4 4 1 7 7 5 3 4
P9 500 9 4 4 1 3 2 3 4 2 3 3 2 1 5 3 6 4 3 5 6 3 9 10 6 5 5
limits of quantification at fortification level of 0.030 µg L-1.
Table 4 shows the limits of quantification and the MRL values from Regulation MS 518/2004. The limits of quantification achieved with the proposed method are also adequate for the control of pesticide residues in drinking water in accordance to the European standard.21
The method developed was only incapable of adequately determining four of the pesticides from Regulation MS 518/2004: glyphosate and 2,4-D, which are not suitable for direct GC determination, and bentazone and pentachlorophenol, which presented sensitivity, but were not adequately recovered in the multiresidue extraction by SPE.
Method applicability in real samples and system suitability
Application of the method with real samples showed excellent performance in terms of system suitability. No pesticide was detected in the real samples evaluated.
At the concentration range between 0.030 and 0.300 µg L-1, the lowest result obtained for coefficient of
determination using the linear regression equation was 0.995. These results proved to be adequate for utilization
Table 4. Quantification limits of the proposed method and maximum residue limits established by Regulation MS 518/2004
Pesticides Quantification limit / (µg L-1)
MRL Regulation MS 518/2004 / (µg L-1)
Alachlor 0.023 20.0
Aldrin 0.010 0.03
Dieldrin 0.023 0.03
Atrazine 0.035 2
Chlordane 0.015 0.2
DDT 0.010 2
Endosulfan 0.033 20
Endrin 0.033 0.6
Heptachlor 0.023 0.03
Heptachlor epoxide 0.033 0.03
Hexachlorobenzene 0.003 1
Lindane 0.010 2
Metolachlor 0.018 10
Methoxichlor 0.023 20
Molinate 0.018 6
Pendimethalin 0.093 20
Permethrin 0.018 20
Propanil 0.035 20
Simazine 0.053 2
Trifluraline 0.023 20
Table 3. Results for precision and accuracy for F1 (0.030 µg L-1) and F3 (0.300 µg L-1) fortification levels
F1 F3
Repeatability Intermediate precision Repeatability Intermediate precision
*R% RSDr *R% RSDpi *R% RSDr *R% RSDpi
Molinate 87 76 74 79 32 46 49 48
Trifluraline 61 11 57 25 54 13 56 17
Hexachlorobenzene 36 17 36 27 34 18 38 25
Simazine 116 4 107 14 107 15 112 21
Atrazine 114 5 107 11 110 14 112 17
Lindane 72 4 72 8 72 11 71 18
Propanil 114 9 117 20 121 14 137 24
Heptachlor 57 4 52 22 53 12 49 18
Alaclor 106 6 102 11 99 10 99 11
Aldrin 17 14 25 32 50 22 43 33
Metolachlor 114 3 114 9 112 9 111 11
Pendimethalin 68 12 72 23 67 9 70 15
Heptachlor epoxide 70 9 69 19 68 7 68 10
Chlordane 61 22 58 40 58 13 60 28
Endosulfan 79 9 82 22 80 6 80 8
Dieldrin 81 12 84 25 73 7 74 9
Endrin 80 8 80 18 79 5 82 6
DDT 43 27 45 44 42 20 41 22
Methoxychlor 85 19 82 36 71 13 74 14
Permethrin 35 27 32 43 37 17 33 21
in routine analysis for any type of water that meets physicochemical parameters for potability. Soboleva and Ambrus22 make a good discussion on system suitability
studies that combine parameters of injection and detection. The results obtained in our study are in accordance with those presented by these authors.
Conclusions
The present method was shown to be adequate for the determination of most pesticides in drinking water, thus meeting requirements in the Brazilian legislation. The GC-MS in the SIM mode proved to be essential for quantification with adequate sensitivity and selectivity for pesticide residues in samples from a number of origins and that present high turbidity, without significant interference. The chromatographic parameters showed excellent results in terms of efficiency, resolution and total analysis time. The method was utilized for over a year without presenting significant modifications in retention times. The preconcentration factor of 400 times of the SPE step was essential for reaching Regulation MS 518/2004 limits. In the method development, a large number of factors were considered which significantly increased sensitivity and robustness. In the evaluation of precision, the results were excellent for all concentration levels studied when compared with values given by the Horwitz curve. Intermediate precision was also considered adequate, showing no differences on different days. Recoveries were consistent, regardless of the day and concentration level. Although some analytes presented low recoveries, the consistency of the results obtained and the use of surrogate standards make it possible to reliably establish a correction factor for the analysis of these analytes in real samples.
Acknowledgments
The authors acknowledge the financial support and fellowships from the Brazilian agencies CNPq and CAPES.
References
1. Hamilton, D. J.; Ambrus, A.; Dieterle, M.; Felsot, A. S.; Harris, C. A.; Holland, P. T.; Katayama, A.; Kurihara, N.; Linders, J.; Unsworth, J.; Wong, S.-S.; Pure Appl. Chem. 2003, 75, 1123.
2. Brazil, Ministry of Health, Regulation MS nº 518/2004, Available at: http://portal.saude.gov.br/portal/arquivos/pdf/ portaria_518_2004.pdf, accessed in October 2008.
3. Council Directive 98/83/EC of November 3, 1998 on the Quality ofWater Intended for Human Consumption; Official Journal of the European Communities L 330, December 5, 1998, pp. 32-54. 4. Rissato, S. R.; Libânio, M.; Giafferis, G. P.; Gerenutti, M.;
Quim. Nova2004, 27, 739.
5. Brondi, S. H. G.; Spoljaric, F. C.; Lanças, F. M.;J. Sep. Sci.
2005, 28, 2243.
6. Lanchote, V. L.; Bonato, P. S.; Cerdeira, A. L.; Santos, N. A. G.; Carvalho, D.; Gomes, M. A.; Water, Air, Soil Pollut. 2000, 118, 329.
7. Dores, E. F. G. C.; Carbo, L.; Ribeiro, M. L.; De-Lamonica-Freire, E. M.; J. Chromatogr. Sci.2008, 46, 585.
8. Primel, E. G.; Zanella, R.; Kurz, M. H. S.; Gonçalves, F. F.; Machado, S. L. O.; Marchezan, E.; Quim. Nova 2005, 28, 605. 9. Wells, M. J. M. In Sample Preparation Techniques in Analytical
Chemistry;Mitra, S., ed., Wiley-Interscience: Hoboken, NJ, USA, 2003, pp. 37-138.
10. Lanças, F. M.; Validação de Métodos Cromatográficos de Análise, Rima: São Carlos, 2004, p. 62.
11. Fernandez-Alba, A.; Chromatographic-Mass Spectrometric Food Analysis for Trace Determination of Pesticide Residue, Elsevier: Almeria, Spain, 2005, p. 487.
12. Huck, C. W.; Bonn, G. K.; J. Chromatogr., A 2000, 885, 51. 13. Pichon, V.; Charpak, M.; Henion, M. C.; J. Chromatogr., A
1998, 795, 83.
14. Reeve, R. N.; Introduction to Environmental Analysis, John Willey & Sons: West Sussex, UK, 2002. pp. 78-104. 15. Ahmed, F. E.; Trends Anal. Chem. 2001, 20, 649. 16. Balinova, A.; J. Chromatogr., A1996, 754, 125. 17. Currie, L. A.; Chemom. Intell. Lab. Syst. 1997, 37, 151. 18. Horwitz, W.; Validation: An Invisible Component of
Measurement, AOAC International: Gaithersburg, USA, 2003. p.10.
19. Spurlock, F.; Burow, K.; Dubrovsky, N.; J. Environ. Qual.2000, 29, 474.
20. CITAC/EURACHEM Guide; The Fitness for Purpose of Analytical Methods. A Laboratory Guide to Method Validation
and Related Topics, LGC UK: Middlesex, UK, 1998, p. 43. 21. Caldas, S. S.; Demoliner, A.; Primel, E. G.; J. Braz. Chem. Soc.
2009, 20, 125.
22. Soboleva, E.; Ambrus, A.; J. Chromatogr., A2004, 1027, 55.
Received: November 10, 2008